. 2024 Jul 3;15(1):5593.
doi: 10.1038/s41467-024-49884-9.

A(H2N2) and A(H3N2) influenza pandemics elicited durable cross-reactive and protective antibodies against avian N2 neuraminidases

Affiliations

A(H2N2) and A(H3N2) influenza pandemics elicited durable cross-reactive and protective antibodies against avian N2 neuraminidases

Zaolan Liang et al. Nat Commun. .

Abstract

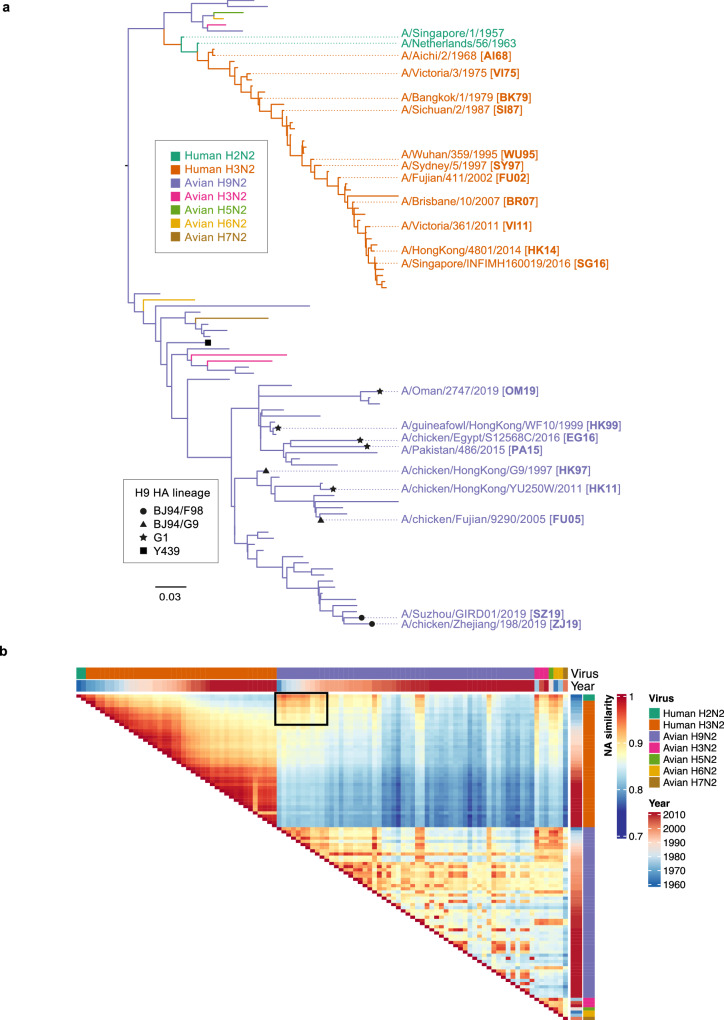
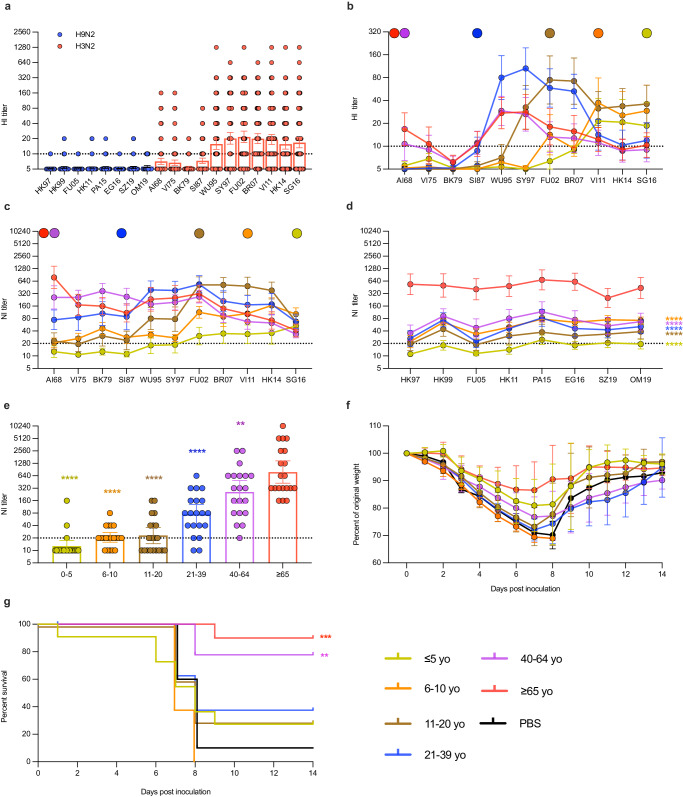
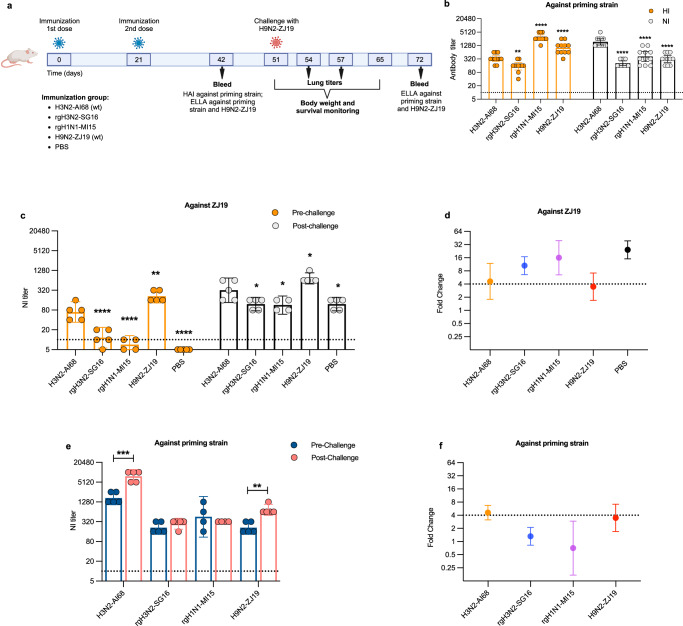
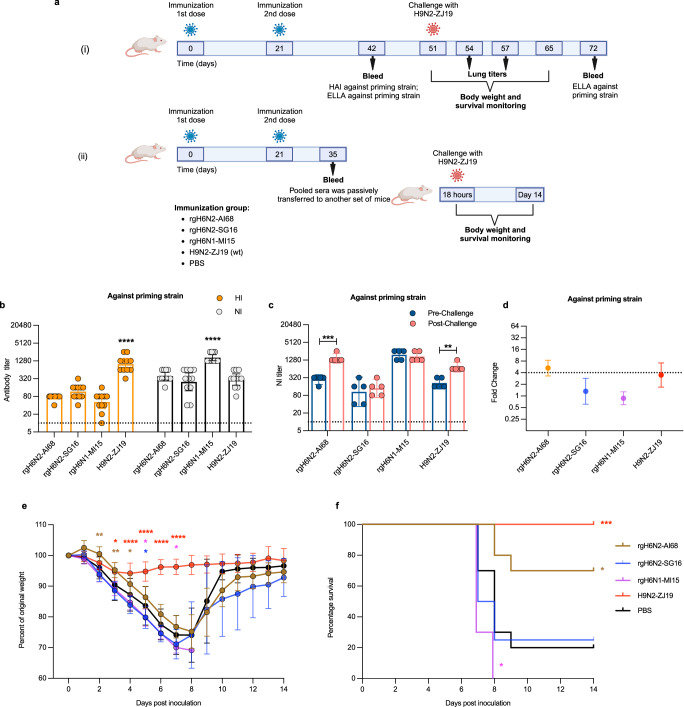
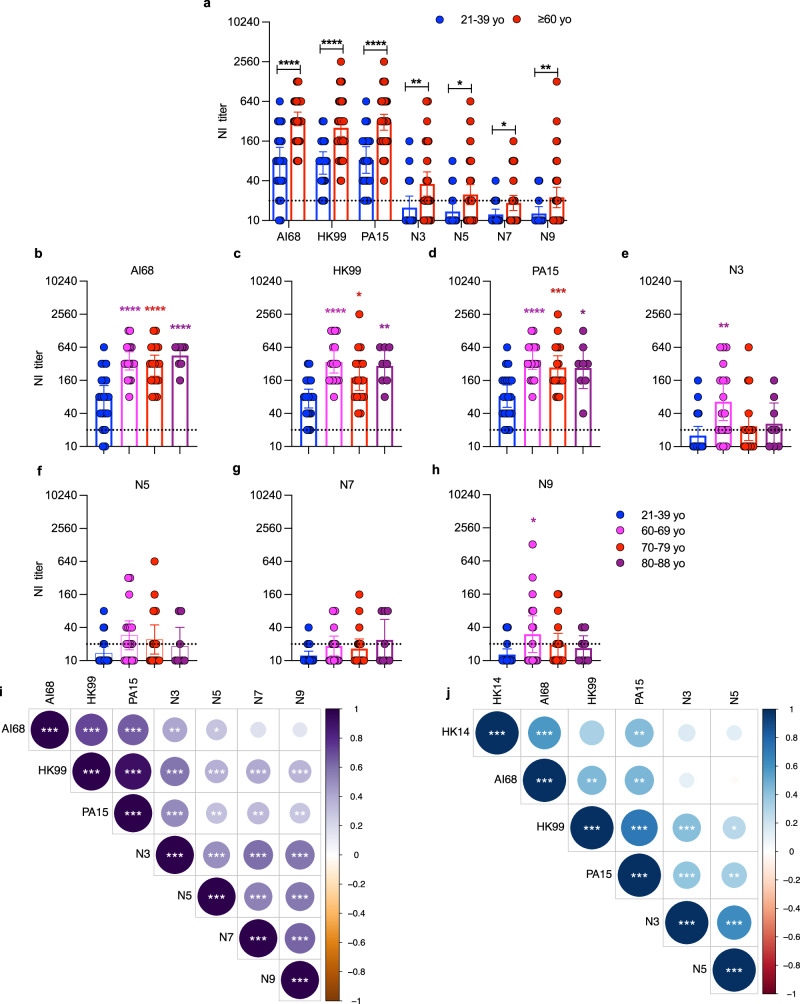
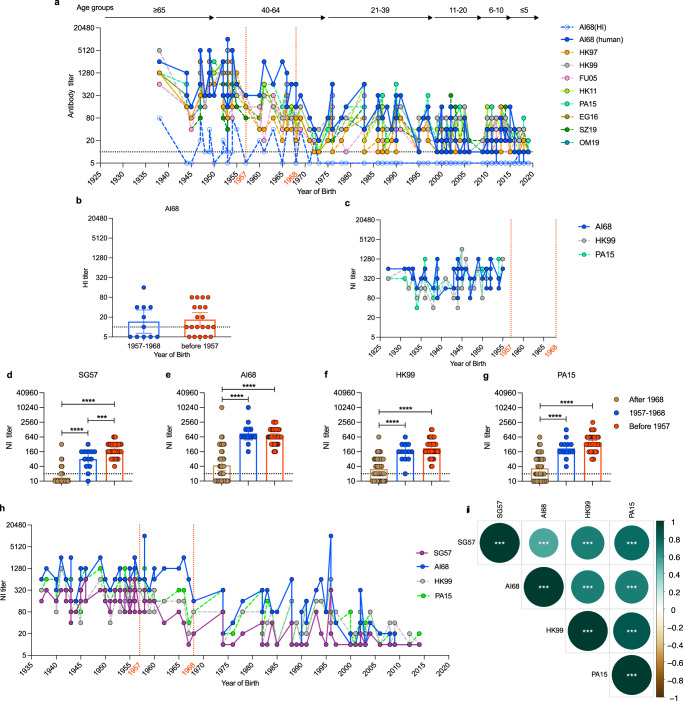
Human cases of avian influenza virus (AIV) infections are associated with an age-specific disease burden. As the influenza virus N2 neuraminidase (NA) gene was introduced from avian sources during the 1957 pandemic, we investigate the reactivity of N2 antibodies against A(H9N2) AIVs. Serosurvey of healthy individuals reveal the highest rates of AIV N2 antibodies in individuals aged ≥65 years. Exposure to the 1968 pandemic N2, but not recent N2, protected against A(H9N2) AIV challenge in female mice. In some older adults, infection with contemporary A(H3N2) virus could recall cross-reactive AIV NA antibodies, showing discernable human- or avian-NA type reactivity. Individuals born before 1957 have higher anti-AIV N2 titers compared to those born between 1957 and 1968. The anti-AIV N2 antibodies titers correlate with antibody titers to the 1957 N2, suggesting that exposure to the A(H2N2) virus contribute to this reactivity. These findings underscore the critical role of neuraminidase immunity in zoonotic and pandemic influenza risk assessment.


Conflict of interest statement

B.J.C. has consulted for AstraZeneca, Fosun Pharma, GlaxoSmithKline, Haleon, Moderna, Novavax, Pfizer, Roche, and Sanofi Pasteur. S.S.W. has received speakers honorarium from Sanofi Pasteur. All other authors declare no competing interests.

Figures

Fig. 1
Fig. 1. Evolutionary relationships and genetic similarity of human and avian N2 neuraminidases from 1957 to 2019.
a Maximum likelihood phylogenetic tree with branches colored by host and subtype. Representative strains used for serological testing are labeled, and abbreviations used in this study are shown in bold. b Heatmap of pairwise comparison of amino acid sequence similarities for human and avian N2 strains between 1957 to 2019, generated by using “ComplexHeatmap” package in R. Annotation on the right represents the NA amino acid sequence similarities, representative strains and year of virus isolation. Highly similar sequences between avian and human N2 are boxed.
Fig. 2
Fig. 2. Cross-reactive and protective potential of human N2 antibodies against subtype A(H9N2) influenza A viruses in Guangzhou cohort samples.
a Hemagglutination-inhibition (HI) titers against representative strains of subtype A(H9N2) AIV and antigenically-distinct human A(H3N2) influenza viruses in human circulation since 1968. Age-stratified b HI and c neuraminidase-inhibition (NI) antibody profiles against selected human A(H3N2) viruses. d Age-stratified NI-antibody profile against eight A(H9N2) AIV isolated between 1997 to 2015. e Age-stratified NI-titers against the 1968 pandemic strain, A/Aichi/2/1968 (H3N2) (AI68). f Weight loss and g survival curves of mice inoculated with pooled human sera from respective age-groups. All NI-antibody was detected using enzyme-linked lectin assay (ELLA) using recombinant viruses bearing the target NA with a HA gene from A/teal/Hong Kong/W312/1997 (H6N1) and the internal genes of A/Puerto Rico/8/1934 (H1N1) (PR8). Colored circles above the graph indicate those viruses circulating at the time of birth of the oldest participant in each age group. Dotted lines in (ae) indicate limits of detection. The bar graphs indicate the geometric mean antibody titer with 95% confidence intervals, with n = 20 individuals per age group. Statistical significance in (d) was calculated using two-sided two-way ANOVA compared to ≥ 65-year-old age group using Dunnett’s multiple comparison test (****p < 0.0001 for all age groups). Statistical significance in (d) was calculated using two-sided two-way ANOVA compared to ≥ 65 yo group, adjusted with Dunnett’s multiple comparison test (****p < 0.0001 for all age groups). Statistical significance in (e) was calculated using two-sided one-way ANOVA compared ≥ 65 yo group, adjusted with Dunnett’s multiple comparison test (****p < 0.0001 for ≤ 5 yo, 6–10 yo, 11–20 yo and 21–39 yo, **p = 0.0057 for 40–64 yo). Weight loss was expressed as mean ± standard deviation. Survival rate in g was compared using two-sided Gehan-Breslow-Wilcoxon test with PBS as the reference group (**p = 0.0024 for 40–64 yo, ***p = 0.0002 for ≥ 65 yo). Each group had n = 10 mice, except for the 6–10 yo group and 21–39 yo group which had 8 mice, and the 40-64 yo group which had 9.
Fig. 3
Fig. 3. Antigenic relationship between AI68 N2 with an avian N2.
a Experimental schema of the prime-challenge experiment. Groups of mice were immunized with two-doses of a wild-type (wt) A/Aichi/2/1968 (H3N2) (AI68), rg-derived A/Singapore/INFIMH160019/2016 (H3N2) (SG16), rg-A/Michigan/45/2015 (H1N1) (MI15) or wt-A/chicken/Zhejiang/198/2019 (H9N2) (ZJ19) and subsequently challenged with ZJ19. b Hemagglutination-inhibition (HI) and neuraminidase inhibition (NI) antibody profiles at Day 42 post-immunization against the priming viruses (n = 11 mice/group). c NI antibody titers of mice in each immunization group and d its associated fold-change against ZJ19 before and after challenge. e NI antibody titers of mice in each immunization group and f its associated fold-change against the priming viruses before and after challenge. n = 5 mice/group, except for MI15 which had n = 4. All NI-antibody was detected by enzyme-linked lectin assay (ELLA) using recombinant viruses bearing the target NA with a HA gene from A/teal/Hong Kong/W312/1997 (H6N1) and the internal genes of A/Puerto Rico/8/1934 (H1N1) (PR8). Dotted lines in b, c and e indicate limits of detection. The bar graphs indicate the geometric mean antibody titer with 95% confidence intervals. Statistical significance in bc was calculated using two-sided one-way ANOVA with the H3N2-AI68 group as reference, adjusted with Dunnett’s multiple comparison test (For b, in HI assay, **p = 0.0026 for rgH3N2-SG16, ****p < 0.0001for rgH1N1-MI15, H9N2-ZJ19; in NI assay, ****p < 0.0001 for rgH3N2-SG16, rgH1N1-MI15, H9N2-ZJ19; for c, in pre-challenge **p = 0.0031 for H9N2-ZJ19, ****p < 0.0001 for rgH3N2-SG16, rgH1N1-MI15 and PBS; in post-challenge *p = 0.0112 for rgH3N2-SG16, *p = 0.0104 for rgH1N1-MI15, *p = 0.0316 for H9N2-ZJ19, *p = 0.0112 for PBS). Statistical significance between paired samples in e was analyzed using two-sided paired t-test (***p = 0.0004 for H3N2-AI68, **p = 0.0086 for H9N2-ZJ19). Figure 3a created with BioRender.com released under a Creative Commons Attribution-NonCommercial-NoDerivs 4.0 International license.
Fig. 4
Fig. 4. Protective capacity of the 1968 A(H3N2) pandemic N2 antibody against subtype A(H9N2) AIV infection.
a Experimental schema of (i) prime-challenge and (ii) passive transfer experiment. Groups of mice (for i; n = 11/group, for (ii); n = 14/group for immunization, n = 10/group, except n = 8 for rgH6N2-SG16 group, for challenge) were immunized with two-doses of recombinant H6Nx viruses bearing the NA from A/Aichi/2/1968 (H3N2) (AI68), A/Singapore/INFIMH160019/2016 (H3N2) (SG16), or A/Michigan/45/2015 (H1N1) (MI15), or wild-type (wt) A/chicken/Zhejiang/198/2019 (H9N2) (ZJ19). From experiment (i), b hemagglutination-inhibition (HI) and neuraminidase inhibition (NI) antibody profiles at Day 42 post-immunization against priming strain. c NI antibody profiles and d its associated fold change against priming viruses before and after challenge with ZJ19 at Day 72. From experiment (ii), e weight loss and f survival of mice that received pooled immune sera after being challenged with ZJ19. NI-antibody was detected by enzyme-linked lectin assay (ELLA) using recombinant viruses bearing the target NA with a HA gene from A/teal/Hong Kong/W312/1997 (H6N1) and the internal genes of A/Puerto Rico/8/1934 (H1N1) (PR8). Dotted lines in (b) and (c) indicate limits of detection. The bar graphs indicate the geometric mean antibody titer with 95% confidence intervals. Statistical significance in (b) was calculated using two-sided one-way ANOVA using rgH6N2-AI68 group as reference, adjusted with Dunnett’s multiple comparison test (in HI assay, ****p < 0.0001 for H9N2-ZJ19; in NI assay, ****p < 0.0001 for rgH6N1-MI15). Statistical significance in (c) was analyzed using two-sided paired t-test (**p = 0.0086 for H9N2-ZJ19, ***p = 0.0006 for rgH6N2-AI68). Weight loss in (e) was expressed as mean ± standard deviation, with statistical difference compared to the PBS group using two-sided, adjusted with Dunnett’s multiple comparison test from days 0 to 7 post-inoculation (days 2 *p = 0.0047 for rgH6N2-AI68; days 3 *p = 0.0106 for H9N2-ZJ19, **p = 0.0026 for rgH6N2-AI68; days 4, *p = 0.0467 for rgH6N2-AI68, ****p < 0.0001 for H9N2-ZJ19; days 5 *p = 0.0411 for rgH6N2-SG16, *p = 0.0239 rgH6N1-MI15, ****p < 0.0001 for H9N2-ZJ19; days 6, ****p < 0.0001 for H9N2-ZJ19; days 7, *p = 0.0213 for rgH6N1-MI15, ****p < 0.0001 for H9N2-ZJ19). Survival rate in (f) was compared to PBS group using two-sided Gehan-Breslow-Wilcoxon test (*p = 0.0128 for rgH6N2-AI68, *p = 0.0411 for rgH6N1-MI15, ***p = 0.0005 for H9N2-ZJ19). Figure 4a created with BioRender.com released under a Creative Commons Attribution-NonCommercial-NoDerivs 4.0 International license.
Fig. 5
Fig. 5. Antibody cross-reactivity to avian neuraminidase (NA) subtypes in the CARES samples.
a Neuraminidase-inhibition (NI) antibody titers in older (≥60 yo, n = 43) and younger adults (21-39 yo, n = 20) to the N2 of A/Aichi/2/1968 (H3N2) (AI68) and avian N2s (from H9N2; HK99 and PA15), N3, N5, N7 and N9. Age-stratified NI-titers against b AI68, c HK99, d PA15, e N3, f N5, g N7 and h N9. Correlation of i baseline NI titers amongst the different NA subtypes and j post-infection NI-titer fold-change between reference infection strain A/Hong Kong/4801/2014 (H3N2) (HK14) with the different NA subtypes. NI-antibody was detected with ELLA using rgH6Nx viruses containing the NA genes of HK14, AI68, HK99, PA15, N3, N5, N7 and N9. Dotted lines indicate limits of detection. The bar graphs indicate the geometric mean antibody titer with 95% confidence intervals. Sample sizes; 60-69 (n = 17), 70-79 (n = 18) and 80-88 yo (n = 8). Statistical significance in (a) was analyzed using two-sided unpaired t-test (*p = 0.0102 for N5, *p = 0.0121 for N7, **p = 0.0052 for N3, **p = 0.0098 for N9, ****p < 0.0001 for AI68, HK99 or PA15). Statistical differences in bh was compared to the 21-39 yo using two-sided one-way ANOVA, adjusted with Dunnett’s multiple comparison test. For b, ****p < 0.0001 for all age groups. For c, *p = 0.0139 for 70-79 yo, **p = 0.0023 for 80-88 yo, ****p < 0.0001 for 60-69 yo. For d, *p = 0.0114 for 80-88 yo, ***p = 0.0007 for 70-79 yo, ****p < 0.0001 for 60-69 yo. For e, **p = 0.0017 for 60-69 yo. For h, *p = 0.0328 for for 60-69 yo. Correlations in i and j were reported by Spearman’s correlation for each comparison using two-sided test and visualized using the ‘corrplot’ package (R version 0.92), and p-values were adjusted by controlling for the False Discovery Rate using the Benjamini-Hochberg method. In i; for AI68, -vs N3: **p = 0.003, -vs N5: *p = 0.017, - vs HK99 or PA15: ***p < 0.001; for HK99, -vs PA15, N3, N5, N7 or N9: ***p < 0.001, for PA15, -vs N5: **p = 0.001, -vs N7: **p = 0.001, -vs N9: **p = 0.007, -vs N3: ***p < 0.001; for N3, -vs N5, N7 or N9: ***p < 0.001; for N5, vs -N7 or N9: ***p < 0.001; for N7, -vs N9: ***p < 0.001. In j, for HK14, -vs PA15: **p = 0.010, -vs AI68: ***p < 0.001; for AI68, -vs HK99: **p = 0.010, -vs PA15, **p = 0.010; for HK99, -vs N5: *p = 0.015, -vs PA15 or N3: ***p < 0.001; for PA15, -vs N5: **p = 0.001, for N3: ***p < 0.001; -vs N5: ***p < 0.001.
Fig. 6
Fig. 6. Antibodies cross-reactivity of neuraminidase between A/Aichi/2/1968 (H3N2), A/Singapore/1/1957 (H2N2) and avian A(H9N2).
a The NI antibody profile against the NA of A/Aichi/2/1968 (H3N2) (AI68) and avian A(H9N2), and the HI antibody profile against AI68, as determined for Fig. 2, when stratified by year of birth. The age groups depicted in Fig. 2 are indicated on top of the graph. b HI-titer against AI68 in individuals born in between 1957 and 1968 (n = 11) and before 1957 (n = 20), as determined for Fig. 2. c The NI antibody profile against AI68 and avian A(H9N2) NA from CARES cohort samples, n = 43 individuals. dg NI-titer against NA of A/Singapore/1/1957 (H2N2) (SG57), AI68 and two representative avian N2 from A/guinea fowl/Hong Kong/WF10/1999 (H9N2) (HK99), A/Pakistan/486/2015 (H9N2) (PA15) in the EPI-HK cohort. Analyzes were stratified to individuals after 1968 (n = 47), between 1957 to 1968 (n = 13), and individuals born before 1957 (n = 45). h The NI antibody profile of the EPI-HK participants against human N2; SG57 and AI68, and avian N2; HK99 and PA15, when stratified by year of birth. i Correlation of NI titers between SG57 N2 and the different neuraminidase subtypes in n = 58 individuals born in or before 1968 from EPI-HK cohort. Dashed lines indicate the 1957 A(H2N2) and 1968 A(H3N2) pandemics. Dotted lines indicate limits of detection. The bar graphs indicate the geometric mean antibody titer with 95% confidence intervals. Statistical significance in b was analyzed using two-sided unpaired t-test. Statistical significance between different age groups in dg was analyzed using two-sided one-way ANOVA, adjusted with Tukey’s multiple comparisons test (***p = 0.0008 for 1957-1968 vs before 1957, ****p < 0.0001 for after 1968 vs 1957-1968 or 1968 vs before 1957 in (d); ****p < 0.0001 for after 1968 vs 1957-1968 or 1968 vs before 1957 in e, f or g). Correlation in i was reported by Spearman’s correlation for each comparison using two-sided test and visualized using the ‘corrplot’ package (R version 0.92), and p-values were adjusted by controlling for the False Discovery Rate using the Benjamini-Hochberg method (***p < 0.001 for each pairwise comparison).

Similar articles

Cited by

References

    1. Xie R, et al. The episodic resurgence of highly pathogenic avian influenza H5 virus. Nature. 2023;622:810–817. doi: 10.1038/s41586-023-06631-2. - DOI - PubMed
    1. Philippon DAM, Wu P, Cowling BJ, Lau EHY. Avian influenza human infections at the human-animal interface. J. Infect. Dis. 2020;222:528–537. doi: 10.1093/infdis/jiaa105. - DOI - PubMed
    1. Cowling BJ, et al. Comparative epidemiology of human infections with avian influenza A H7N9 and H5N1 viruses in China: a population-based study of laboratory-confirmed cases. Lancet. 2013;382:129–137. doi: 10.1016/S0140-6736(13)61171-X. - DOI - PMC - PubMed
    1. Cheung JTL, et al. Determining existing human population immunity as part of assessing influenza pandemic risk. Emerg. Infect. Dis. 2022;28:977–985. doi: 10.3201/eid2805.211965. - DOI - PMC - PubMed
    1. Chen YQ, et al. Influenza infection in humans induces broadly cross-reactive and protective neuraminidase-reactive antibodies. Cell. 2018;173:417–429.e410. doi: 10.1016/j.cell.2018.03.030. - DOI - PMC - PubMed

MeSH terms