. 2024 Jul 3;15(1):5583.
doi: 10.1038/s41467-024-49951-1.

Flotillin-mediated stabilization of unfolded proteins in bacterial membrane microdomains

Affiliations

Flotillin-mediated stabilization of unfolded proteins in bacterial membrane microdomains

Marta Ukleja et al. Nat Commun. .

Abstract

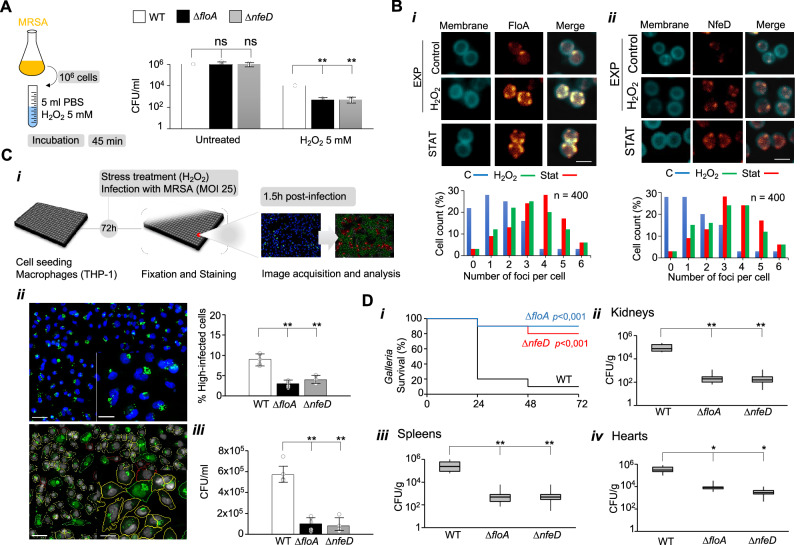
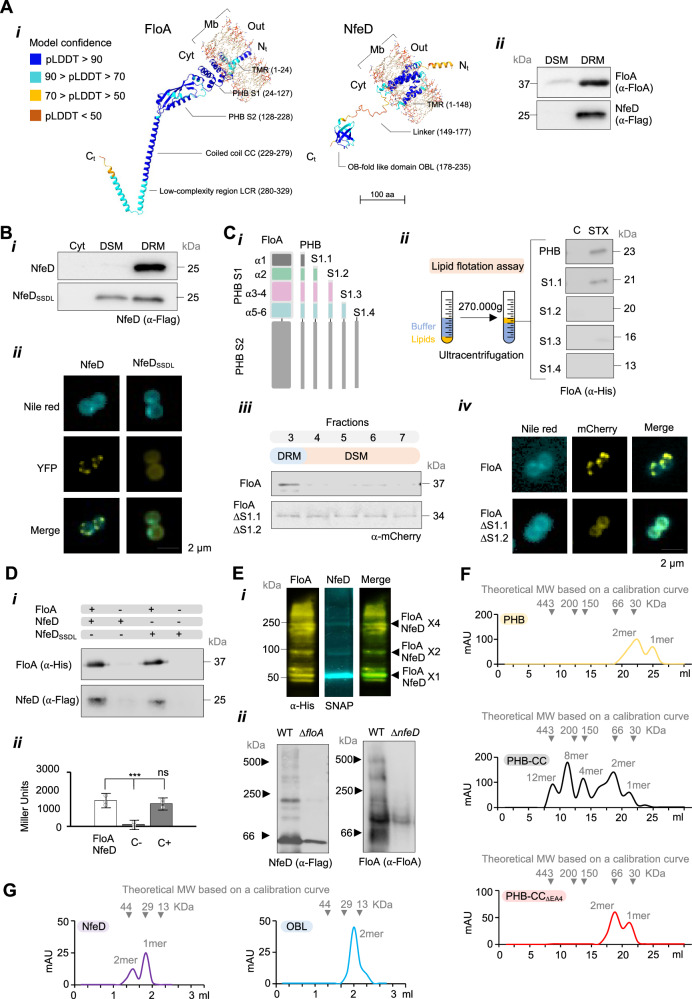
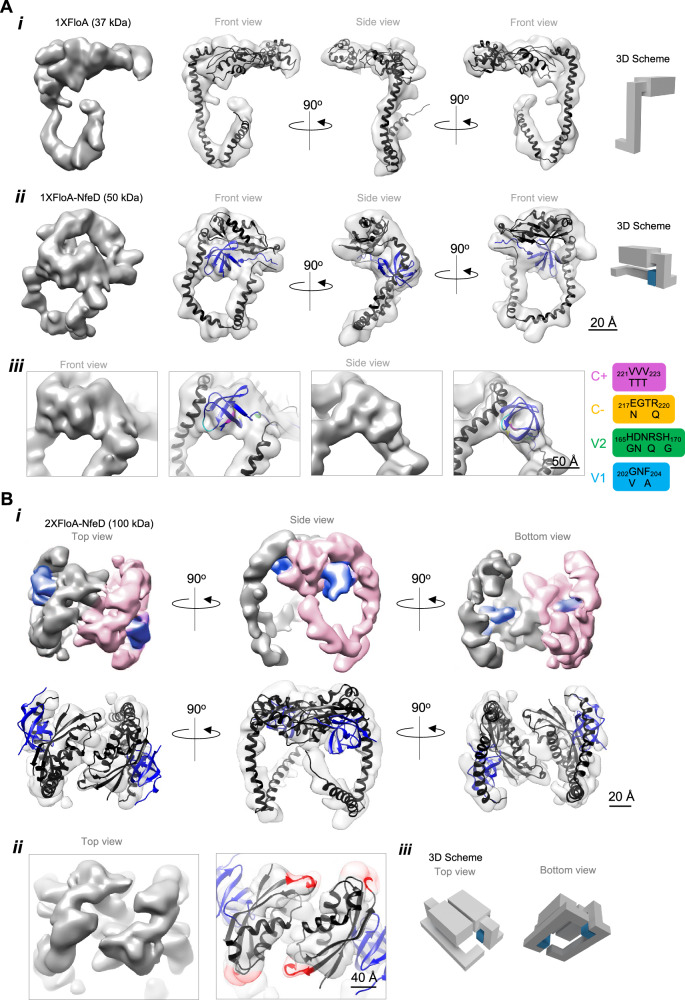
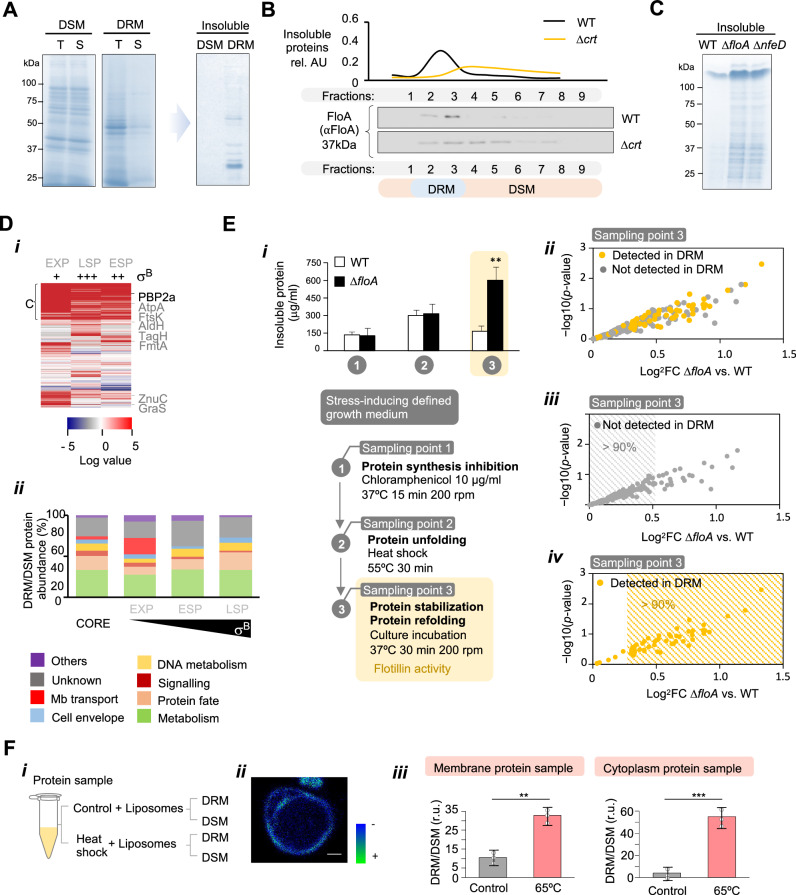
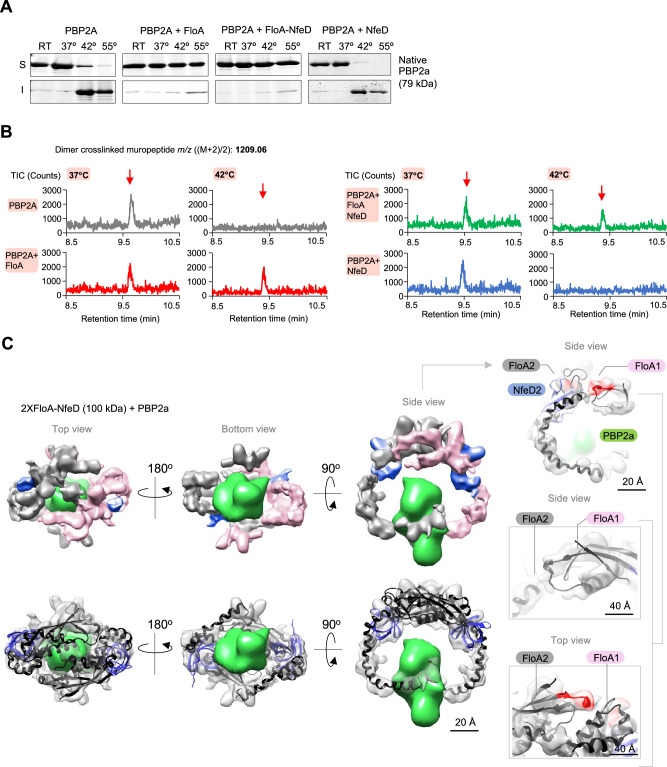
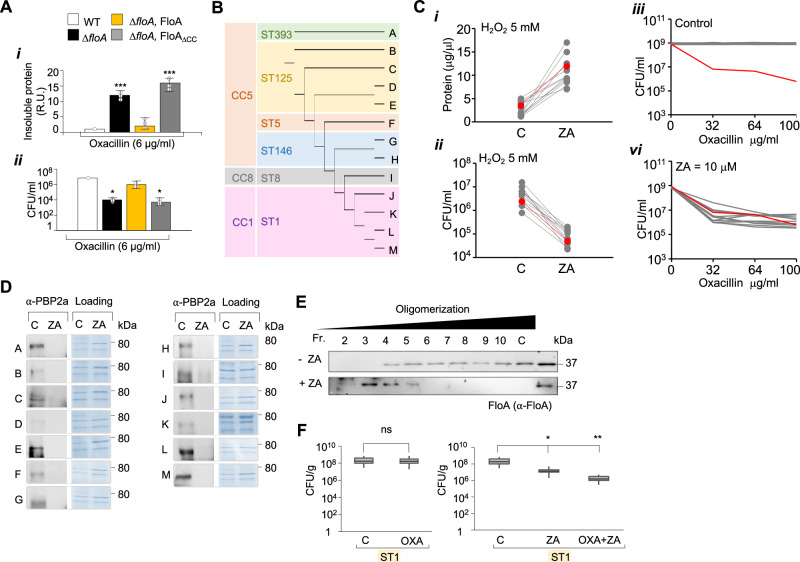
The function of many bacterial processes depends on the formation of functional membrane microdomains (FMMs), which resemble the lipid rafts of eukaryotic cells. However, the mechanism and the biological function of these membrane microdomains remain unclear. Here, we show that FMMs in the pathogen methicillin-resistant Staphylococcus aureus (MRSA) are dedicated to confining and stabilizing proteins unfolded due to cellular stress. The FMM scaffold protein flotillin forms a clamp-shaped oligomer that holds unfolded proteins, stabilizing them and favoring their correct folding. This process does not impose a direct energy cost on the cell and is crucial to survival of ATP-depleted bacteria, and thus to pathogenesis. Consequently, FMM disassembling causes the accumulation of unfolded proteins, which compromise MRSA viability during infection and cause penicillin re-sensitization due to PBP2a unfolding. Thus, our results indicate that FMMs mediate ATP-independent stabilization of unfolded proteins, which is essential for bacterial viability during infection.


Conflict of interest statement

The authors declare no competing interest

Figures

Fig. 1
Fig. 1. FloA and NfeD are required for MRSA survival during infection.
A Bacterial survival, measured as CFU/mL, of the different MRSA strains grown in TSB medium with or without 5 mM H2O2. Differences were measured by one-way ANOVA with the Tukey test for multiple comparisons; ** p < 0.01, ns = not significant. Data are shown as mean ± SD of three independent experiments (n = 3). B Upper panel: fluorescence microscopy micrographs of FloA-YFP (i) or NfeD-YFP (ii) labeled MRSA cells collected from untreated exponentially-growing cells (EXP control), H2O2-treated cultures at exponential (EXP H2O2) or stationary (STAT) phases of growth. Scale bar = 2 μm. Bottom panel: Quantitative determination of the number of fluorescence foci per cell in the labeled strains (sample of 400 cells). C MRSA intracellular replication in THP1 cells (MOI 25) at 1.5 h.p.i, evaluated by fluorescence microscopy-based infection assay and CFUs (i) Schematic representation of the infection workflow. (ii) Fluorescence microscopy image (upper panel) and corresponding image segmentation (lower panel) of THP1 cells infected with MRSA. In the original image, the nucleus and MRSA are shown in blue and green, respectively. In the segmentation panel, non-infected cells are outlined in red, infected cells with low and high bacterial intracellular levels are outlined in yellow and outlined/shaded in green, respectively (scale bar = 100 and 50 mm in the uncropped and zoom image, respectively). Differences were measured by one-way ANOVA with the Tukey test for multiple comparisons **p < 0.01. Data are shown as mean ± SD of three independent experiments (n = 3) (iii) Quantification of intracellular S. aureus by CFU. Differences were measured by one-way ANOVA with the Tukey test for multiple comparisons; **p < 0.01. Data are shown as mean ± SD of three independent experiments (n = 3). D (i) in vivo infection assays using an invertebrate infection model. Galleria mellonella were infected with different MRSA strains (106 CFU). Surviving larvae were counted after 48 h of incubation (n = 15 larvae/group; 3 independent experiments). Differences in survival were analyzed by the log-rank test. (ii–iv) in vivo infection assays using a murine sepsis model. Mice were infected intraperitoneally (n = 10; 3 × 107 CFU) and infections were allowed to progress for two days before the infected organs were collected and CFUs counted. Quantification of bacterial loads in kidneys (ii), spleens (iii), and hearts (iv). Results were examined by one-way ANOVA with the Tukey test for multiple comparisons. Top and bottom of the box indicates the 75th and 25th percentile, respectively. Whiskers extend to 1.5 times the interquartile range from the box. *p < 0.05, **p < 0.01.
Fig. 2
Fig. 2. FloA and NfeD recognize FMM lipids and concentrate in FMM to oligomerize.
A (i) AlphaFold2 structure prediction of flotillin FloA (left) and NfeD (right) colored by per-residue confidence score (pLDDT). TMR is transmembrane region. PHBS1 is PHB subdomain-1; S2 subdomain-2. CC is the coiled-coil region and LCR is the low-complexity region. In NfeD, the OBL is OB-like domain of NfeD. (ii) Immunodetection of FloA (37 kDa) or NfeD (26 kDa) in an FMM-enriched membrane fraction (DRM) and a phospholipid-enriched membrane fraction (DSM). B (i) Immunodetection of NfeD or NfeDSSDL variants in MRSA fractionated extracts; Cytoplasm Cyt or DSM, DRM membrane fractions. (ii) Fluorescence micrographs of NfeD-YFP or NfeDSSDL-YFP in MRSA cells. Scale bar = 2 μm. C (i) Diagram showing the purified PHB variants lacking different PHB-S1 α-helices. (ii) Lipid flotation assay. After centrifugation, lipids migrate to the low-density sucrose fraction at the tube top. PHB was then immunodetected in the fractions at the tube top. C is a control assay using phosphatidylglycerol. STX is purified staphyloxanthin. (iii) Immunodetection of WT FloA and a FloA variant lacking α1-2 of PHB-S1 in MRSA extracts fractionated in a glycerol gradient. Cytoplasm Cyt or DSM, DRM membrane fractions. (iv) Fluorescence micrographs of FloA-mCherry or FloAΔS1α1-2-mCherry in MRSA cells. Scale bar = 2 μm. D (i) FloA immunodetection in protein samples co-eluted with NfeD-Flag. The presence or absence of the prey (FloA) or bait (NfeD-Flag) is represented at the top of the panel with + or –, respectively. (ii) Quantification of FloA-NfeD interaction efficiency in a β-galactosidase assay using a bacterial two-hybrid analysis (B2H). Negative control (C−) is empty plasmids and positive control (C+) is Zip interaction. Data are shown as mean ± SD of three independent experiments (n = 3). E (i) FloA and NfeD dual labeling in SDS-PAGE of crosslinked MRSA membrane extracts. NfeD bands colocalize with FloA bands. FloA binds many client proteins and may generate additional bands of lower intensity. (ii) BN-PAGE and immunoblotting to detect FloA and NfeD oligomers in WT and mutants. High-MW oligomers are missing in the mutants. F Size-exclusion chromatography (SEC) profiles of soluble FloA variants. Top panel is PHB domain. The center panel is PHB domain + CC and LCR regions (PHB-CC) and the bottom panel is the PHB variant altered in the fourth EA repeat of the CC region (PHB-CCΔEA4). Arrows show protein standards for calibration. G SEC profiles of the native NfeD (upper panel) or purified OBL (lower panel).
Fig. 3
Fig. 3. Cryo-EM structure of FloA and FloA-NfeD.
A (i) FloA cryo-EM map (left) and different views of the fitted AlphaFold2 atomic model (right). (ii) FloA-NfeD cryo-EM map (left), and different views of the fitted AlphaFold2 atomic model (right). Schematic representation of FloA and FloA-NfeD organizational structure are shown on the right. (iii) Zoomed-in views of the EM density for the area of FloA that binds the OB-fold of NfeD. Cryo-EM map is shown in the left panel and the fitted AlphaFold2 atomic model is shown in the right panel. The residues altered in the OB-fold by site-directed mutagenesis are colored and described on the right. B (i) Cryo-EM map of the FloA-NfeD dimer with flexible fitting of the AF2 Multimer predicted model for the FloA-NfeD dimer. Different views of the FloA-NfeD dimer cryo-EM map. One FloA monomer is labeled in pink and the other FloA monomer in gray. The OBL of NfeD is shown in blue. In the FloA-NfeD dimer, the OBL caused the bending of the flexible CC-LCR tentacles to position them laterally in a clamp-shaped conformation. (ii) Zoomed-in views of the EM density for the area of PHB-PHB dimerization. The cryo-EM map is shown in the left panel and the fitted AlphaFold2 atomic model is shown in the right panel. The proximal regions in the dimer that were detected by DSS cross-linking are marked in red. (iii) Schematic representation of 2xFloA-NfeD organizational structure. FloA is represented in gray whereas the OB fold of NfeD is represented in blue.
Fig. 4
Fig. 4. FMM recruits client proteins in their unfolded state.
A Left, SDS-PAGE of total (T) and soluble (S) protein fractions of DRM and DSM of MRSA cells. Right, SDS-PAGE of the insoluble protein fraction of DRM and DSM of MRSA cells. The insoluble protein fraction has been concentrated compared to the total and soluble fractions. B Relative amount of insoluble proteins in DRM fraction compared to the DSM fraction. The insoluble proteins concentrate in fractions 2 and 3 of the gradient, where most FloA signal localizes. The Δcrt mutant shows a homogenous distribution of FloA and insoluble proteins in DRM and DSM. C SDS-PAGE of insoluble proteins in standardized cell extracts of different MRSA mutants. D MS-based quantification of the DRM and DSM proteome in the exponential (EXP), late stationary phase (LSP) and early stationary phase (ESP) of growth. (i) Heat map showing the protein abundance ratio in DRM and DSM fractions (determined via unsupervised hierarchical clustering). Red denotes a DRM increase relative to DSM, and blue a reduction. Gray boxes indicate missing values. PBP2a and other client proteins are highlighted. C indicates the core proteins. (ii) Functional classification of DRM proteins, according to the TIGRFAMM database. E (i) Upper panel: Quantification of insoluble proteins vs. soluble proteins upon inhibition of protein synthesis (sampling point 1), heat shock treatment (sampling point 2) or incubation at 37 °C (sampling point 3). Results were examined by Student’s t test; **p < 0.01. Data are shown as mean ± SD of three independent experiments (n = 3). Bottom panel: Diagram of the in vivo assay for the accumulation of unfolded proteins at the FMM. (ii) MS-based identification and analysis of the insoluble proteins at sampling point 3 in ΔfloA vs. WT. The proteome database was cross-checked with the proteome of the FMM-enriched fraction (DRM) (D). The most represented insoluble proteins in ΔfloA were detected as FMM proteins (>90% of the total) (iii), whereas low-represented insoluble proteins were rarely detected in FMM (>90% of the total) (iv). F (i) Diagram of the in vitro assay for the accumulation of insoluble proteins at the FMM. Control native or previously insoluble proteins were embedded in STX-PG containing liposomes and the protein distribution pattern was analyzed. (ii) Confocal fluorescence microscopy image of C-Laurdan staining of STX-PG containing liposomes. C-Laurdan reports membrane regions with greater hydrophobicity by switching fluorescence from blue (–) to green (+). Scale bar is 10 μM. (iii) Quantification of insoluble proteins associated with the STX and PG fractions of the liposomes. Differences were measured by Student t test; **p < 0.01, ***p < 0.001. Data are shown as mean ± SD of three independent experiments (n = 3).
Fig. 5
Fig. 5. Flotillin stabilizes unfolded PBP2a to prevent its aggregation.
A Thermal aggregation assay of PBP2a conducted at various temperatures. PBP2a shows a strong onset of insolubility at 42 °C. The addition of FloA or FloA-NfeD to the assay reduced PBP2a insolubility. As a control, adding NfeD alone did not reduce PBP2a insolubility. B PBP2a in vitro transpeptidase assay at different temperatures: LC-MS extracted ion chromatogram using purified PBP2a and Gly5-Lipid II with FloA and/or NfeD at 37 °C or 42 °C. The production of the crosslinked dimeric muropeptide at 42 °C only occurred in the presence of FloA or FloA-NfeD. C Cryo-EM map of the FloA-NfeD dimer bound to unfolded PBP2a. Flexible fitting of the AF2 Multimer prediction is shown in the bottom panels. The top panels show different views of the cryo-EM map, in which one FloA monomer is labeled in pink and the other FloA monomer in gray. The OBL of NfeD is labeled in blue. The PBP2a volume showed structurally undefined regions, as was in its unfolded state. As the tentacles of FloA-NfeD were extended laterally, they embraced the PBP2a volume, covering a large fraction of PBP2a. Right panels show different zoomed-in views (side and top views) of the EM density and the and the fitted AlphaFold2 atomic model for the FloA-NfeD dimer loaded with unfolded PBP2a. The proximal regions detected by DSS cross-linking are marked in red.
Fig. 6
Fig. 6. FMM disruption affects flotillin oligomerization and leads to the accumulation of misfolded proteins.
A (i) Quantification of insoluble proteins associated with the membrane fraction from WT (white), the ΔfloA mutant (black), the ΔfloA complemented strain that produces FloAWT (yellow), and a ΔfloA producing the FloAΔCC-LCR variant. Results were examined by one-way ANOVA with Tukey test for multiple comparisons; ***p < 0.001. Data are shown as mean ± SD of three independent experiments (n = 3). (ii) Quantification of β-lactam resistance as a proxy for PBP2a activity, measured as MRSA growth (CFU/ml) in the presence of oxacillin (6 μg/ml) in WT, ΔfloA, ΔfloA producing FloAWT, and ΔfloA producing FloAΔCC-LCR. Results were examined by one-way ANOVA with Tukey test for multiple comparisons; *p < 0.05. Data are shown as mean ± SD of three independent experiments (n = 3). B Phylogeny of multi-drug resistant isolates based on multi-locus sequence typing (ST). The classification shows three clonal complexes (CC): CC1, CC8 and CC5. C (i) Quantification of non-soluble proteins in the DRM and DSM fractions in cultures treated with H2O2, with or without zaragozic acid (ZA = 10 μM). In red is represented the benchmark clinical isolate USA300. (ii) Bacterial survival (CFU/mL) of H2O2-treated cultures in the presence or absence of ZA (10 μM). The lines connect non-treated and treated dots of the same strain. Data show the mean of three biological replicates. In red is represented the benchmark clinical isolate USA300. (iii–vi) Effect of MRSA resistance to oxacillin in the absence (iii) and presence (vi) of ZA (10 μM). In red is presented a benchmark control strain sensitive to oxacillin (Newman strain). D Immunodetection of soluble, functionally active PBP2a in the membrane extracts of ZA-treated and untreated cultures of clinical isolates (strains A to M) that are represented in C. E Glycerol gradient analysis of FloA oligomerization pattern in untreated (upper panel) or ZA-treated (bottom panel) cultures of a clinical isolate belonging to ST1 (Isolate L). F Bacterial load in lungs of oxacillin-treated infected mice in a pulmonary infection model. The left panel shows ST1-infected mice with or without oxacillin treatment. Oxacillin does not affect mice infection by ST1. The right panel shows ST1-infected mice treated with ZA alone or ZA and oxacillin. C is untreated infected mice. ZA treatment caused a reduction of bacterial load, which increased significantly in the presence of oxacillin. Mice were infected with 3 × 108 CFU (n = 10). One day after bacterial challenge, the lungs were collected and CFUs counted. Differences were analyzed by one-way ANOVA. Top and bottom of the box indicates the 75th and 25th percentile, respectively. Whiskers extend to 1.5 times the interquartile range from the box. *p < 0.05, **p < 0.01.

Similar articles

Cited by

References

    1. Singer SJ, Nicolson GL. The fluid mosaic model of the structure of cell membranes. Science. 1972;175:720–731. doi: 10.1126/science.175.4023.720. - DOI - PubMed
    1. Kraft ML. Plasma membrane organization and function: moving past lipid rafts. Mol. Biol. Cell. 2013;24:2765–2768. doi: 10.1091/mbc.e13-03-0165. - DOI - PMC - PubMed
    1. Lorent JH, Levental I. Structural determinants of protein partitioning into ordered membrane domains and lipid rafts. Chem. Phys. Lipids. 2015;192:23–32. doi: 10.1016/j.chemphyslip.2015.07.022. - DOI - PubMed
    1. Simons K, Ikonen E. Functional rafts in cell membranes. Nature. 1997;387:569–572. doi: 10.1038/42408. - DOI - PubMed
    1. Zhao F, Zhang J, Liu YS, Li L, He YL. Research advances on flotillins. Virol. J. 2011;8:479. doi: 10.1186/1743-422X-8-479. - DOI - PMC - PubMed

MeSH terms