. 2024 Jul 3;15(1):5602.
doi: 10.1038/s41467-024-49930-6.

KAT8-mediated H4K16ac is essential for sustaining trophoblast self-renewal and proliferation via regulating CDX2

Affiliations

KAT8-mediated H4K16ac is essential for sustaining trophoblast self-renewal and proliferation via regulating CDX2

Shilei Bi et al. Nat Commun. .

Abstract

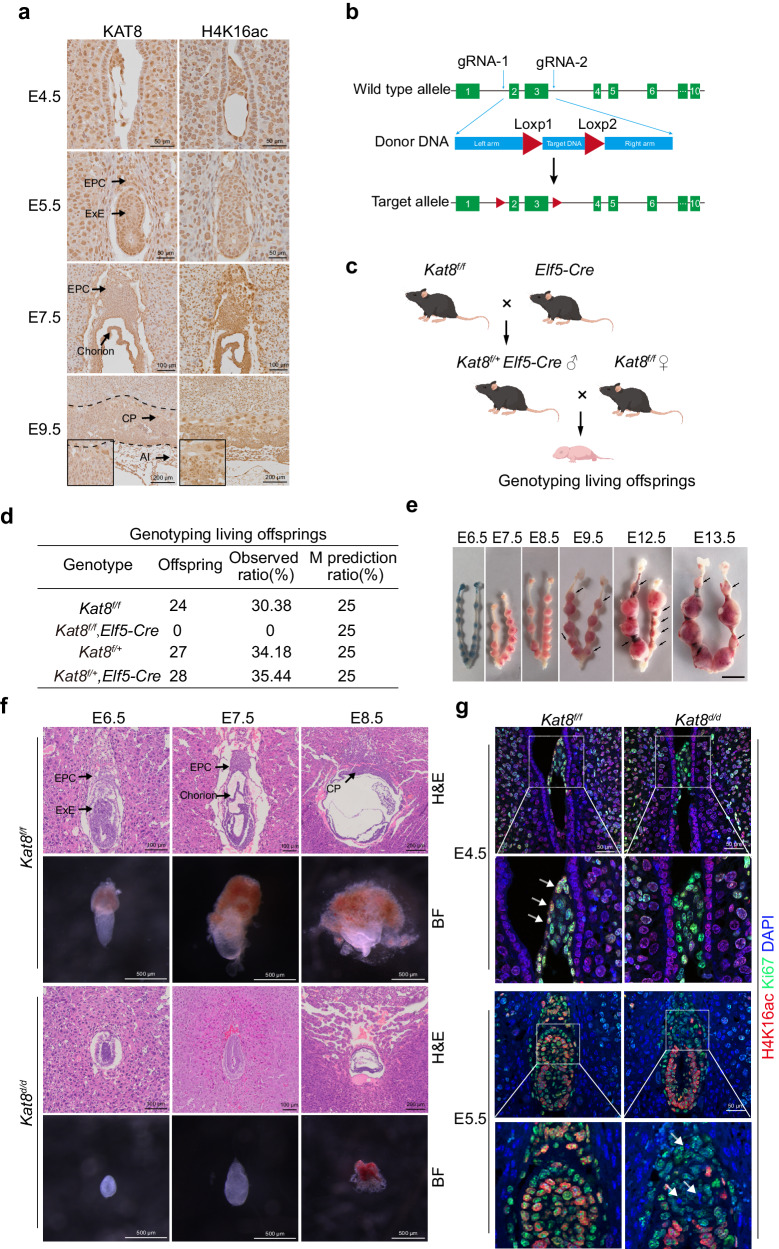
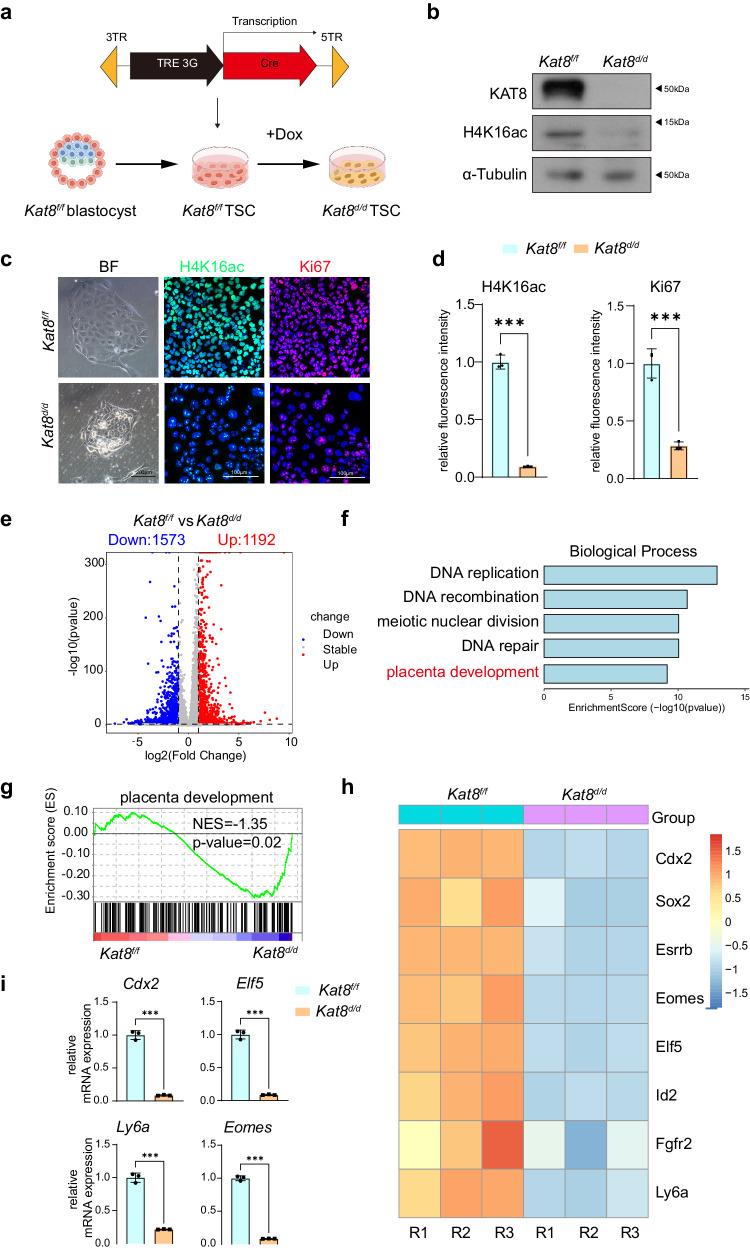
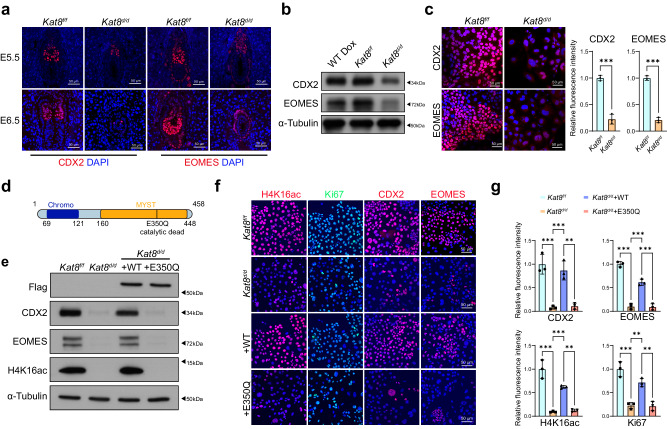
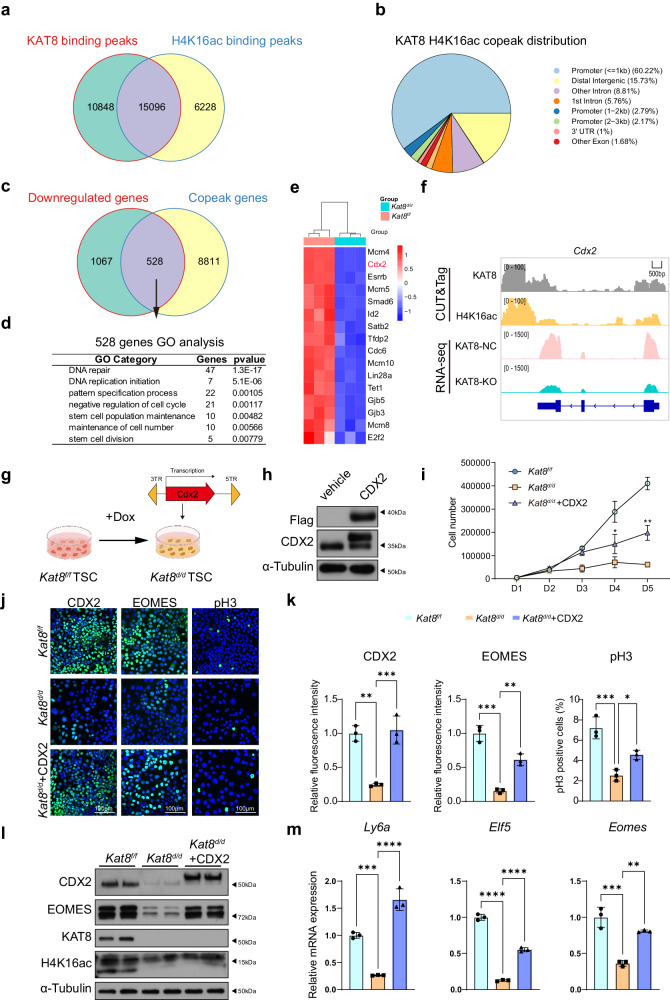
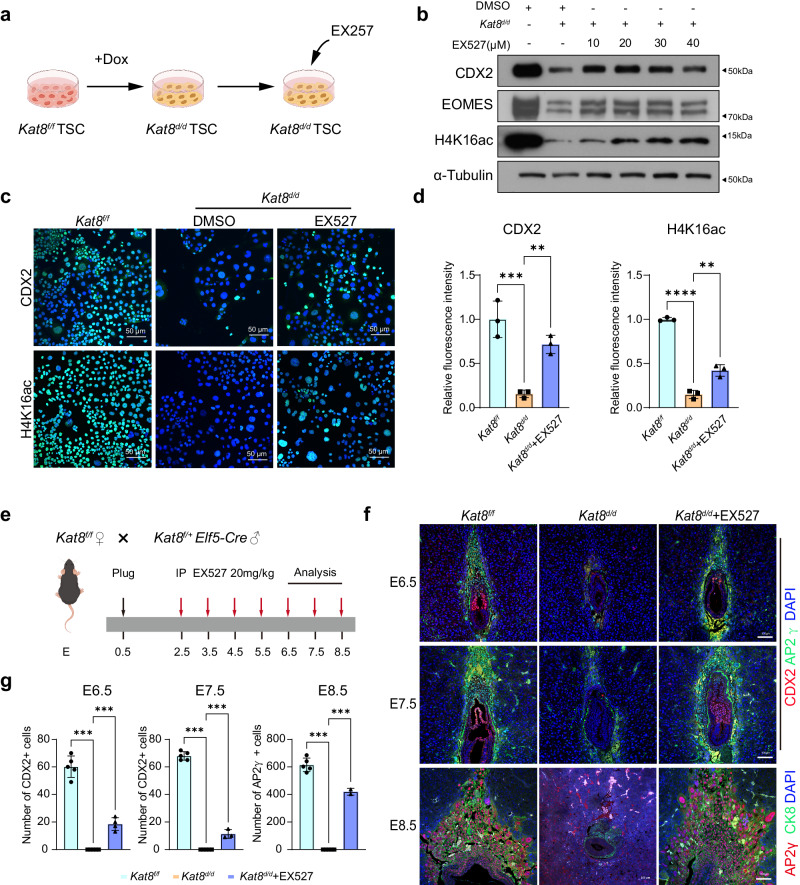
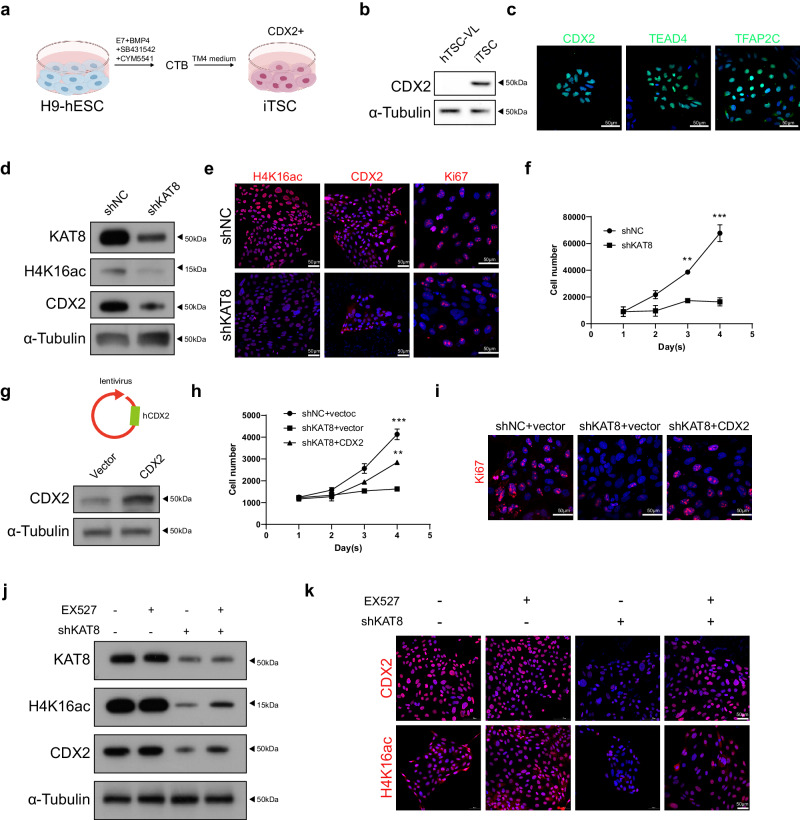
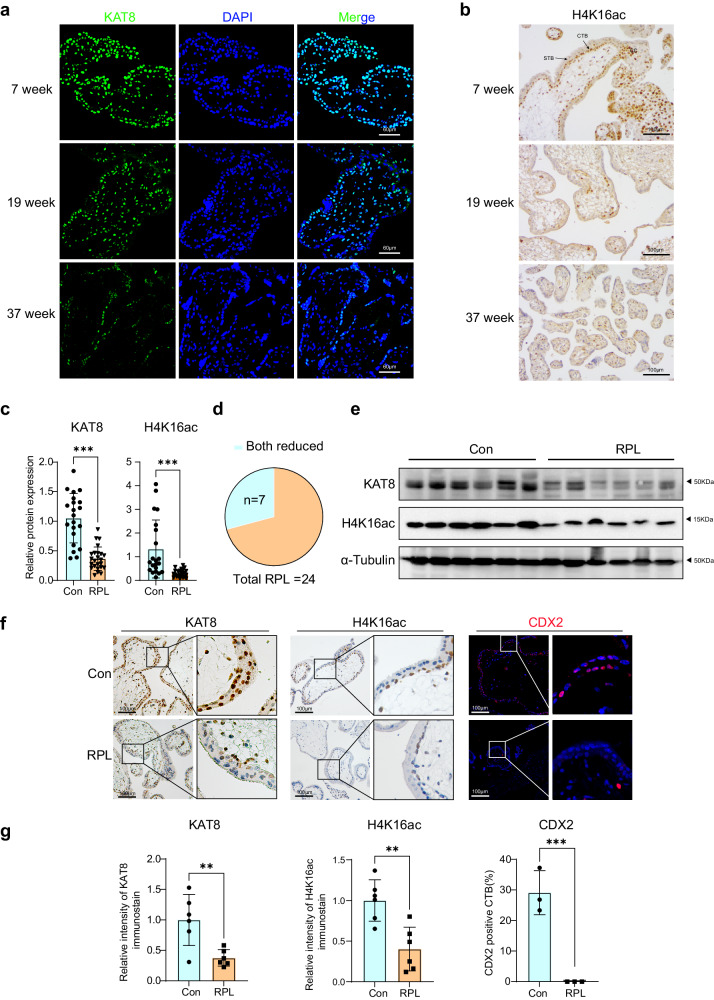
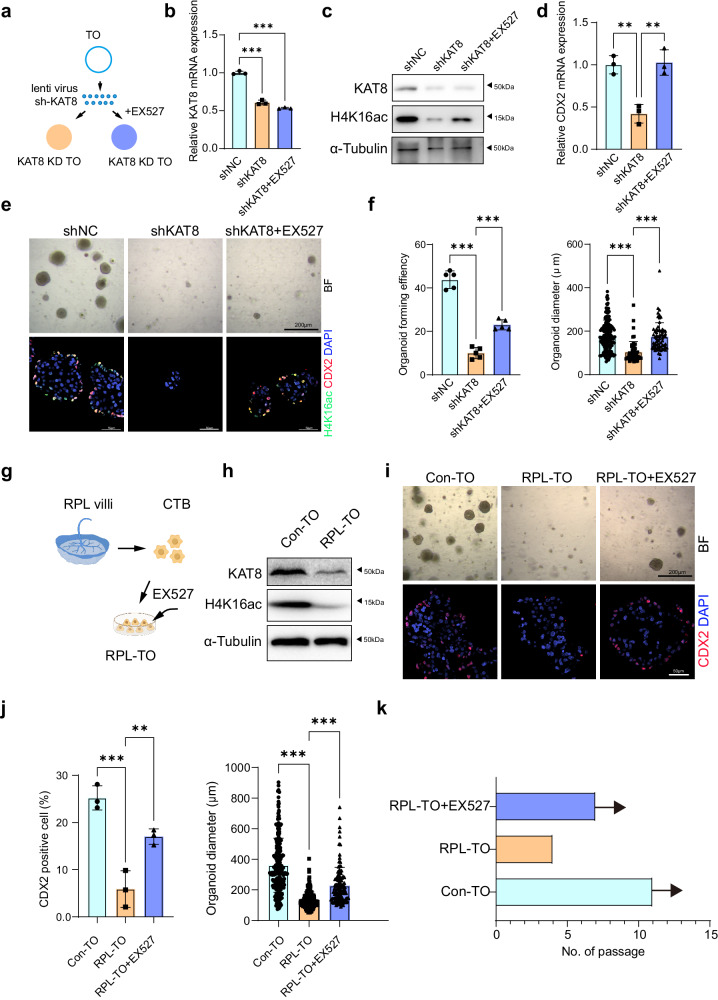
Abnormal trophoblast self-renewal and differentiation during early gestation is the major cause of miscarriage, yet the underlying regulatory mechanisms remain elusive. Here, we show that trophoblast specific deletion of Kat8, a MYST family histone acetyltransferase, leads to extraembryonic ectoderm abnormalities and embryonic lethality. Employing RNA-seq and CUT&Tag analyses on trophoblast stem cells (TSCs), we further discover that KAT8 regulates the transcriptional activation of the trophoblast stemness marker, CDX2, via acetylating H4K16. Remarkably, CDX2 overexpression partially rescues the defects arising from Kat8 knockout. Moreover, increasing H4K16ac via using deacetylase SIRT1 inhibitor, EX527, restores CDX2 levels and promoted placental development. Clinical analysis shows reduced KAT8, CDX2 and H4K16ac expression are associated with recurrent pregnancy loss (RPL). Trophoblast organoids derived from these patients exhibit impaired TSC self-renewal and growth, which are significantly ameliorated with EX527 treatment. These findings suggest the therapeutic potential of targeting the KAT8-H4K16ac-CDX2 axis for mitigating RPL, shedding light on early gestational abnormalities.


Conflict of interest statement

The authors declare no competing interests.

Figures

Fig. 1
Fig. 1. Specific knockout of KAT8 in trophoblast cells leads to abnormal placental development.
a Immunohistochemical staining for KAT8 and H4K16ac at indicated embryonic days during normal placental development. E0.5 was determined as the point at which a vaginal plug was identified. b Schematic of generating Kat8f/f transgenic mouse. c Schematic for generating mice with trophoblast-specific deletion of Kat8 (Kat8d/d). The graphic elements were created by figdraw. d Genotype analysis of the offspring from female Kat8f/f mice crossed with male Kat8f/+;Elf5-Cre mice. e Implantation sites in female Kat8f/f mice crossed with male Kat8f/+ Elf5-Cre mice at E6.5-E13.5. Scale bar: 5 mm. f H&E staining and brightfield pictures of implantation sites of Kat8f/f and Kat8d/d mice at E5.5–E8.5. g Immunofluorescent staining of H4K16ac and Ki67 in Kat8f/f and Kat8d/d embryos at E4.5-E5.5. Arrowheads pointing the missed H4K16ac and Ki67 staining in Kat8d/d ExE cells. ExE, extraembryonic ectoderm; EPC, ectoplacental cone; CP, chorionic plate. Al, Allantois.
Fig. 2
Fig. 2. Impaired trophoblast stemness and differentiation upon Kat8 deletion.
a Schematic showing generation of Kat8d/d mTSCs. The graphic elements were created by figdraw. b Immunoblot analysis of KAT8 and H4K16ac in mTSCs treated with or without Dox for 48 h (Kat8d/d and Kat8f/f). c Representative immunofluorescent staining and brightfield pictures of H4K16ac and Ki67 in Kat8d/d and Kat8f/f mTSCs. d The quantitative results of C. Data are representative of three independent experiments (n = 3) and the values are normalized to Kat8f/f control group. Two-tailed unpaired Student’s t-test. Error bars, mean ± SEM. H4K16ac, P < 0.0001. Ki67, P < 0.0001. Source data are provided as a Source Data file. e Volcano plot of differentially expressed genes (P < 0.05, Log2FC ≥ 1) in Kat8f/f and Kat8d/d mTSCs as determined by exact negative binomial test in edgeR package of R. f Gene Ontology analysis for Top 150 differentially downregulated genes by DAVID by Kappa Statistics (p < 0.05). g GSEA plot showing the enrichment of placenta development related genes in Kat8d/d compared with Kat8f/f mTSCs. NES normalized enrichment score. P = 0.02. h Heatmap of mTSCs stemness associated genes between Kat8f/f and Kat8d/d mTSCs. i Quantitative real-time PCR analysis of Cdx2, Elf5, Ly6a, and Eomes mRNA levels in Kat8f/f and Kat8d/d mTSCs. Data are representative of three independent experiments (n = 3) and the values are normalized to ACTB. Two-tailed unpaired Student’s t-test. Error bars, mean ± SEM. Cdx2, P < 0.0001. Elf5, P < 0.0001. Ly6a, P < 0.0001. Eomes, P < 0.0001. Source data are provided as a Source Data file.
Fig. 3
Fig. 3. KAT8 is required for CDX2 expression.
a Representative immunofluorescence staining of CDX2 and EOMES in Kat8f/f and Kat8d/d embryos at E5.5 and E6.5. b Immunoblot analysis of CDX2 and EOMES in Kat8f/f and Kat8d/d mTSCs. c Left panel: Immunofluorescent staining of CDX2 and EOMES in Kat8f/f and Kat8d/d mTSCs. Right panel: the relative fluorescence intensity of CDX2+ or EOMES+ signals in Kat8d/d compared to Kat8f/f mTSCs. Data are representative of three independent experiments (n = 3) and the values are normalized to Kat8f/f control group. Two-tailed unpaired Student’s t-test. Error bars, mean ± SEM. P = 0.0002 (CDX2, between Kat8f/f and Kat8d/d), P < 0.0001 (EOMES, between Kat8f/f and Kat8d/d). Source data are provided as a Source Data file. d Schematic representation of the protein structure of wild-type KAT8 or catalytic dead (E350Q) KAT8. e Immunoblot analysis of Flag, CDX2, EOMES and H4K16ac in Kat8f/f, Kat8d/d and Kat8d/d transduced with 3xFLAG-WTKAT8 or 3xFLAG-E350QKAT8. f Immunofluorescent staining of CDX2, EOMES, Ki67 and H4K16ac in Kat8f/f, Kat8d/d and Kat8d/d transduced with 3xFLAG-WTKAT8 or 3xFLAG-E350QKAT8. g The quantitative results of F. Data in C and G are representative of at least three independent experiments (n = 3) and values are normalized to Kat8f/f group and expressed in mean ± SEM. Two-tailed unpaired Student’s t-test, **P < 0.01, ***P < 0.001. Source data are provided as a Source Data file.
Fig. 4
Fig. 4. CDX2 is a target gene of KAT8-mediated H4K16ac.
a Venn diagram showing the overlap between KAT8 binding peaks (n = 25,944) and H4K16ac binding peaks (n = 21,324). b Genomic distribution of KAT8 and H4K16ac copeaks in mTSCs. c Venn diagram showing the overlap between genes with KAT8 and H4K16ac copeaks (n = 9339) and genes downregulated upon KAT8 loss (n = 1595). d Gene Ontology analysis for KAT8 and H4K16ac target genes (n = 528) by DAVID by Kappa Statistics (p < 0.05). e Heatmap of genes associated with stemness and proliferation that are the target genes of KAT8 and H4K16ac. f Genome browser view of CUT&Tag-seq signals and RNA-seq tracks for KAT8 and H4K16ac target gene Cdx2 in mTSCs. g Schematic of overexpressing CDX2 in Kat8d/d mTSCs. The graphic elements were created by figdraw. h Immunoblot analysis of Flag and CDX2 in Kat8f/f and Kat8f/f transduced with 3xFLAG-CDX2 mTSCs. i Cell counts of Kat8f/f, Kat8d/d and Kat8d/d + CDX2 mTSCs collected on indicated days. Data are representative of three independent experiments (n = 3). Two-tailed unpaired Student’s t-test. Error bars, mean ± SEM. P = 0.0463 (for D4, between Kat8d/d and Kat8d/d + CDX2), P = 0.0021 (for D5, between Kat8d/d and Kat8d/d + CDX2). Source data are provided as a Source Data file. j Immunofluorescent staining of CDX2, EOMES, pH3 in Kat8f/f, Kat8d/d and Kat8d/d + CDX2 mTSCs. k Right panel: the relative fluorescence intensity of CDX2+ or EOMES+ signals in indicated groups, Data are representative of three independent experiments (n = 3) and the values are normalized to Kat8f/f control group. Two-tailed unpaired Student’s t-test. Error bars, mean ± SEM. P = 0.003 (between Kat8f/f and Kat8d/d), P = 0.0026 (between Kat8d/d and Kat8d/d + CDX2). Left panel: the percentage of pH3+ cell numbers in mTSCs of indicated genotypes; average cell numbers from five 20X fields were determined. Data are representative of three independent experiments (n = 3) and the values are normalized to Kat8f/f control group. Two-tailed unpaired Student’s t-test. Error bars, mean ± SEM. P = 0.009 (between Kat8f/f and Kat8d/d), P = 0.0176 (between Kat8d/d and Kat8d/d + CDX2). Source data are provided as a Source Data file. l Immunoblot analysis of CDX2, EOMES, KAT8 and H4K16ac in Kat8f/f, Kat8d/d and Kat8d/d + CDX2 mTSCs. m Quantitative real-time PCR analysis of Elf5, Ly6a, and Eomes mRNA levels in Kat8f/f, Kat8d/d and Kat8d/d + CDX2 mTSCs. Data are representative of three independent experiments (n = 3) and the values are normalized to ACTB and indicated as the mean ± SEM. Two-tailed unpaired Student’s t-test, *P < 0.05, **P < 0.01, ***P < 0.001. Source data are provided as a Source Data file.
Fig. 5
Fig. 5. EX527 partially rescue abnormal placental development caused by KAT8 knockout both in vitro and in vivo.
a Schematic representation illustrating the process of adding EX527 in Kat8d/d mTSCs. The graphic elements were created by figdraw. b Immunoblot analysis of CDX2, EOMES and H4K16ac in Kat8d/d mTSCs with or without EX527. c Immunofluorescent staining of CDX2 and H4K16ac in Kat8d/d mTSCs with or without EX527. d The quantitative results of C. Data are representative of three independent experiments (n = 3) and values are normalized to Kat8f/f control group and expressed in mean ± SEM. **P < 0.01, ***P < 0.001. Source data are provided as a Source Data file. e Schematic representation depicting the application of EX527 treatment on Kat8d/d embryos. The graphic elements were created by figdraw. f Immunofluorescent staining of CDX2, AP2γ and CK8 in Kat8f/f, Kat8d/d and EX527 treated Kat8d/d embryos. g Quantification of CDX2+ cells or AP2γ+ cells in implantation sites of the indicated genotypes. Each dot in the column represents one implantation site (E6.5, n = 6 for Kat8f/f, n = 6 for Kat8d/d, n = 6 for Kat8f/f + EX527; E7.5, n = 6 for Kat8f/f, n = 6 for Kat8d/d, n = 6 for Kat8f/f + EX527; E8.5, n = 6 for Kat8f/f, n = 6 for Kat8d/d, n = 2 for Kat8f/f + EX527). Two-tailed unpaired Student’s t-test. Error bars, mean ± SEM. *P < 0.05, **P < 0.01, ***P < 0.001. (n = 3 mice for Kat8f/f, n = 3 mice for Kat8d/d, n = 3 mice for Kat8f/f + EX527). Source data are provided as a Source Data file.
Fig. 6
Fig. 6. KAT8-H4K16ac-CDX2 is conserved in human trophoblast cell.
a Schematic representation illustrating the process of establishing iTSC. The graphic elements were created by figdraw. b Immunoblot analysis of CDX2 in hTSC from placenta villi and iTSC. c Immunofluorescent staining of CDX2, TEAD4, TFAP2C in iTSC. d Immunoblot analysis of KAT8, H4K16ac and CDX2 in iTSC and KAT8 knockdown iTSC. e Immunofluorescent staining of H4K16ac, CDX2, Ki67 in iTSC and KAT8 knockdown iTSC. f Cell counts of iTSC and KAT8 knockdown iTSC collected on indicated days. Data are representative of three independent experiments (n = 3). Two-tailed unpaired Student’s t-test. Error bars, mean ± SEM. P = 0.005 (for D3), P = 0.0025 (for D4). Source data are provided as a Source Data file. g Immunoblot analysis of CDX2 in iTSC and CDX2 overexpression iTSC. h Cell counts of iTSC and CDX2 overexpression iTSC collected on indicated days. Data are representative of three independent experiments (n = 3). Two-tailed unpaired Student’s t-test. Error bars, mean ± SEM. P = 0.001 (for D4, between shNC and shKAT8), P = 0.0025 (for D4, between shNC and shKAT8 + CDX2). Source data are provided as a Source Data file. i Immunoblot analysis of Ki67 in iTSC, KAT8 knockdown iTSC and CDX2 overexpression iTSC. Data are representative of three independent experiments. j Immunoblot analysis of KAT8, CDX2, and H4K16ac in KAT8 knockdown iTSC with or without EX527. k Immunofluorescent staining of CDX2 and H4K16ac in KAT8 knockdown iTSC with or without EX527.
Fig. 7
Fig. 7. The expression of KAT8 and H4K16ac in placenta villous of normal pregnancies and RPL patients.
a Immunofluorescent staining of KAT8 in the placental villous tissues from normal pregnancies. b Immunohistochemical analysis of H4K16ac in the placental villous tissues from normal pregnancies. c The quantitative results of immunoblots of KAT8 and H4K16ac in the villi from normal (n = 28) and RPL (n = 24) pregnancies. α-Tubulin were used as loading controls and data are normalized to normal groups. Two-tailed unpaired Student’s t-test. Error bars, mean ± SEM. P < 0.0001 (for KAT8), P < 0.0001 (for H4K16ac). Source data are provided as a Source Data file. d Statistical analysis of RPL cases (n = 24) exhibiting concurrent downregulation of KAT8 and H4K16ac (n = 7), as depicted in immunoblot images of villous tissues obtained from normal and RPL placentas. e Representative immunoblot images of KAT8 and H4K16ac in the villi from normal (n = 6) and RPL (n = 6) placentas. f Representative staining for KAT8 (IHC), H4K16ac (IHC) and CDX2 (IF) in the villi from normal and RPL placentas. g Quantification of KAT8+ cells, H4K16ac+ and CDX2+ cells in placenta villi from normal and RPL patients. Values are normalized to normal groups and expressed in mean ± SEM. Two-tailed unpaired Student’s t-test, *P < 0.05, **P < 0.01, ***P < 0.001. (n = 6 for KAT8, n = 6 for H4K16ac, n = 3 for CDX2). Source data are provided as a Source Data file.
Fig. 8
Fig. 8. EX527 treatment effectively enhance the stemness and proliferation capability of hTOs derived from RPL patients.
a Schematic representation illustrating the application of EX527 treatment on human trophoblast organoids (hTOs) following knockdown of KAT8 (KAT8-KD) using lentiviral vectors. b Quantitative real-time PCR analysis of KAT8 mRNA in KAT8-KD hTOs with or without EX527. The values are normalized to ACTB. Data are representative of five independent experiments (n = 3). Two-tailed unpaired Student’s t-test. Error bars, mean ± SEM. P < 0.0001 (between shNC and shKAT8), P < 0.0001 (between shNC and shKAT8 + EX527). Source data are provided as a Source Data file. c Immunoblot analysis of KAT8 and H4K16ac in KAT8-KD hTOs with or without EX527. d Quantitative real-time PCR analysis of CDX2 mRNA in KAT8-KD hTOs with or without EX527. The values are normalized to ACTB. Data are representative of three independent experiments (n = 3). Two-tailed unpaired Student’s t-test. Error bars, mean ± SEM. P = 0.0029 (between shNC and shKAT8), P = 0.005 (between shKAT8 and shKAT8 + EX527). Source data are provided as a Source Data file. e Brightfield images and IF images of CDX2 and H4K16ac in KAT8-KD hTOs with or without EX527. f The quantification results of organoid forming efficiency and diameter for hTOs in indicated groups. For organoid forming efficiency, data are representative of five independent experiments (n = 5). Two-tailed unpaired Student’s t-test. Error bars, mean ± SEM. P < 0.001 (between shNC and shKAT8), P < 0.001 (between shKAT8 and shKAT8 + EX527). For diameter, each dot in the column represents one TO (n = 155, shNC; n = 56, shKAT8; n = 65, shKAT8 + EX527). Two-tailed unpaired Student’s t-test. Error bars, mean ± SEM. P < 0.001 (between shNC and shKAT8), P < 0.001 (between shKAT8 and shKAT8 + EX527). Source data are provided as a Source Data file. g Schematic illustrating the collection of RPL placental tissue, generation of RPL-derived trophoblast organoids (RPL-TOs), and continuous treatment with EX527, n = 3. The graphic elements were created by figdraw. h Immunoblot analysis of KAT8 and H4K16ac in the villi from normal and RPL pregnancies. i Brightfield images and immunofluorescent staining of CDX2 in RPL-TOs with or without EX527. j The quantification results of CDX2+ cells and diameter for RPL-TOs with or without EX527. For CDX2+ cells, data are representative of three independent experiments (n = 3). Two-tailed unpaired Student’s t-test. Error bars, mean ± SEM. P = 0.002 (between Con-TOs and RPL-TOs), P = 0.0101 (between RPL-TOs and RPL-TOs + EX527). For diameter, each dot in the column represents one TO (n = 249, Con-TOs; n = 208, RPL-TOs; n = 117, RPL-TOs + EX527). Two-tailed unpaired Student’s t-test. Error bars, mean ± SEM. P < 0.001 (between Con-TOs and RPL-TOs), P < 0.001 (between RPL-TOs and RPL-TOs + EX527). Source data are provided as a Source Data file. k Analysis of the passage number for RPL-TOs with or without EX527 treatment.

Similar articles

Cited by

References

    1. Maltepe E, Fisher SJ. Placenta: the forgotten organ. Annu. Rev. cell Dev. Biol. 2015;31:523–552. doi: 10.1146/annurev-cellbio-100814-125620. - DOI - PubMed
    1. Knöfler M, et al. Human placenta and trophoblast development: key molecular mechanisms and model systems. Cell. Mol. Life Sci: CMLS. 2019;76:3479–3496. doi: 10.1007/s00018-019-03104-6. - DOI - PMC - PubMed
    1. Cuffe, J. S., Holland, O., Salomon, C., Rice, G. E. & Perkins, A. V. J. P. Placental derived biomarkers of pregnancy disorders. Placenta54, 104–110 (2017). - PubMed
    1. Norwitz ER. Defective implantation and placentation: laying the blueprint for pregnancy complications. Reprod. Biomed. Online. 2006;13:591–599. doi: 10.1016/S1472-6483(10)60649-9. - DOI - PubMed
    1. Steegers EA, von Dadelszen P, Duvekot JJ, Pijnenborg R. Pre-eclampsia. Lancet (London, England) 2010;376:631–644. doi: 10.1016/S0140-6736(10)60279-6. - DOI - PubMed

LinkOut - more resources