. 2024 Jul 3;14(1):15339.
doi: 10.1038/s41598-024-66058-1.

Mesoscale characterization of osseointegration around an additively manufactured genistein-coated implant

Affiliations

Mesoscale characterization of osseointegration around an additively manufactured genistein-coated implant

Chiara Micheletti et al. Sci Rep. .

Abstract

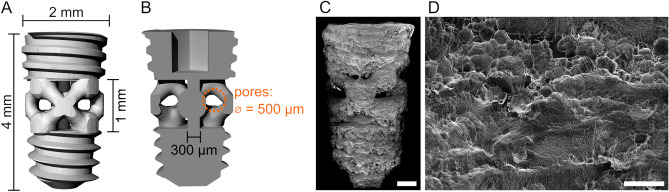
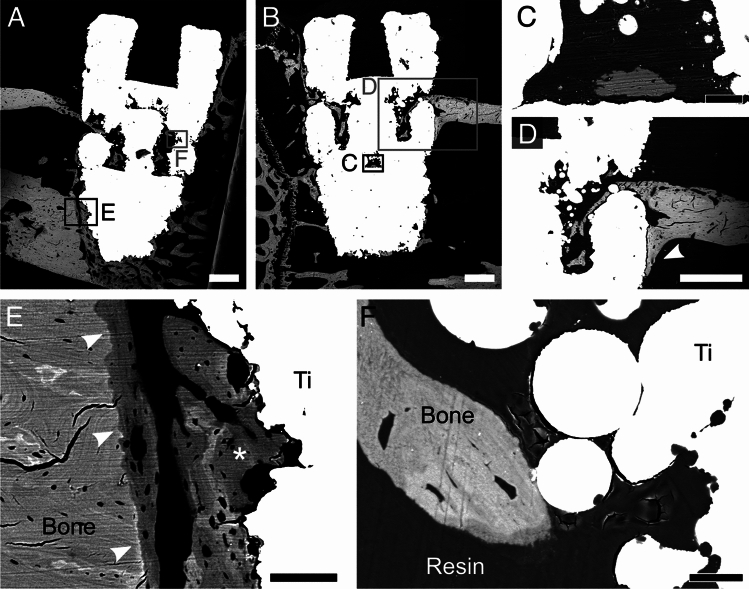
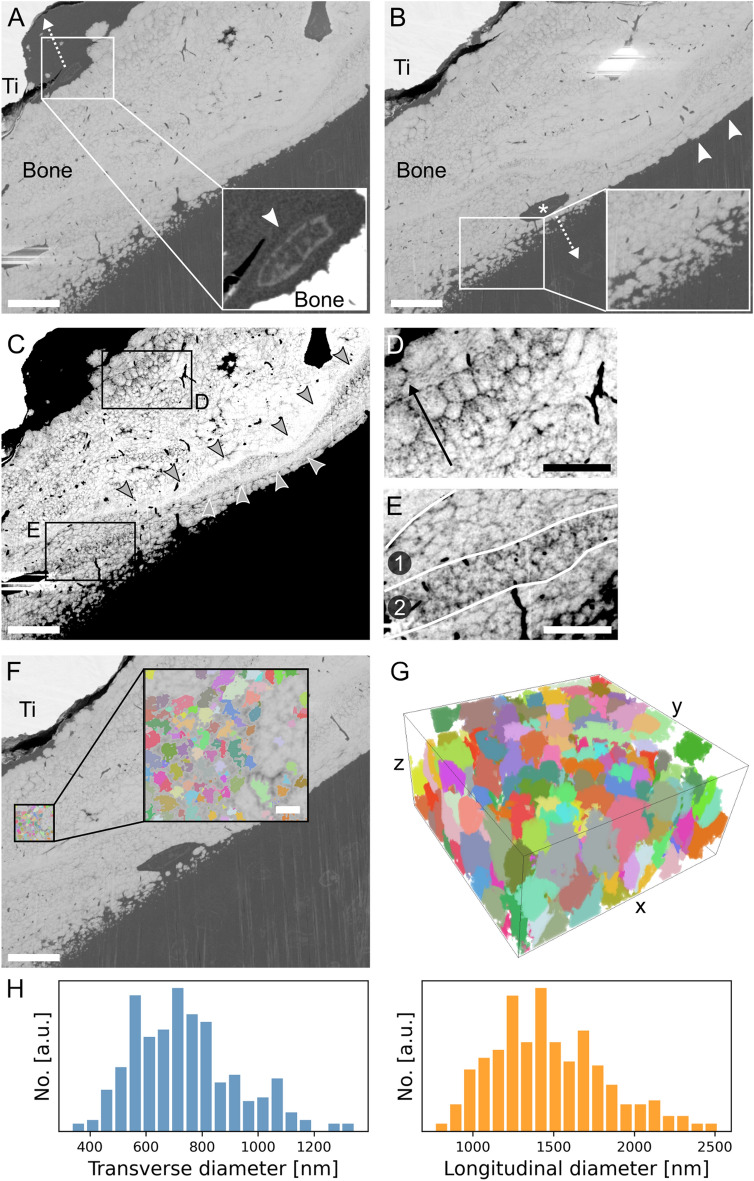
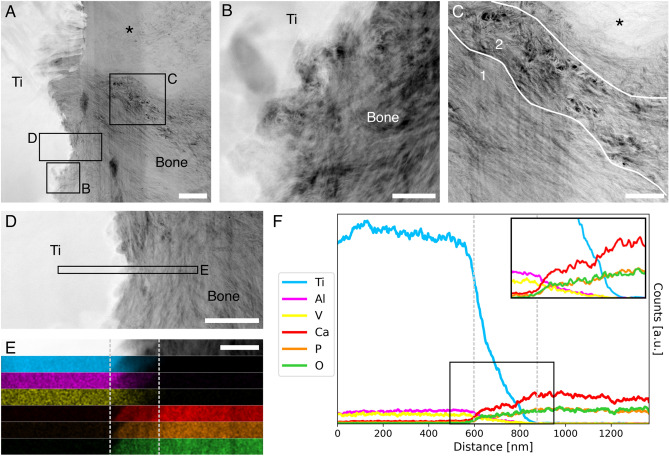
Given the hierarchical nature of bone and bone interfaces, osseointegration, namely the formation of a direct bone-implant contact, is best evaluated using a multiscale approach. However, a trade-off exists between field of view and spatial resolution, making it challenging to image large volumes with high resolution. In this study, we combine established electron microscopy techniques to probe bone-implant interfaces at the microscale and nanoscale with plasma focused ion beam-scanning electron microscopy (PFIB-SEM) tomography to evaluate osseointegration at the mesoscale. This characterization workflow is demonstrated for bone response to an additively manufactured Ti-6Al-4V implant which combines engineered porosity to facilitate bone ingrowth and surface functionalization via genistein, a phytoestrogen, to counteract bone loss in osteoporosis. SEM demonstrated new bone formation at the implant site, including in the internal implant pores. At the nanoscale, scanning transmission electron microscopy and energy-dispersive X-ray spectroscopy confirmed the gradual nature of the bone-implant interface. By leveraging mesoscale analysis with PFIB-SEM tomography that captures large volumes of bone-implant interface with nearly nanoscale resolution, the presence of mineral ellipsoids varying in size and orientation was revealed. In addition, a well-developed lacuno-canalicular network and mineralization fronts directed both towards the implant and away from it were highlighted.

Keywords: LCN; Mineral ellipsoid; Osseointegration; PFIB-SEM tomography; Resin cast etching; Scanning transmission electron microscopy.


Conflict of interest statement

The authors declare no competing interests.

Figures

Figure 1
Figure 1
Implant design and final surface topography. (A) 3D rendering of the implant design. (B) Longitudinal cross-section of the implant. The main dimensions of the implant and pores are reported in A and B. (C) Overview SEM image (secondary electron mode) of the implant after acid etching. (D) Higher magnification SEM image of the implant surface topography after acid etching. Scale bars are 500 µm in C and 50 µm in D.
Figure 2
Figure 2
Schematic (not to scale) of the multimodal and multiscale characterization workflow of the bone-implant interface and the LCN. The blue border around the porous implant represents the genistein coating. The LCN was examined in 2D by SEM imaging after resin cast etching and in 3D by PFIB-SEM tomography. PFIB-SEM tomography was also used to image the bone-implant interface. Nanoscale resolution was achieved by HAADF-STEM imaging of an electron transparent lamella prepared by the FIB in situ lift-out technique.
Figure 3
Figure 3
BSE-SEM images of the peri-implant space and the bone-implant interface. (A-B) BSE-SEM mosaic images of two genistein-coated Ti-6Al-4V porous implants and their peri-implant space 28 days after implant placement. (C) Magnified image of bone within the porous space. (D) New bone growing from the native upper cortex down towards the implant (marked by arrowhead). (E) New bone growing from pre-existing cortical bone in the lower cortex (marked by arrowheads) and from the implant surface (label “Ti”) (marked by the asterisk), indicating distance and contact osteogenesis, respectively. A difference in greyscale level can be noted between old (lighter) and new (darker) bone. (F) Bone formed within the porous space in close association with microparticles from L-PBF. Scale bars are 500 µm in A, B, and D, 50 µm in C, 100 µm in E, and 20 µm in F.
Figure 4
Figure 4
LCN at the bone-implant interface. (A) SEM image (secondary electron mode) of a sample after resin cast etching, where cells (marked by arrowheads) and their processes are visible in bone juxtaposed to the Ti-6Al-4V implant (indicated by the label “Ti”). (B-C) Visualization of the PFIB-SEM tomogram with (B) and without (C) bone (light grey), where implant and LCN are coloured in blue and pink, respectively (resin not shown in the rendering, but available in Fig. S1-B). (D-E) Sequence of slices in the PFIB-SEM dataset showing a cell becoming entrapped within the mineralizing bone matrix (magnified in insets). While in D part of the lacuna cannot be clearly distinguished from the resin, the same lacuna is fully surrounded by bone matrix in E. The image planes in D and E are approximately 5.8 µm away from each other in the image stack. (F) Some brighter features, possibly corresponding to membrane-bound intracellular organelles, can be noted in the resin, especially in the bottom right corner (contrast-enhanced in the inset). Scale bars are 10 µm.
Figure 5
Figure 5
Mineral ellipsoids in newly formed bone. (A) A high-contrasting feature in the resin region between bone and implant (“Ti” label) marked by the arrowhead in the inset (brightness/contrast-enhanced). If this feature corresponds to a cell (presumably an osteoblastic osteocyte), this suggests that bone is growing towards the implant, as indicated by the dashed arrow. (B) A cell (presumably an osteoblastic osteocyte, marked by *) becoming entrapped by mineralizing bone matrix and the presence of mineral foci (enlarged in the inset) suggest that in this area bone is growing away from the implant, in the direction of the dashed arrow. Away from the cell but along the same bone surface, mineral foci are absent, and the surface appears smoother (arrowheads). (C) Contrast/brightness-enhanced version of image A to better visualize the mineral ellipsoids. (D) Magnified image showing the size variation of the ellipsoids (becoming larger in the direction of the arrow). (E) Magnified image exemplifying an abrupt variation in orientation of the ellipsoids from region 1, where they are predominantly cross-sectioned longitudinally (elliptical motif), to region 2, where they are predominantly cross-sectioned transversally (rosette). Arrowheads indicate two highly-mineralized bands, where no ellipsoids can be distinguished. (F) Region where mineral ellipsoids were segmented by the Watershed algorithm, magnified in the inset where they appear as “rosettes” (transverse cross-sections). (G) 3D rendering of the segmented mineral ellipsoids, where their rosette and ellipsoidal shapes are visible in the transverse (xy) and longitudinal (yz, xz) planes, respectively. (H) Distribution of transverse (left, blue) and longitudinal (right, orange) diameters of the mineral ellipsoids (y axis corresponds to the number of ellipsoids). Scale bars are 10 µm in A, B, C, and F, 5 µm in D and E, and 5 µm in the inset in F. The box in G is 7.5 × 7.0 × 3.5 µm3.
Figure 6
Figure 6
Bone-implant interface at the nanoscale. (A) HAADF-STEM overview image of the lamella of a bone-implant region of interest (ROI) prepared by FIB in situ lift-out. (B) Magnified image of an area of bone-implant contact occurring at the nanoscale, demonstrating nano-osseointegration. (C) Collagen fibrils change orientation abruptly from in-plane (region 1) to out-of-plane (region 2). The asterisk in the top region in A and C marks a brighter region, likely due to the higher thickness of the lamella in that area. (D) HAADF-STEM image of the bone-implant interface to provide a lower-magnification overview of the area where EDX acquisition was completed (marked by the rectangle). (E) From top to bottom, HAADF-STEM image of the area where EDX maps were acquired, and EDX maps of titanium (blue), aluminum (magenta), vanadium (yellow), calcium (red), phosphorous (orange), and oxygen (green). The interfacial area is marked by the grey dotted lines, and measures approximately 250 nm in width. (F) Elemental variation along a line directed from the implant towards bone (over the entire area of the maps in E), magnified in the inset. The grey dotted lines indicate the same interfacial zone marked on the maps in E. Scale bars are 1 µm in A, 200 nm in B and E, and 500 nm in C and D.

Similar articles

Cited by

References

    1. Shah FA, Thomsen P, Palmquist A, et al. Osseointegration and current interpretations of the bone-implant interface. Acta Biomater. 2019;84:1–15. doi: 10.1016/j.actbio.2018.11.018. - DOI - PubMed
    1. Albrektsson T, Brånemark P-I, Hansson H-A, Lindström J, et al. Osseointegrated titanium implants: requirements for ensuring a long-lasting, direct bone-to-implant anchorage in man. Acta Orthop. Scand. 1981;52:155–170. doi: 10.3109/17453678108991776. - DOI - PubMed
    1. Engqvist H, Botton GA, Couillard M, Mohammadi S, Malmström J, Emanuelsson L, et al. A novel tool for high-resolution transmission electron microscopy of intact interfaces between bone and metallic implants. J. Biomed. Mater. Res. A. 2006;78A:20–24. doi: 10.1002/jbm.a.30696. - DOI - PubMed
    1. Palmquist A, Grandfield K, Norlindh B, Mattsson T, Brånemark R, Thomsen P. Bone-titanium oxide interface in humans revealed by transmission electron microscopy and electron tomography. J. R. Soc. Interface. 2012;9:396–400. doi: 10.1098/rsif.2011.0420. - DOI - PMC - PubMed
    1. Grandfield K, Gustafsson S, Palmquist A, et al. Where bone meets implant: the characterization of nano-osseointegration. Nanoscale. 2013;5:4302–4308. doi: 10.1039/c3nr00826f. - DOI - PubMed