. 2024 Jul 3;14(1):15313.
doi: 10.1038/s41598-024-66117-7.

Integrative network analysis of miRNA-mRNA expression profiles during epileptogenesis in rats reveals therapeutic targets after emergence of first spontaneous seizure

Affiliations

Integrative network analysis of miRNA-mRNA expression profiles during epileptogenesis in rats reveals therapeutic targets after emergence of first spontaneous seizure

Niraj Khemka et al. Sci Rep. .

Abstract

Epileptogenesis is the process by which a normal brain becomes hyperexcitable and capable of generating spontaneous recurrent seizures. The extensive dysregulation of gene expression associated with epileptogenesis is shaped, in part, by microRNAs (miRNAs) - short, non-coding RNAs that negatively regulate protein levels. Functional miRNA-mediated regulation can, however, be difficult to elucidate due to the complexity of miRNA-mRNA interactions. Here, we integrated miRNA and mRNA expression profiles sampled over multiple time-points during and after epileptogenesis in rats, and applied bi-clustering and Bayesian modelling to construct temporal miRNA-mRNA-mRNA interaction networks. Network analysis and enrichment of network inference with sequence- and human disease-specific information identified key regulatory miRNAs with the strongest influence on the mRNA landscape, and miRNA-mRNA interactions closely associated with epileptogenesis and subsequent epilepsy. Our findings underscore the complexity of miRNA-mRNA regulation, can be used to prioritise miRNA targets in specific systems, and offer insights into key regulatory processes in epileptogenesis with therapeutic potential for further investigation.

Keywords: Bayesian modelling; Epilepsy; Epileptogensis; Temporal expression profiling; miRNA-mRNA interactions; microRNA.


Conflict of interest statement

The authors declare no competing interests.

Figures
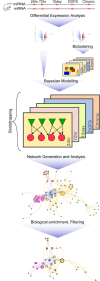
Figure 1
Figure 1
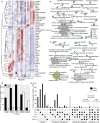
Workflow of Bayesian model development and network analysis. miRNA and mRNA expression profiles from hippocampal tissue of rats exposed to perforant path stimulation (PPS) were obtained at 5 time-points (n = 3 animals from 24 h, 72 h and 10 days following PPS, within 24 h after the first spontaneous seizure [day of first seizure—DOFS], and 1 month following emergence of spontaneous seizures [Chronic]). Differentially expressed miRNAs and mRNAs (following SAMBA bi-clustering to subset the most relevant mRNAs) were integrated to construct a Bayesian network for each time-point, and analysis was performed across all networks. Finally, network inference was enriched with biological data to filter the networks and identify critical miRNAs and their mRNA targets.
Figure 2
Figure 2
Temporal mRNA and miRNA dysregulation in the rat PPS model of epilepsy. (a) Expression of the 15 most significantly dysregulated mRNAs from each time-point. DOFS; day of first seizure. All dysregulated mRNAs are listed in Supp. Table 1a and visualized in Supp. Fig. 1. (b.c), Gene ontology enrichment analysis (biological processes, BPs) of (b) all differentially expressed, and (c) SAMBA-bi-clustered mRNAs at each time-point. The 10 most significantly enriched BPs (adjusted p < 0.05) from each time-point are shown. Similar BPs are grouped together, and some terms have been removed for clarity. Nodes are coloured according to the time-points at which they were significantly enriched, and node size indicates the number of dysregulated genes associated with each BP. (d) Number of differentially expressed (DE) miRNAs and bi-clustered mRNAs at each time-point. (e) Upset plot showing common and unique DE miRNAs and bi-clustered mRNAs at each time-point.
Figure 3
Figure 3
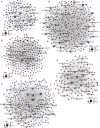
miRNA-mRNA-mRNA Bayesian directed networks for each time-point: (a) 24 h, (b) 72 h, (c) 10 day, (d) day of first seizure, DOFS, (e) Chronic. Dysregulated miRNAs or mRNAs are represented by circles (nodes), and nodes with an inferred interaction are connected by edges. Node size indicates the degree of connectivity of the node within each network, and node colour indicates betweenness centrality (b.c). The top 20% of nodes for each network statistic are labelled. All network interactions are listed in Supp. Table 3.
Figure 4
Figure 4
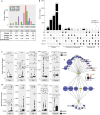
Network properties for each time-point. (a) Number of edges (interactions) per time-point, split by interaction type. The table shows the total number of nodes and edges. β-index (connectivity measure) = #edges/#nodes. (b) Upset plot showing the number of common and unique interactions at each time-point. The y-axis is cut for clarity. (c) Connectivity degree (incoming + outgoing edges) of miRNAs and mRNAs per time-point (d) Betweenness centrality of miRNAs and mRNAs per time-point. (e) Tspan2 and Irf8 connections at the 10d time-point. Target nodes are indicated with arrowheads (arrowheads were removed from Irf8 and Tspan2 for clarity). b.c betweenness centrality.
Figure 5
Figure 5
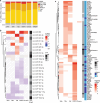
Analysis of the network-inferred miRNA-mRNA interactions. (a) Proportion of inferred miRNA-mRNA interactions that are computationally predicted (miRDIP) at various confidence classes. NA indicates network interactions not present in the miRDIP database. (b) The degree (number of mRNA targets) of 23 short-listed miRNAs with inferred miRNA-mRNA interactions at > 1 time-point (num. timept). The degree is z-score normalised along time-points – the miRNA with most mRNA targets at each time-point is dark red. Hatched fill indicates that the miRNA had no inferred mRNA targets at that time-point (NA). miRNAs were clustered by hierarchical clustering. (c) mRNAs dysregulated in > 1 time-point and targeted by > 2 of the 23 short-listed miRNAs across the time-course. Red shading indicates the number of miRNAs targeting each mRNA at each time-point.
Figure 6
Figure 6
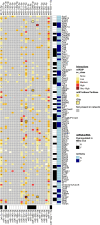
Comparison of the filtered miRNA-mRNA interaction network with human data. Visualisation of the 23 miRNAs, 110 mRNAs, and 398 unique miRNA-mRNA target interactions (MTIs; non-protein coding mRNAs removed) in the filtered inferred network across all time-points, and alignment with several publicly available resources. MiRNAs or mRNAs dysregulated in human temporal lobe epilepsy are indicated by black shading below and to the right of the heatmap, respectively. mRNAs previously implicated in epilepsy are indicated by navy annotations to the right of the heatmap. Inferred MTIs are coloured according to miRDIP confidence level. MTIs shaded grey do not occur in the inferred network. MTIs with experimental evidence (miRTarBase, TarBase) are indicated by *. MTIs present in the human iCLIP dataset are indicated by a solid black border.

Similar articles

Cited by

References

    1. Beghi E, et al. Global, regional, and national burden of epilepsy, 1990–2016: A systematic analysis for the Global Burden of Disease Study 2016. Lancet Neurol. 2019;18:357–375. doi: 10.1016/S1474-4422(18)30454-X. - DOI - PMC - PubMed
    1. Goldberg EM, Coulter DA. Mechanisms of epileptogenesis: A convergence on neural circuit dysfunction. Nat. Rev. Neurosci. 2013;14:337–349. doi: 10.1038/nrn3482. - DOI - PMC - PubMed
    1. Mello LEAM, et al. Circuit Mechanisms of Seizures in the Pilocarpine Model of Chronic Epilepsy—Cell Loss and Mossy Fiber Sprouting. Epilepsia. 1993;34:985–995. doi: 10.1111/j.1528-1157.1993.tb02123.x. - DOI - PubMed
    1. Devinsky O, Vezzani A, Najjar S, De Lanerolle NC, Rogawski MA. Glia and epilepsy: excitability and inflammation. Trends in Neurosciences. 2013;36:174–184. doi: 10.1016/j.tins.2012.11.008. - DOI - PubMed
    1. Vezzani A, French J, Bartfai T, Baram TZ. The role of inflammation in epilepsy. Nat. Rev. Neurol. 2011;7:31–40. doi: 10.1038/nrneurol.2010.178. - DOI - PMC - PubMed