. 2024 Jul 3;7(1):804.
doi: 10.1038/s42003-024-06476-z.

Undenatured type II collagen protects against collagen-induced arthritis by restoring gut-joint homeostasis and immunity

Affiliations

Undenatured type II collagen protects against collagen-induced arthritis by restoring gut-joint homeostasis and immunity

Piaopiao Pan et al. Commun Biol. .

Abstract

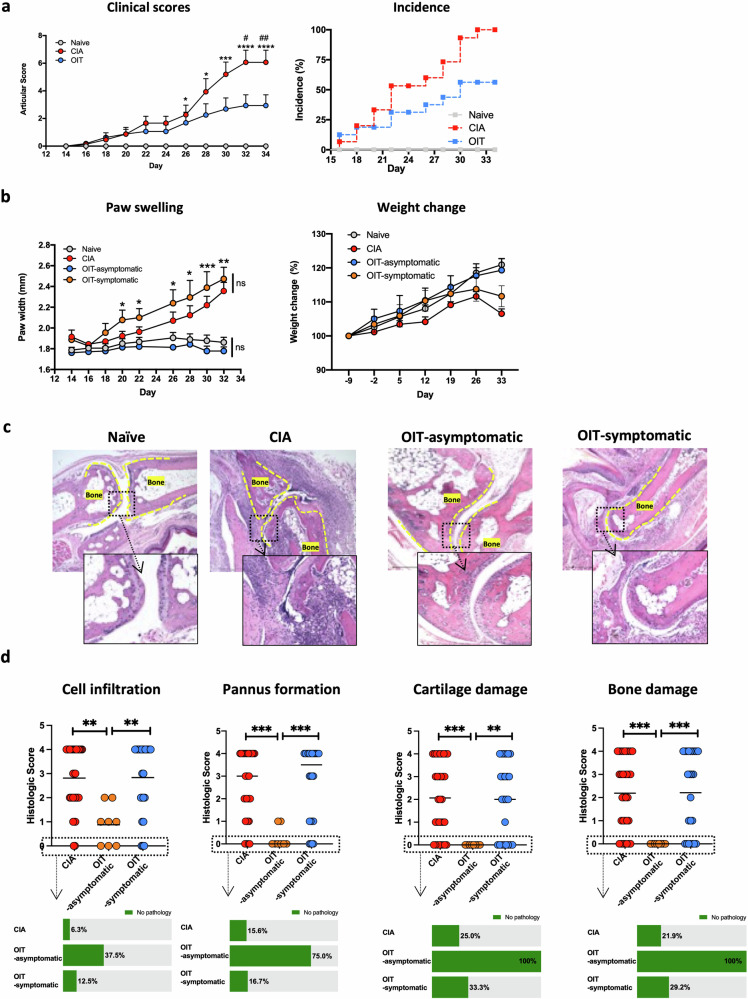
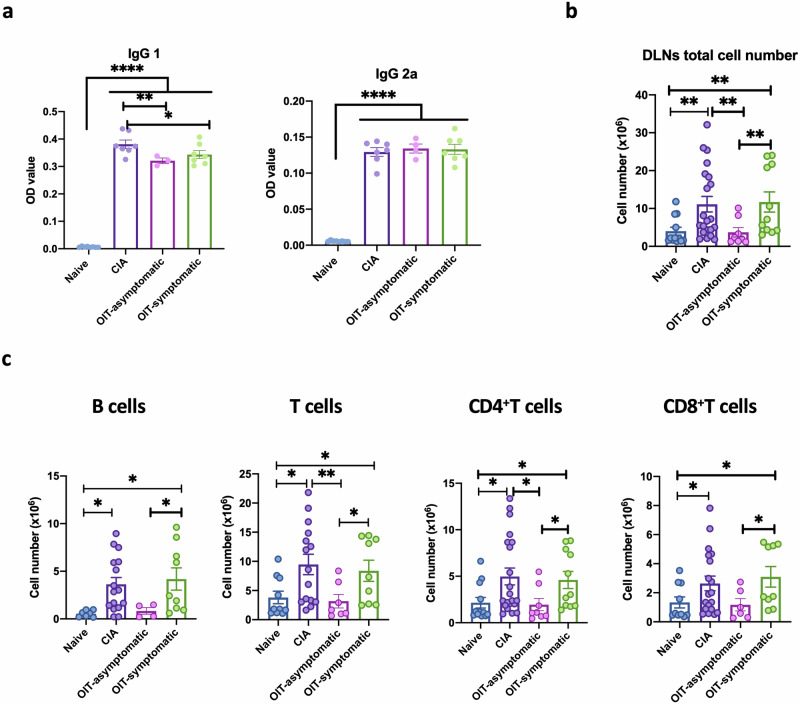
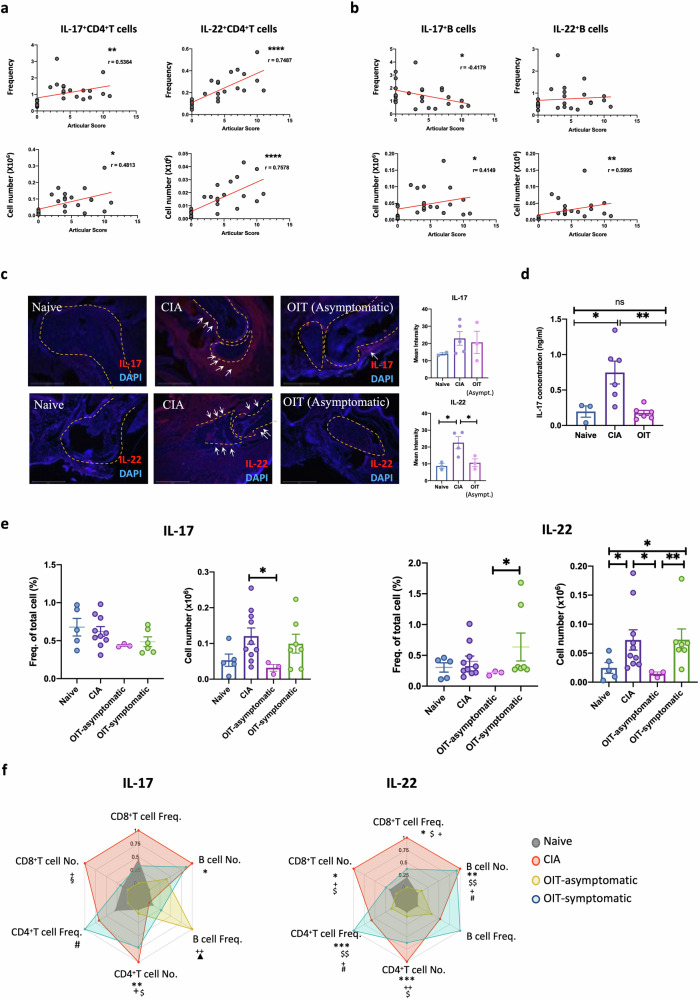
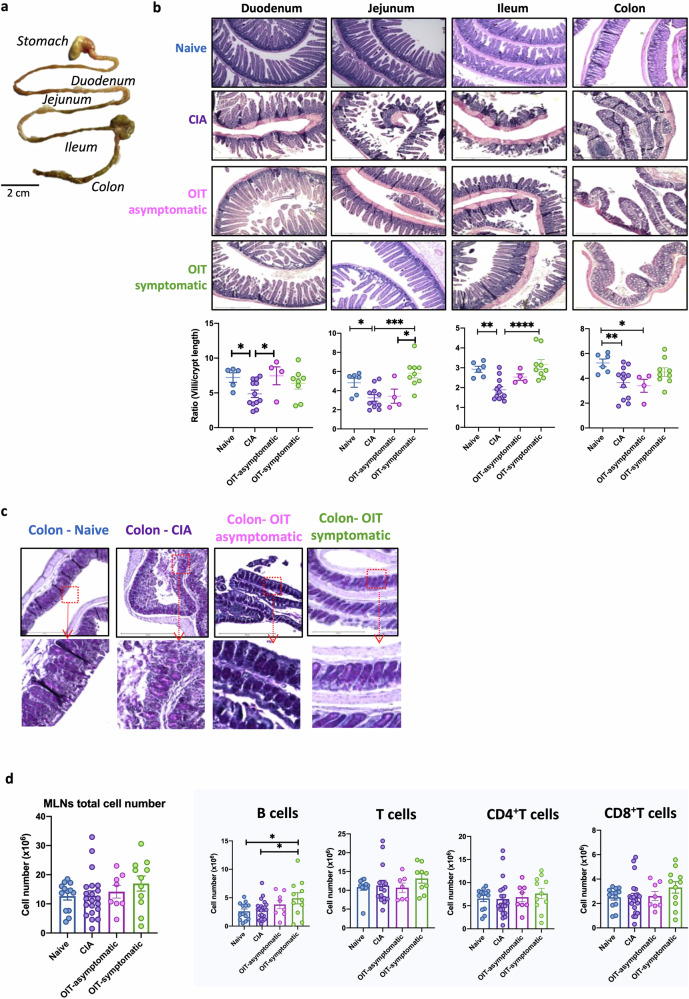
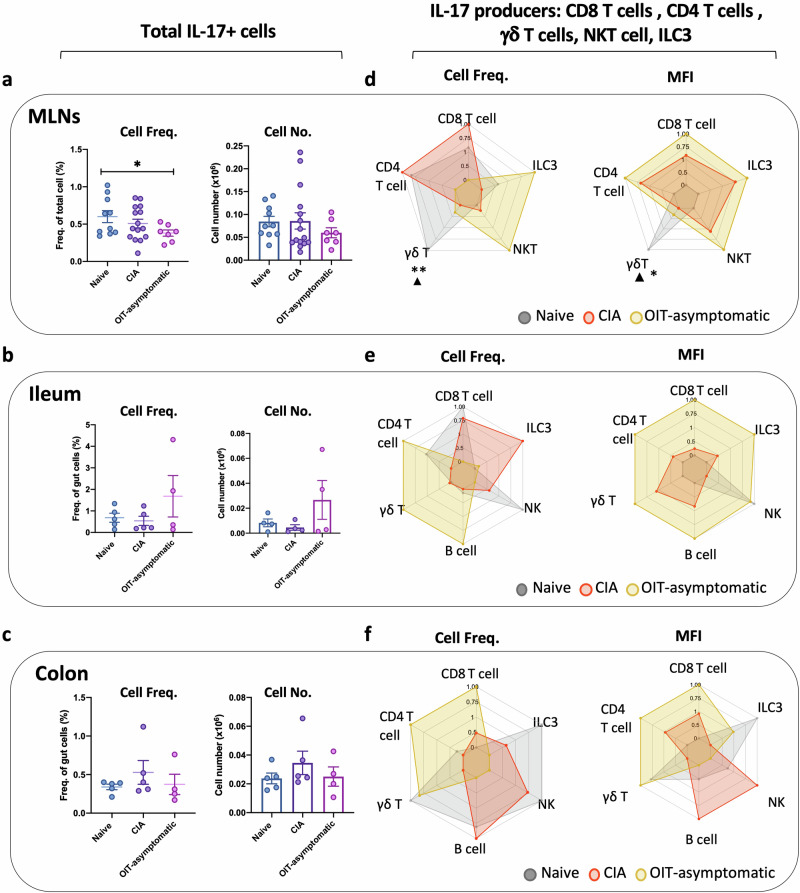
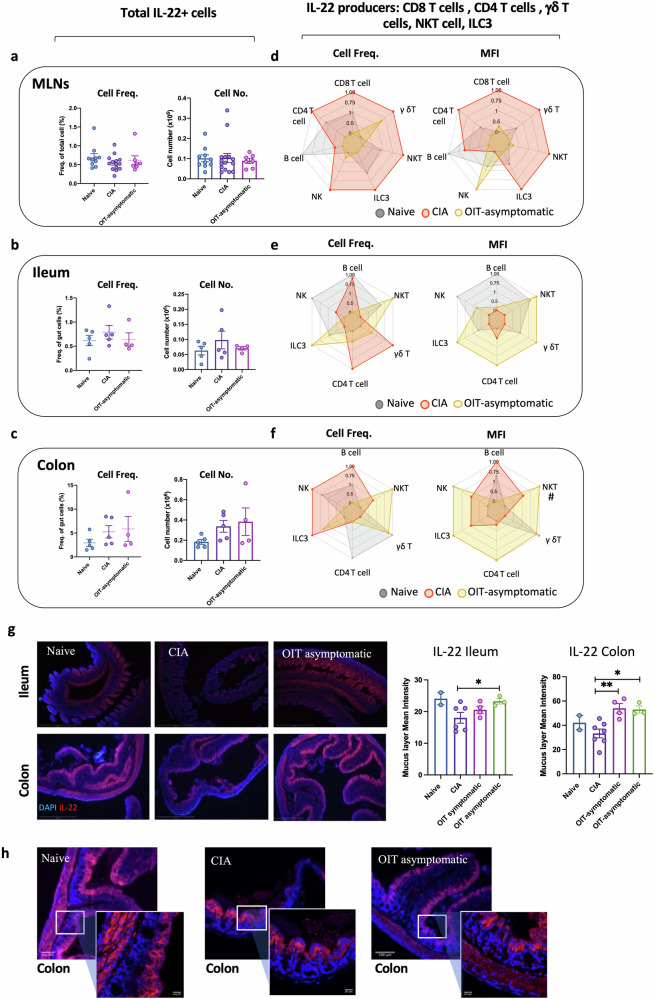
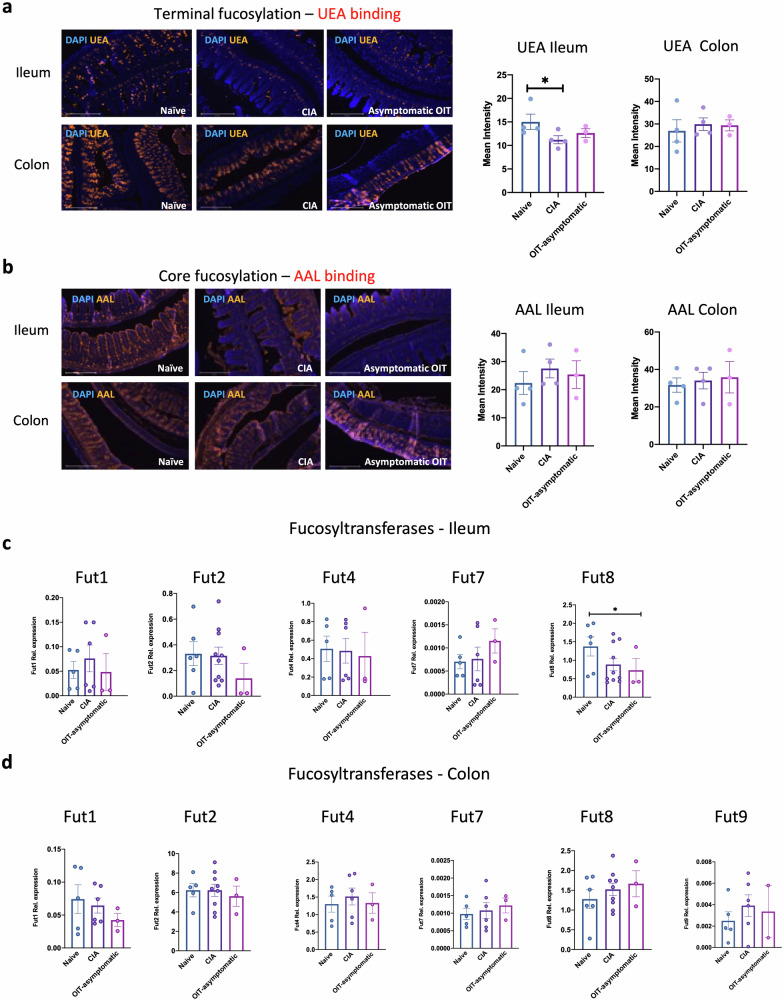
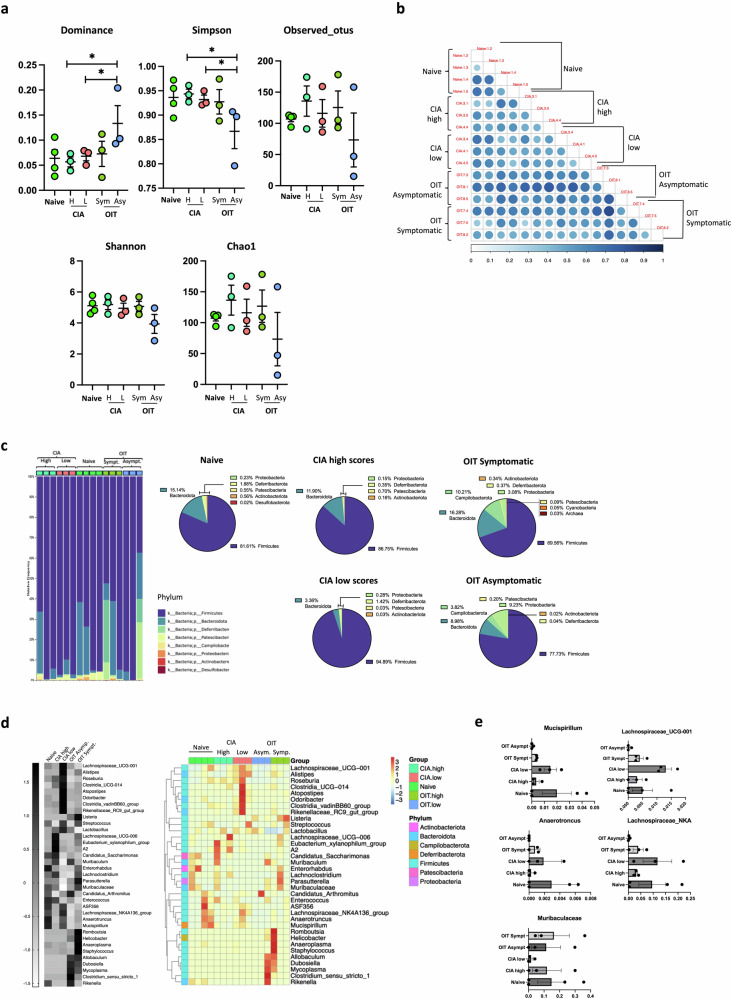
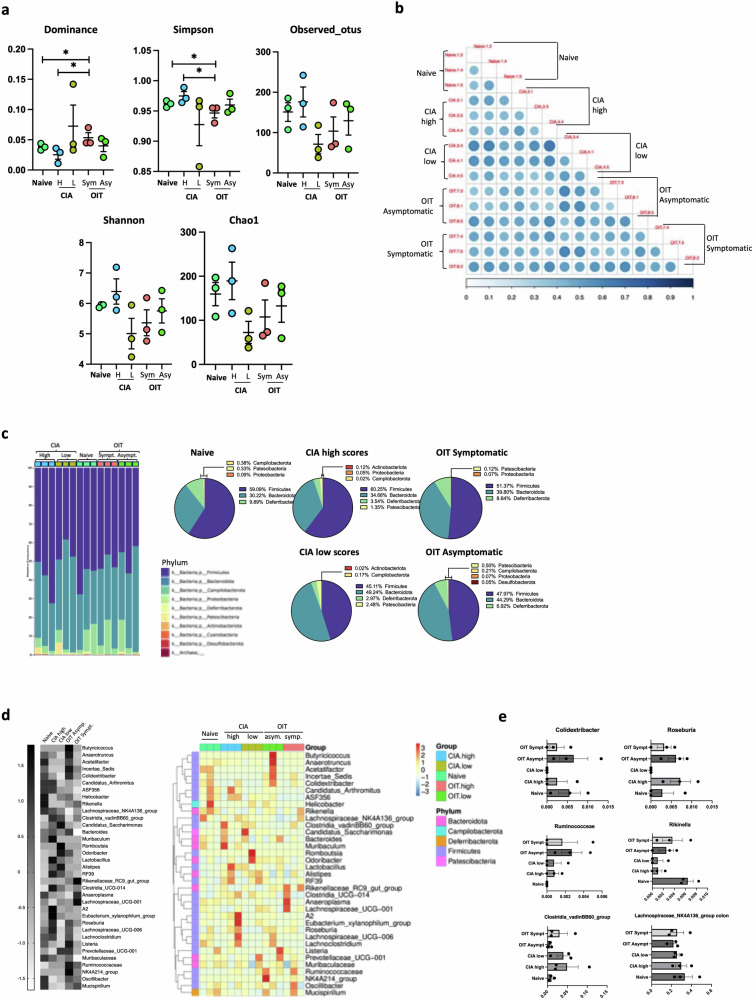
Oral administration of harmless antigens can induce suppression of reactive immune responses, a process that capitalises on the ability of the gastrointestinal tract to tolerate exposure to food and commensal microbiome without triggering inflammatory responses. Repeating exposure to type II collagen induces oral tolerance and inhibits induction of arthritis, a chronic inflammatory joint condition. Although some mechanisms underlying oral tolerance are described, how dysregulation of gut immune networks impacts on inflammation of distant tissues like the joints is unclear. We used undenatured type II collagen in a prophylactic regime -7.33 mg/kg three times/week- to describe the mechanisms associated with protective oral immune-therapy (OIT) in gut and joint during experimental Collagen-Induced Arthritis (CIA). OIT reduced disease incidence to 50%, with reduced expression of IL-17 and IL-22 in the joints of asymptomatic mice. Moreover, whilst the gut tissue of arthritic mice shows substantial damage and activation of tissue-specific immune networks, oral administration of undenatured type II collagen protects against gut pathology in all mice, symptomatic and asymptomatic, rewiring IL-17/IL-22 networks. Furthermore, gut fucosylation and microbiome composition were also modulated. These results corroborate the relevance of the gut-joint axis in arthritis, showing novel regulatory mechanisms linked to therapeutic OIT in joint disease.


Conflict of interest statement

Z.S., E.K.A. and A.S. are employees of Lonza Greenwood LLC., Greenwood, SC, USA. The remaining authors declare no competing interests.

Figures

Fig. 1
Fig. 1. Disease scores and histological analysis in response to oral immunotherapy (OIT) in CIA mice.
a Disease scores (left panel) and incidence (right panel) were evaluated at the indicated time points for naïve (grey), CIA (red) and CIA-OIT (blue). OIT consisted of administration of undenatured type II collagen by oral gavage 3 times a week, starting 2 weeks before induction of arthritis. Cumulative disease scores were given for each limb, 0 = no disease and 4 = highest score. Each dot represents the mean of individual mice and error bars show SEM (n = 15 for CIA, n = 16 for OIT groups, n = 9 for naïve mice, data from 2 independent experiments). Statistical significance was determined by one-way ANOVA; *p < 0.05, ***p < 0.001 between CIA and naïve, #p < 0.05, ##p < 0.01 comparing CIA and OIT groups. Disease incidence was calculated by dividing the number of cases by the total number of mice in the group at the indicated times. b Paw width (left panel) and weight change (percentage of initial weight, right panel) were evaluated at the indicated time points. Each dot represents the mean of individual mice, error bars show SEM (n = 15 for CIA, n = 7 for OIT asymptomatic, n = 9 for OIT symptomatic, n = 9 for naïve mice, data from 2 independent experiments). Statistical significance was determined by one-way ANOVA; *p < 0.05, ***p < 0.01,***p < 0.001, ns = non-significant. c Hind paws were collected at the end of the experiment (day 34) for each mouse, sectioned, and stained with haematoxylin and eosin for histological analysis. Images show one representative mouse (Disease score = median for each group). Superimposed dotted lines show bone limits; scale bar = 500 μm. d Cell infiltration, pannus formation, cartilage and bone damage were quantified for individual mice in hematoxilin/eosin-stained sections. Dot plots show histological scores (from 0 to 4, 0 = healthy tissue, 4 = highest possible score). Individual dots represent individual paws (n = 32 for CIA, n = 8 for OIT asymptomatic, and n = 24 for OIT symptomatic, data collected from 2 independent experiments). Bars show the mean value for each group. Statistical significance was determined by the Kruskal–Wallis test; **p < 0.01, ***p < 0.001. The percentage of mice with no sign of pathology (green) for the indicated parameter is shown in vertical column graphs.
Fig. 2
Fig. 2. Cellular and humoral responses in response to oral immunotherapy (OIT) in the joint.
a Anti type II collagen antibodies, IgG1 and IgG2 isotypes, were evaluated by ELISA in serum from naïve control mice (n = 8), CIA (n = 7, mean of disease score 4.86) and OIT mice (n = 7 for OIT symptomatic, mean of disease scores = 7; n = 4 for OIT asymptomatic) at day 33 after induction of arthritis. Values represent Optical Density (OD) at 450 nm. Each dot represents the mean values of individual mice analysed in technical triplicates. b Total cell numbers isolated from draining lymph nodes (DLNs) collected from all naïve, CIA, asymptomatic and symptomatic OIT mice. c Total number of B cells, total T cells, CD4 and CD8 T cells in DLNs from (b) were evaluated by Flow Cytometry. Each dot in ac column bars represents values of individual mice collated from 2 independent experiments. Error bars show mean ± SEM. Statistical significance was determined using ordinary one-way ANOVA. Significance is indicated by asterisks, *p < 0.05, **p < 0.01 and ***p < 0.001.
Fig. 3
Fig. 3. OIT protection is associated with reduced upregulation of inflammatory IL-17 and IL-22 in the joint and draining lymph nodes.
Naïve, CIA and CIA-OIT mice were culled at day 33 when tissue was collected for further analysis. a, b Correlation between numbers of IL-17 and IL-22 positive lymph node cells and clinical scores in T cells (a) and B cells (b) isolated from draining lymph nodes (DLNs). Every dot represents values for individual mice from all groups. Data are presented as mean ± SEM, r: Pearson’s coefficient. c Expression of IL-17 and IL-22 (red) was evaluated in the joint tissue by immunofluorescence in naïve, CIA and OIT asymptomatic mice. DAPI (Blue) was used to stain nuclei as counterstaining. Superimposed dotted lines show bone tissue and areas of cell infiltration are indicated by white arrows. Scale bars: 500 μm. Graphs show the quantification of the mean intensity of individual mice. d IL-17 concentration was evaluated by ELISA in the supernatants of draining lymph node cells upon PMA (50 ng/ml)/Ionomycin (500 ng/ml) stimulation for 12 h. Data show naïve, CIA and OIT (symptomatic and asymptomatic). Each dot represents cells from one individual mouse. Error bars show mean ± SEM; *p < 0.05, **p < 0.01 analysed by one-way ANOVA from one experimental model. e Relative frequency and total cell number of IL-17+ and IL-22+ DLN cells were evaluated by flow cytometry. Data show mean ± SEM; each dot represents individual mice from two independent experimental models; *p < 0.05, analysed by one-way ANOVA. f Cell frequency and total cell numbers of IL-17+ and IL-22+ CD4 T cells, CD8 T cells and B cells in DLNs, represented at the corners of radar charts: Naïve (grey), CIA (red) and OIT asymptomatic (orange) and OIT symptomatic (blue); data were normalised to maximum expression in each group. Significance on the raw data among groups was evaluated by ordinary one-way ANOVA, where *p < 0.05, **p < 0.01 [CIA vs naïve]; $p < 0.05 [naïve vs OIT symptomatic]; p < 0.05 [naïve vs OIT asymptomatic]; +p < 0.05 [CIA vs OIT asymptomatic]; §p < 0.05 [CIA vs OIT asymptomatic]; #p < 0.05 [OIT asymptomatic vs OIT symptomatic].
Fig. 4
Fig. 4. OIT protects against gastrointestinal damage associated with inflammatory arthritis in both symptomatic and asymptomatic cases.
Naïve, CIA and OIT asymptomatic mice and OIT symptomatic mice were culled at day 33 when gut tissue and total mesenteric lymph nodes (MLNs) were collected. a Isolated gastrointestinal tract from a naïve mouse showing the four anatomical areas used for further study. b Duodenum, jejunum, ileum, and colon were fixed, and tissue sections were subjected to hematoxylin and eosin staining. The length of villi and crypts was measured using Image J software, and the ratio of villi/crypt was quantified. Each dot represents the villi/crypt ratio for individual mice, and data were collated from two independent experiments. Statistical significance was evaluated by ordinary one-way ANOVA, where *p < 0.05, **p < 0.01 and ***p < 0.001. c Colon tissue sections were stained with PAS to detect changes in the mucus layer and associated pathology. Scale bars = 500 μm. The depicted mice are representative of individual mice whose disease scores fall within the median value for each group. d MLNs were collected to generate single-cell suspensions, and a total number of cells was counted. Cell number and percentage of B cells, total T cells, CD4 and CD8 T cells were evaluated by Flow Cytometry. Each dot represents one individual mouse and error bars show mean ± SEM. Mice were pooled from 2 independent experiments. Statistical significance was determined using Ordinary one-way ANOVA. Significance is indicated by asterisks, *p < 0.05, **p < 0.01.
Fig. 5
Fig. 5. Expression of IL-17 in mesenteric lymph nodes gastrointestinal tract.
Naïve, CIA and OIT asymptomatic mice were culled at day 33, when mesenteric lymph nodes (MLNs), ileum and colon samples were collected. Single-cell suspensions were obtained from MLNs and digested gut tissue, and IL-17 expression was subsequently evaluated by flow cytometry in total isolated cells (ac) and specific cell populations, including CD4 T cells, CD8 T cells, group 3 innate lymphoid cells (ILC3), γδ T cells and NK cells (df). ac Percentage and number of total IL-17+ cells in MLNs (a), ileum samples (b) and colon (c). Each dot represents values of individual mice; bars show mean values for each group ± SEM; Naïve n = 10. CIA n = 15, asymptomatic OIT n = 7. Statistical significance was determined using ordinary one-way ANOVA, *p < 0.05. df Relative cell frequency and mean fluorescence intensity (MFI) of IL-17 in the indicated cell populations in MLNs (d), single cells isolated from the ileum (e) and colon (f). Each corner of the radar charts represents the indicated normalised parameter for naïve (grey), CIA (red) and asymptomatic OIT (orange) mice. Data were normalised to maximum expression in each group; naïve n = 5, CIA n = 5, asymptomatic OIT n = 4. Statistical significance was determined using raw data and ordinary one-way ANOVA. *p < 0.05, **p < 0.01 in CIA versus Naïve; p < 0.05 [naïve vs OIT asymptomatic].
Fig. 6
Fig. 6. Expression of IL-22 in mesenteric lymph nodes and gastrointestinal tract.
Naïve, CIA and OIT asymptomatic mice were culled at day 33, when mesenteric lymph nodes (MLNs), ileum and colon samples were collected. Single-cell suspensions were obtained from MLNs and digested gut tissue, and IL-22 expression was subsequently evaluated by flow cytometry in total isolated cells (ac) and specific cell populations, including CD4 T cells, CD8 T cells, B cells, group 3 innate lymphoid cells (ILC3), γδ T cells, NK cells and NKT cells (df). ac Percentage and number of total IL-22+ cells in MLNs (a), ileum samples (b) and colon (c). Naïve n = 10. CIA n = 15, asymptomatic OIT n = 7. Each dot represents values for individual mice; bars show mean values for each group ± SEM. df Relative cell frequency and mean fluorescence intensity (MFI) of IL-22 in the indicated cell populations in MLNs (d), single cells isolated from the ileum (e) and colon (f). Each corner of the radar charts represents the indicated normalised parameter for naïve (grey), CIA (red) and asymptomatic OIT (orange) mice. Data were normalised to maximum expression in each group; naïve n = 5, CIA n = 5, asymptomatic OIT n = 4. g Ileum and colon sections were stained with anti-IL-22 antibodies and specific secondary antibodies (Red) and DAPI (Blue) as counterstaining. Scale bars = 500 μm. Pixel intensity for IL-22 staining was quantified using ImageJ, each dot shows the mean value of 10 different areas for each individual mouse. Error bars show standard error (SEM). Statistical significance was determined using raw data and ordinary one-way ANOVA, where *p < 0.05, **p < 0.01. h Detailed images of colon sections stained for IL-22, scale bars = 100 μm and 20 μm for zoomed areas.
Fig. 7
Fig. 7. Effect of protective OIT on fucosylation and fucosyltransferase expression in the gut tissue during arthritis.
a, b Ileum and colon sections from naïve, CIA and asymptomatic OIT mice were stained with UEA (a) and AAL (b) biotinylated lectins and fluorescence streptavidin (yellow) to detect terminal and core fucosylation respectively. DAPI (Blue) was used as counterstaining. Scale bars: 500 μm. Images show one representative example of each group. Graphs show the mean pixel intensity for lectin staining in individual mice; each dot shows the mean value from 10 different analysed areas, quantified using Image J software. c, d Relative expression of fucosyltransferases mRNA was evaluated by RT-PCR in the ileum (c) and colon (d) samples, including FUT1, FUT2, FUT4, FUT7, FUT8 and FUT9. Expression is shown as relative to actin expression. Statistical significance was evaluated by one-way ANOVA where *p < 0.05. Each dot represents values of individual mice where data are collected from two independent experiments. Error bars represent standard error (SEM).
Fig. 8
Fig. 8. Analysis of the microbial composition in the ileum.
Faecal matter was taken from the ileum of naïve mice (n = 4), severe arthritis (CIA high, n = 3, disease scores 11, 10 and 7), mild arthritis (CIA low, n = 3; disease scores 3, 4 and 4), symptomatic OIT mice (OIT high, n = 3; disease scores 5, 6 and 4) and asymptomatic OIT mice (OIT low, n = 3) at day 33 when DNA was isolated and subjected to 16 S ribosomal RNA (rRNA) amplification and sequencing. a Alpha Diversity analysis, including observed_ otus, shannon, simpson, chao1, dominance and pielou_e indices. Each dot represents individual mice; graphs show the mean ± SEM. Kruskal–Wallis test was used to analyse whether the differences in species diversity between groups were significant, *p < 0.05. b Beta diversity indices heatmap of unweighted unifrac distance Matrix. The size and colour of the circle in the square represent the differences in coefficient between the two samples. The larger the circle is, the darker the corresponding colour is, indicating that the differences between the two samples are greater. c Relative abundance of the indicated phyla. Each column shows data from individual mice. Data are also presented as pie charts, presenting proportion values for each group as means. d Clustering of Species Abundance. The top 35 genera in abundance were clustered from the species and sample levels according to their abundance information in each sample. Heatmap in grey scale shows the mean value of all mice in the group for Z value of taxonomic relative abundance after standardisation. The coloured heatmap represents the values for individual mice: the x-axis represents the sample name, and the y-axis represents the function annotation. The cluster tree on the left side is the species cluster tree. e Relative abundance of the indicated genera. Data show mean ± SEM and dots represent individual mice.
Fig. 9
Fig. 9. Analysis of the microbial composition in the colon.
Faecal matter was taken from the colon of naïve mice (n = 3), severe arthritis (CIA high, n = 3, disease scores 11, 10 and 7), mild arthritis (CIA low, n = 3; disease scores 3, 4 and 4), symptomatic OIT mice (OIT high, n = 3; disease scores 5, 6 and 4) and asymptomatic OIT mice (OIT low, n = 3) at day 33, when DNA was isolated and subjected to 16 S ribosomal RNA (rRNA) amplification and sequencing. a Alpha Diversity analysis, including observed_ otus, shannon, simpson, chao1, dominance and pielou_e indices. Each dot represents one individual mouse; graphs show the mean ± SEM. Kruskal–Wallis test was used to analyze whether the differences in species diversity between groups were significant, *p < 0.05. b Beta diversity indices heatmap of unweighted unifrac distance Matrix. The size and colour of the circle in the square represent the differences in coefficient between the two samples. The larger the circle is, the darker the corresponding colour is, indicating that the differences between the two samples are greater. c Relative abundance of the indicated phyla. Each column shows data from individual mice. Data are also presented as pie charts, presenting proportion values for each group as means. d Clustering of species abundance. The top 35 genera in abundance were clustered from the species and sample levels according to their abundance information in each sample. Heatmap in grey scale shows the mean value of all mice in the group for Z value of taxonomic relative abundance after standardisation. The coloured heatmap represents the values for individual mice: the x-axis represents the sample name, and the y-axis represents the function annotation. The cluster tree on the left side is the species cluster tree. e Relative abundance of the indicated genera. Data show mean ± SEM and dots represent individual mice.

Similar articles

References

    1. Figus FA, Piga M, Azzolin I, McConnell R, Iagnocco A. Rheumatoid arthritis: extra-articular manifestations and comorbidities. Autoimmun. Rev. 2021;20:102776. doi: 10.1016/j.autrev.2021.102776. - DOI - PubMed
    1. Smolen JS, et al. Rheumatoid arthritis. Nat. Rev. Dis. Prim. 2018;4:18001. doi: 10.1038/nrdp.2018.1. - DOI - PubMed
    1. Safiri S, et al. Global, regional and national burden of rheumatoid arthritis 1990-2017: a systematic analysis of the Global Burden of Disease study 2017. Ann. Rheum. Dis. 2019;78:1463–1471. doi: 10.1136/annrheumdis-2019-215920. - DOI - PubMed
    1. Holers VM. Autoimmunity to citrullinated proteins and the initiation of rheumatoid arthritis. Curr. Opin. Immunol. 2013;25:728–735. doi: 10.1016/j.coi.2013.09.018. - DOI - PMC - PubMed
    1. Muller S, Radic M. Citrullinated autoantigens: from diagnostic markers to pathogenetic mechanisms. Clin. Rev. Allergy Immunol. 2015;49:232–239. doi: 10.1007/s12016-014-8459-2. - DOI - PubMed

Publication types