

Identification of commensal gut microbiota signatures as predictors of clinical severity and disease progression in multiple sclerosis
- PMID: 38961134
- PMCID: PMC11222390
- DOI: 10.1038/s41598-024-64369-x
Identification of commensal gut microbiota signatures as predictors of clinical severity and disease progression in multiple sclerosis
Abstract
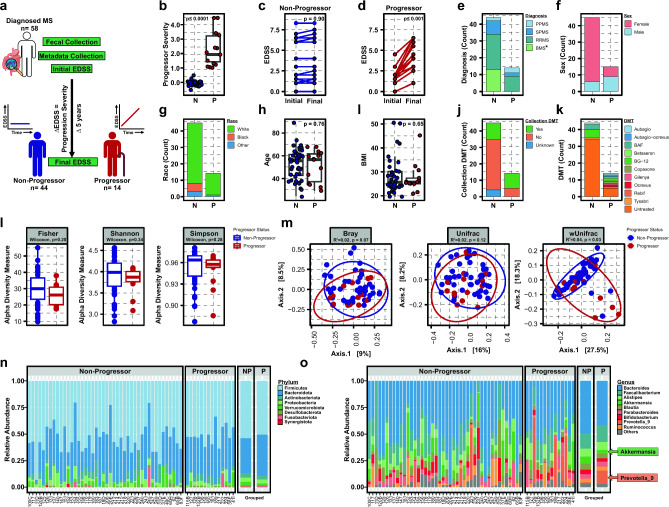
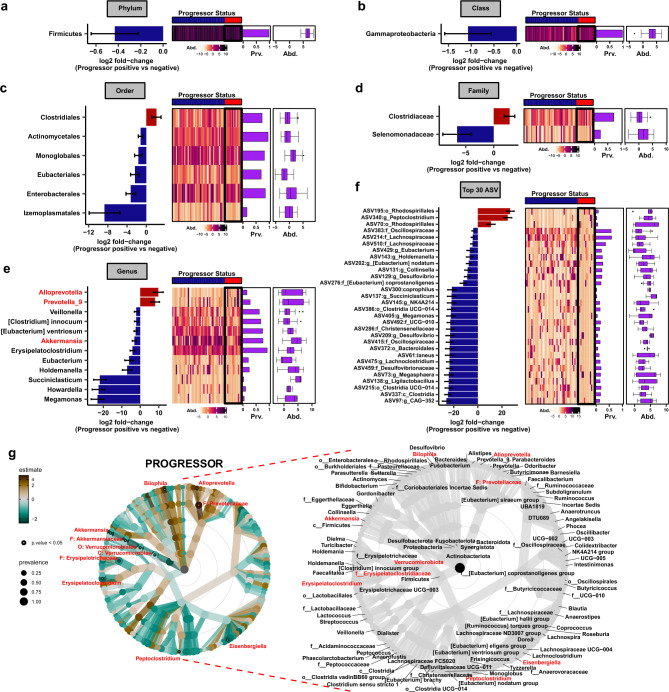
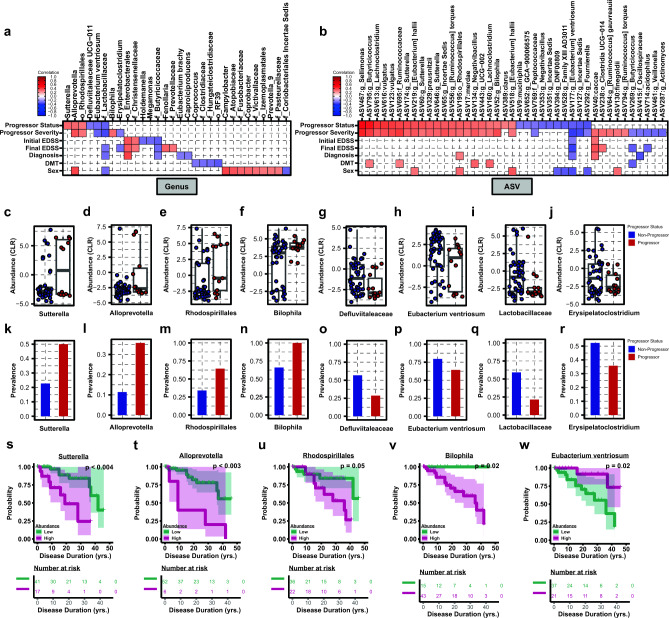
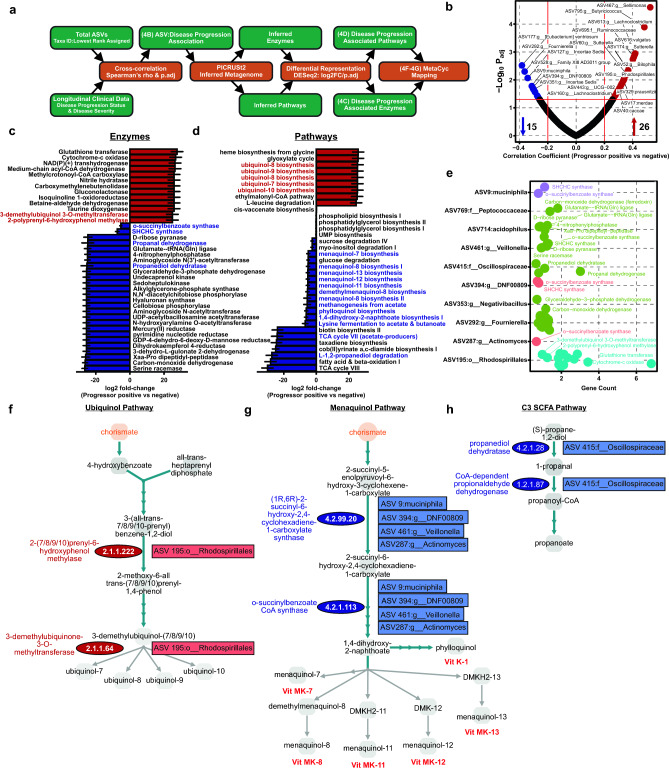
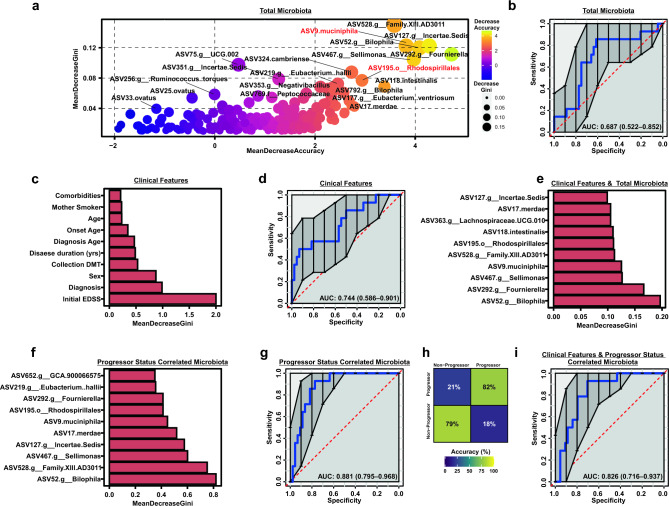
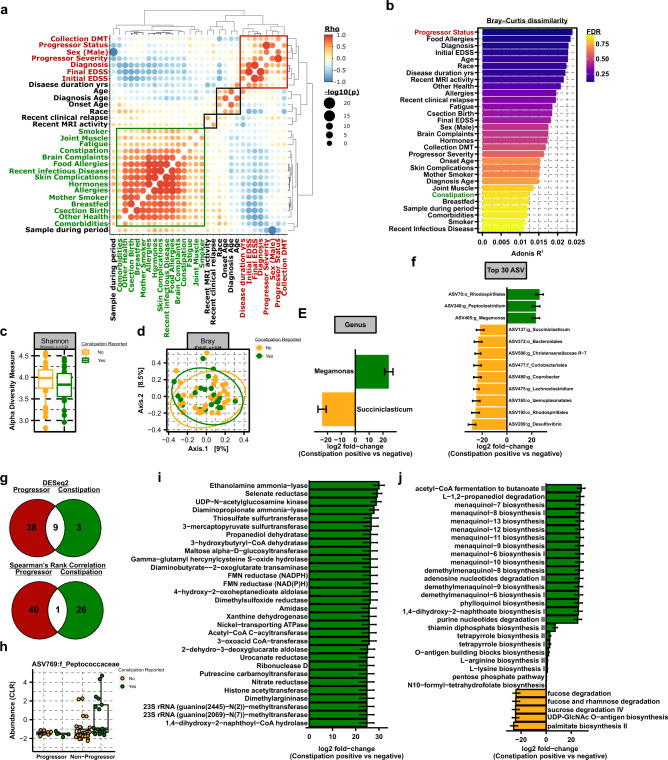
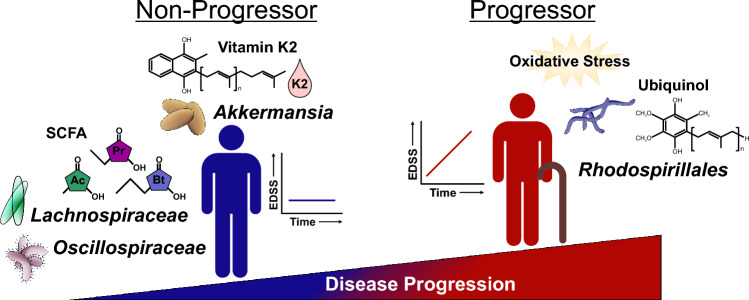
Multiple sclerosis (MS) is a chronic autoimmune disease of the central nervous system and a leading cause of neurological disability in young adults. Clinical presentation and disease course are highly heterogeneous. Typically, disease progression occurs over time and is characterized by the gradual accumulation of disability. The risk of developing MS is driven by complex interactions between genetic and environmental factors, including the gut microbiome. How the commensal gut microbiota impacts disease severity and progression over time remains unknown. In a longitudinal study, disability status and associated clinical features in 58 MS patients were tracked over 4.2 ± 0.98 years, and the baseline fecal gut microbiome was characterized via 16S amplicon sequencing. Progressor status, defined as patients with an increase in Expanded Disability Status Scale (EDSS), were correlated with features of the gut microbiome to determine candidate microbiota associated with risk of MS disease progression. We found no overt differences in microbial community diversity and overall structure between MS patients exhibiting disease progression and non-progressors. However, a total of 41 bacterial species were associated with worsening disease, including a marked depletion in Akkermansia, Lachnospiraceae, and Oscillospiraceae, with an expansion of Alloprevotella, Prevotella-9, and Rhodospirillales. Analysis of the metabolic potential of the inferred metagenome from taxa associated with progression revealed enrichment in oxidative stress-inducing aerobic respiration at the expense of microbial vitamin K2 production (linked to Akkermansia), and a depletion in SCFA metabolism (linked to Oscillospiraceae). Further, as a proof of principle, statistical modeling demonstrated that microbiota composition and clinical features were sufficient to predict disease progression. Additionally, we found that constipation, a frequent gastrointestinal comorbidity among MS patients, exhibited a divergent microbial signature compared with progressor status. These results demonstrate a proof of principle for the utility of the gut microbiome for predicting disease progression in MS in a small well-defined cohort. Further, analysis of the inferred metagenome suggested that oxidative stress, vitamin K2, and SCFAs are associated with progression, warranting future functional validation and mechanistic study.
Keywords: Akkermansia; Bacterial metabolism; Gut microbiota; Multiple sclerosis; Progression; Vitamin K.
© 2024. The Author(s).
Conflict of interest statement
T.L.M, QWang, A.M., D.D., QWu, C.A.D., J.WS.M, J.Y., and DK have nothing to disclose. Y Mao-Draayer has served as a consultant and/or received grant support from: Acorda, Bayer Pharmaceutical, Chugai, Biogen Idec, Celgene/Bristol Myers Squibb, EMD Serono, Sanofi-Genzyme, Genentech, Novartis, Horizon, Janssen, Questor, and Teva Neuroscience.
Figures
Update of
-
Identification of commensal gut microbiota signatures as predictors of clinical severity and disease progression in multiple sclerosis.medRxiv [Preprint]. 2023 Jun 29:2023.06.26.23291875. doi: 10.1101/2023.06.26.23291875. medRxiv. 2023. Update in: Sci Rep. 2024 Jul 3;14(1):15292. doi: 10.1038/s41598-024-64369-x. PMID: 37425956 Free PMC article. Updated. Preprint.
Similar articles
-
Identification of commensal gut microbiota signatures as predictors of clinical severity and disease progression in multiple sclerosis.medRxiv [Preprint]. 2023 Jun 29:2023.06.26.23291875. doi: 10.1101/2023.06.26.23291875. medRxiv. 2023. Update in: Sci Rep. 2024 Jul 3;14(1):15292. doi: 10.1038/s41598-024-64369-x. PMID: 37425956 Free PMC article. Updated. Preprint.
-
Specific microbial ratio in the gut microbiome is associated with multiple sclerosis.Proc Natl Acad Sci U S A. 2025 Mar 11;122(10):e2413953122. doi: 10.1073/pnas.2413953122. Epub 2025 Mar 3. Proc Natl Acad Sci U S A. 2025. PMID: 40030030
-
Experimental autoimmune encephalomyelitis is associated with changes of the microbiota composition in the gastrointestinal tract.Sci Rep. 2020 Sep 16;10(1):15183. doi: 10.1038/s41598-020-72197-y. Sci Rep. 2020. PMID: 32938979 Free PMC article.
-
Short-chain fatty acids and gut microbiota in multiple sclerosis.Acta Neurol Scand. 2019 Mar;139(3):208-219. doi: 10.1111/ane.13045. Epub 2018 Dec 3. Acta Neurol Scand. 2019. PMID: 30427062
-
Changes in Gut Microbiota in Patients with Multiple Sclerosis Based on 16s rRNA Gene Sequencing Technology: A Review and Meta-Analysis.J Integr Neurosci. 2024 Jul 9;23(7):127. doi: 10.31083/j.jin2307127. J Integr Neurosci. 2024. PMID: 39082295
Cited by
-
Sex differences in the association between long-term ambient particulate air pollution and the intestinal microbiome composition of children.Environ Int. 2025 May;199:109457. doi: 10.1016/j.envint.2025.109457. Epub 2025 Apr 12. Environ Int. 2025. PMID: 40273556 Free PMC article.
-
Lactobacillaceae differentially impact butyrate-producing gut microbiota to drive CNS autoimmunity.Gut Microbes. 2024 Jan-Dec;16(1):2418415. doi: 10.1080/19490976.2024.2418415. Epub 2024 Oct 27. Gut Microbes. 2024. PMID: 39462277 Free PMC article.
-
Gut microbiota and multiple sclerosis: a potential diagnostic and prognostic marker?Neurodegener Dis Manag. 2024;14(6):189-192. doi: 10.1080/17582024.2024.2435249. Epub 2024 Nov 27. Neurodegener Dis Manag. 2024. PMID: 39600266 No abstract available.
-
Ahiflower seed and its press cake as sources of nutrients for laying hens and omega-3 fatty acids in their eggs.Poult Sci. 2025 Apr;104(4):104936. doi: 10.1016/j.psj.2025.104936. Epub 2025 Feb 27. Poult Sci. 2025. PMID: 40058003 Free PMC article.
-
Distinctive salivary oral microbiome in patients with burning mouth syndrome depending on pain intensity compared to healthy subjects.J Dent Sci. 2025 Jan;20(1):462-469. doi: 10.1016/j.jds.2024.05.022. Epub 2024 May 24. J Dent Sci. 2025. PMID: 39873084 Free PMC article.
References
MeSH terms
Substances
Grants and funding
- UM1-AI144298-01/Division of Intramural Research, National Institute of Allergy and Infectious Diseases (Division of Intramural Research of the NIAID)
- UM1-AI110557-05/Division of Intramural Research, National Institute of Allergy and Infectious Diseases (Division of Intramural Research of the NIAID)
- UM1 AI110557/AI/NIAID NIH HHS/United States
- R01 NS097596/NS/NINDS NIH HHS/United States
- UM1 AI144298/AI/NIAID NIH HHS/United States
LinkOut - more resources
Full Text Sources
Medical
