

Blood-brain barrier integrity is linked to cognitive function, but not to cerebral arterial pulsatility, among elderly
- PMID: 38961135
- PMCID: PMC11222381
- DOI: 10.1038/s41598-024-65944-y
Blood-brain barrier integrity is linked to cognitive function, but not to cerebral arterial pulsatility, among elderly
Abstract
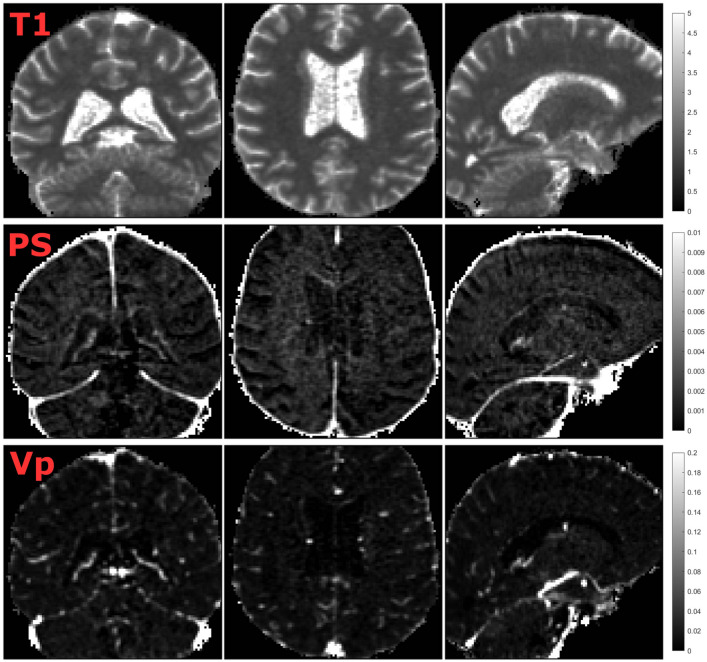
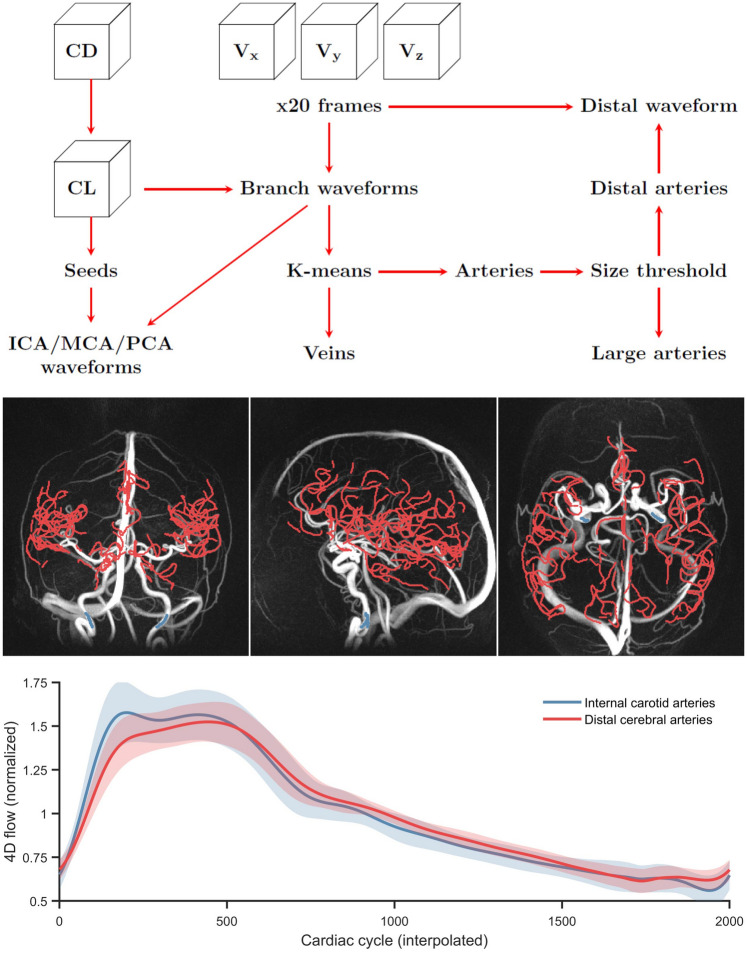
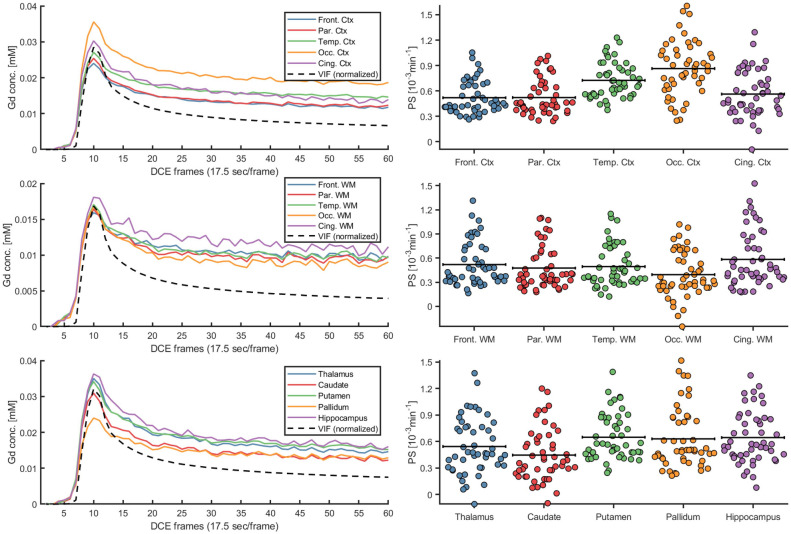
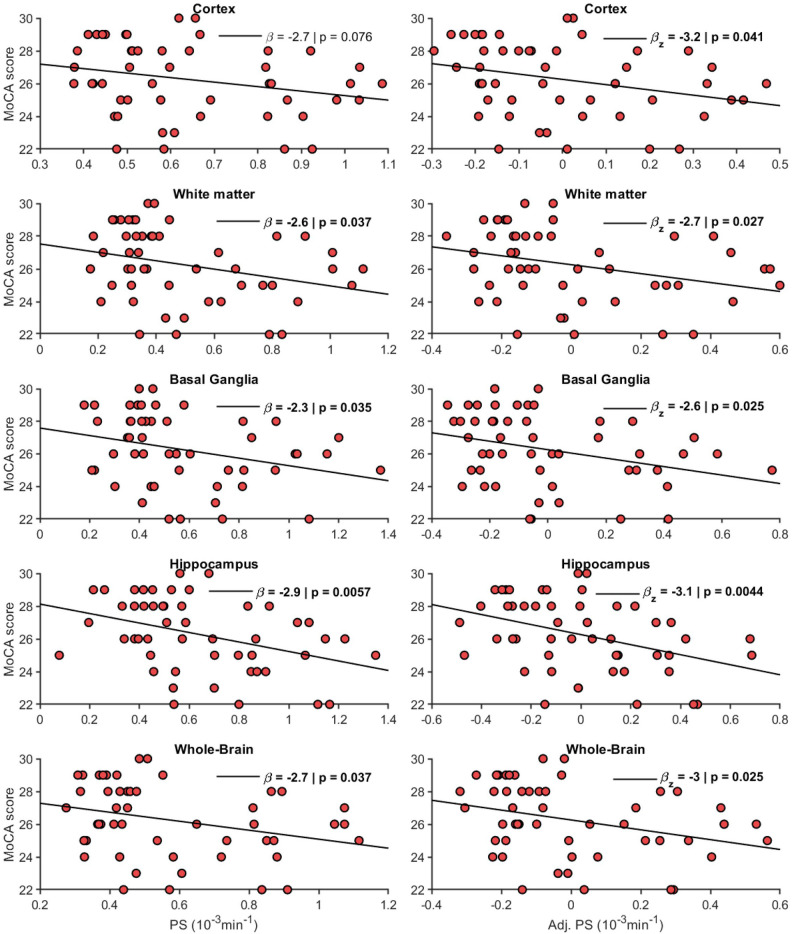
Blood-brain barrier (BBB) disruption may contribute to cognitive decline, but questions remain whether this association is more pronounced for certain brain regions, such as the hippocampus, or represents a whole-brain mechanism. Further, whether human BBB leakage is triggered by excessive vascular pulsatility, as suggested by animal studies, remains unknown. In a prospective cohort (N = 50; 68-84 years), we used contrast-enhanced MRI to estimate the permeability-surface area product (PS) and fractional plasma volume ( ), and 4D flow MRI to assess cerebral arterial pulsatility. Cognition was assessed by the Montreal Cognitive Assessment (MoCA) score. We hypothesized that high PS would be associated with high arterial pulsatility, and that links to cognition would be specific to hippocampal PS. For 15 brain regions, PS ranged from 0.38 to 0.85 (·10-3 min-1) and from 0.79 to 1.78%. Cognition was related to PS (·10-3 min-1) in hippocampus (β = - 2.9; p = 0.006), basal ganglia (β = - 2.3; p = 0.04), white matter (β = - 2.6; p = 0.04), whole-brain (β = - 2.7; p = 0.04) and borderline-related for cortex (β = - 2.7; p = 0.076). Pulsatility was unrelated to PS for all regions (p > 0.19). Our findings suggest PS-cognition links mainly reflect a whole-brain phenomenon with only slightly more pronounced links for the hippocampus, and provide no evidence of excessive pulsatility as a trigger of BBB disruption.
© 2024. The Author(s).
Conflict of interest statement
The authors declare no competing interests.
Figures
Similar articles
-
Cerebral arterial pulsatility is linked to hippocampal microvascular function and episodic memory in healthy older adults.J Cereb Blood Flow Metab. 2021 Jul;41(7):1778-1790. doi: 10.1177/0271678X20980652. Epub 2021 Jan 14. J Cereb Blood Flow Metab. 2021. PMID: 33444091 Free PMC article.
-
Characterizing pulsatility in distal cerebral arteries using 4D flow MRI.J Cereb Blood Flow Metab. 2020 Dec;40(12):2429-2440. doi: 10.1177/0271678X19886667. Epub 2019 Nov 13. J Cereb Blood Flow Metab. 2020. PMID: 31722598 Free PMC article.
-
Cardiac-induced cerebral pulsatility, brain structure, and cognition in middle and older-aged adults.Neuroimage. 2021 Jun;233:117956. doi: 10.1016/j.neuroimage.2021.117956. Epub 2021 Mar 11. Neuroimage. 2021. PMID: 33716158 Free PMC article.
-
Structural magnetic resonance imaging for the early diagnosis of dementia due to Alzheimer's disease in people with mild cognitive impairment.Cochrane Database Syst Rev. 2020 Mar 2;3(3):CD009628. doi: 10.1002/14651858.CD009628.pub2. Cochrane Database Syst Rev. 2020. PMID: 32119112 Free PMC article.
-
Impact of pulse pressure on cerebrovascular events leading to age-related cognitive decline.Am J Physiol Heart Circ Physiol. 2018 Jun 1;314(6):H1214-H1224. doi: 10.1152/ajpheart.00637.2017. Epub 2018 Feb 16. Am J Physiol Heart Circ Physiol. 2018. PMID: 29451817 Free PMC article. Review.
Cited by
-
MRI contrast accumulation in features of cerebral small vessel disease: blood-brain barrier dysfunction or elevated vascular density?Fluids Barriers CNS. 2025 Jul 16;22(1):74. doi: 10.1186/s12987-025-00675-4. Fluids Barriers CNS. 2025. PMID: 40671018 Free PMC article.
-
Imaging markers of neuroinflammation in aging and Alzheimer's disease and related dementia: A comprehensive review.Neurosci Biobehav Rev. 2025 Sep;176:106270. doi: 10.1016/j.neubiorev.2025.106270. Epub 2025 Jun 25. Neurosci Biobehav Rev. 2025. PMID: 40578495 Review.
-
Association between carotid artery hemodynamics and neurovascular coupling in cerebral small vessel disease: an exploratory study.Front Aging Neurosci. 2025 Feb 7;17:1536552. doi: 10.3389/fnagi.2025.1536552. eCollection 2025. Front Aging Neurosci. 2025. PMID: 39990104 Free PMC article.
References
MeSH terms
Grants and funding
LinkOut - more resources
Full Text Sources
Medical
Miscellaneous
