

Ecological genetics of isolated loach populations indicate compromised adaptive potential
- PMID: 38961235
- PMCID: PMC11286901
- DOI: 10.1038/s41437-024-00695-0
Ecological genetics of isolated loach populations indicate compromised adaptive potential
Abstract
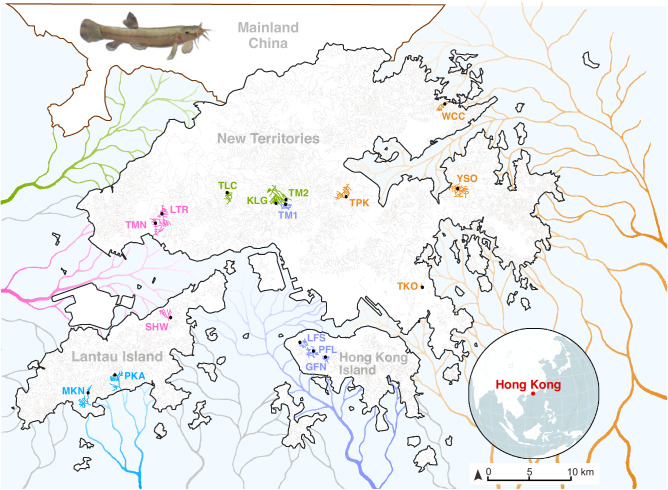
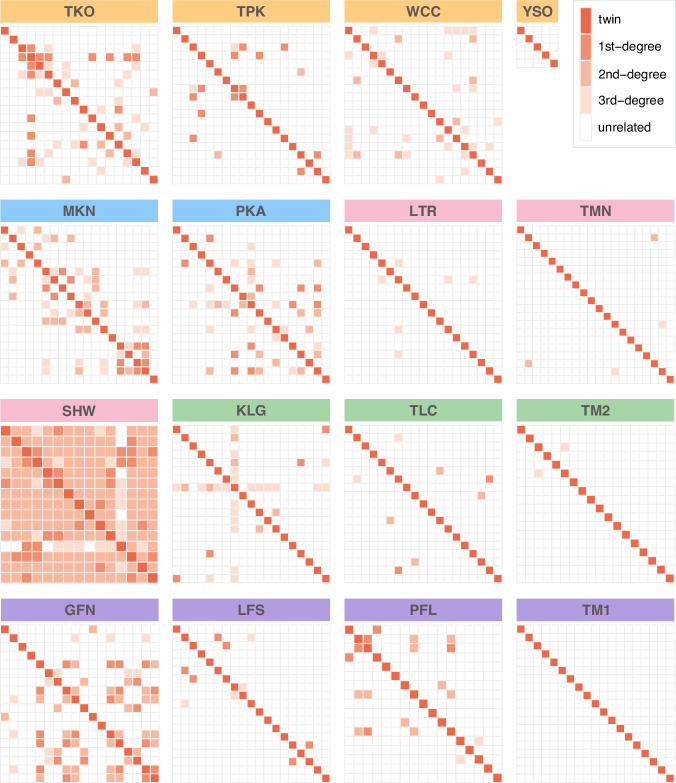
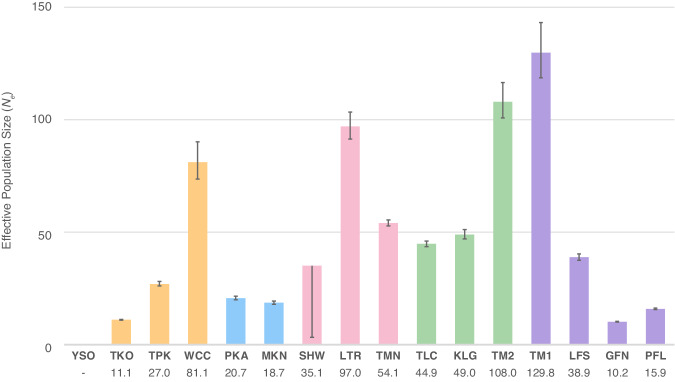
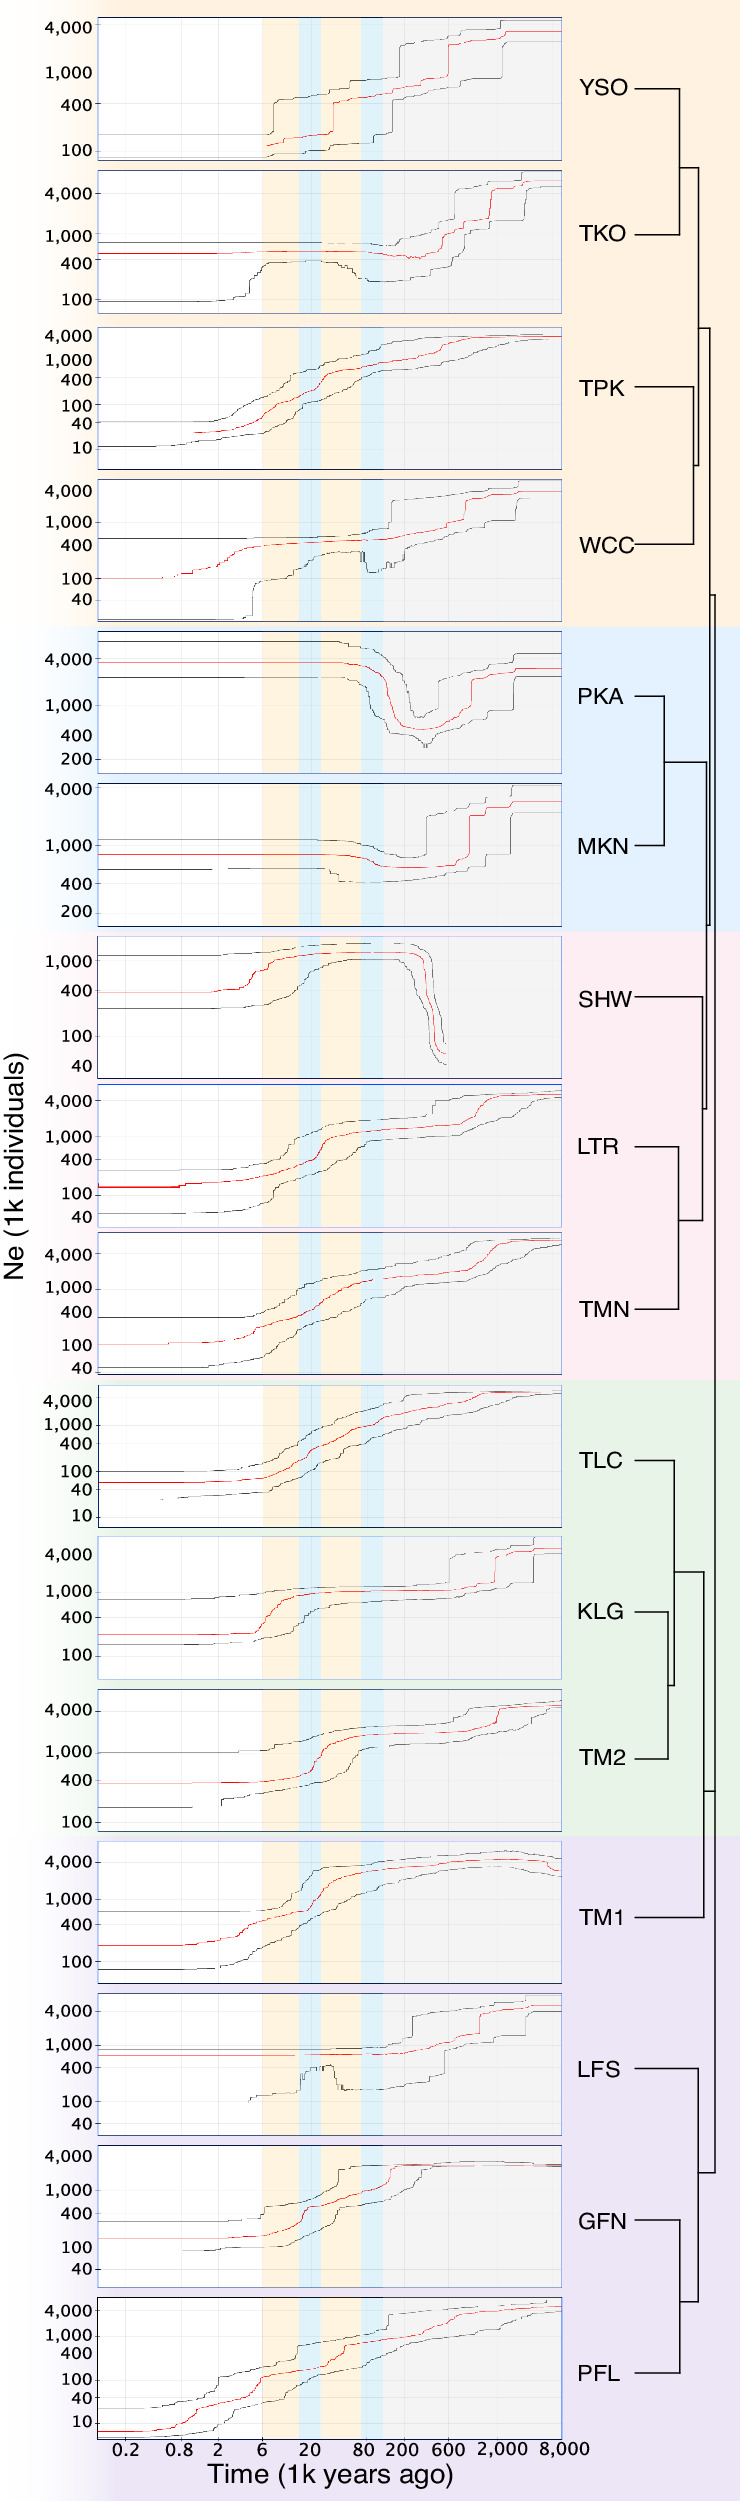
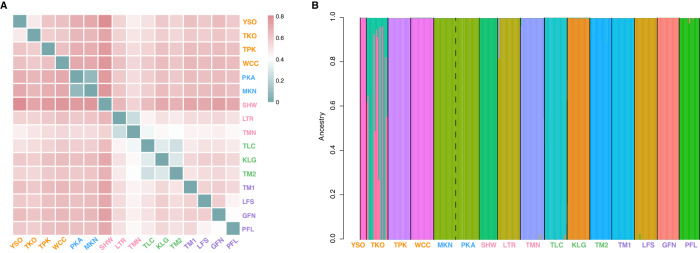
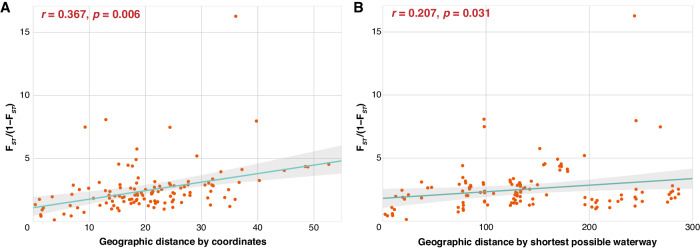
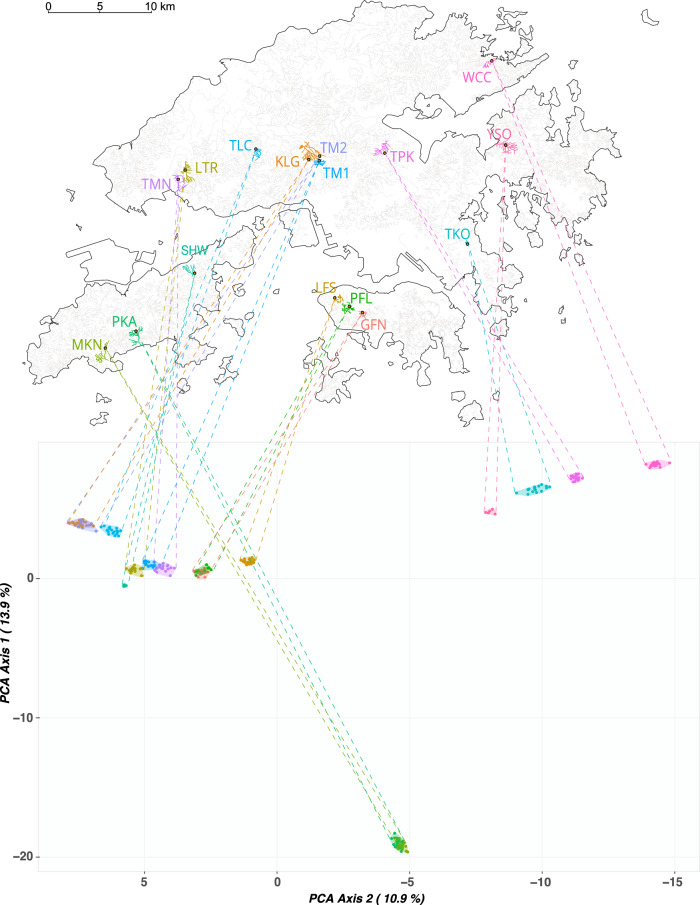
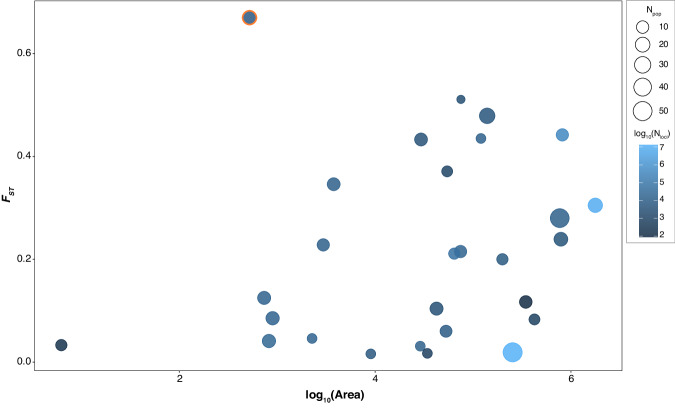
Many endangered species live in fragmented and isolated populations with low genetic variability, signs of inbreeding, and small effective population sizes - all features elevating their extinction risk. The flat-headed loach (Oreonectes platycephalus), a small noemacheilid fish, is widely across southern China, but only in the headwaters of hillstreams; as a result, they are spatially isolated from conspecific populations. We surveyed single nucleotide polymorphisms in 16 Hong Kong populations of O. platycephalus to determine whether loach populations from different streams were genetically isolated from each other, showed low levels of genetic diversity, signs of inbreeding, and had small contemporary effective population sizes. Estimates of average observed heterozygosity (HO = 0.0473), average weighted nucleotide diversity (πw = 0.0546) and contemporary effective population sizes (Ne = 10.2 ~ 129.8) were very low, and several populations showed clear signs of inbreeding as judged from relatedness estimates. The degree of genetic differentiation among populations was very high (average FST = 0.668), even over short geographic distances (<1.5 km), with clear patterns of isolation by distance. These results suggest that Hong Kong populations of O. platycephalus have experienced strong genetic drift and loss of genetic variability because sea-level rise after the last glaciation reduced connectedness among paleodrainages, isolating populations in headwaters. All this, together with the fact that the levels of genetic diversity and contemporary effective population sizes within O. platycephalus populations are lower than most other freshwater fishes, suggests that they face high local extinction risk and have limited capacity for future adaptation.
© 2024. The Author(s).
Conflict of interest statement
The authors declare no competing interests.
Figures
Similar articles
-
Chromosome-level haplotype-resolved genome of the tropical loach (Oreonectes platycephalus).Sci Data. 2025 Jan 7;12(1):29. doi: 10.1038/s41597-024-04301-0. Sci Data. 2025. PMID: 39774106 Free PMC article.
-
Investigation of genetic diversity in the loach Misgurnus anguillicaudatus revealed by whole-genome resequencing.BMC Genomics. 2024 Nov 21;25(1):1126. doi: 10.1186/s12864-024-10823-z. BMC Genomics. 2024. PMID: 39574010 Free PMC article.
-
Artificial barriers prevent genetic recovery of small isolated populations of a low-mobility freshwater fish.Heredity (Edinb). 2018 Jun;120(6):515-532. doi: 10.1038/s41437-017-0008-3. Epub 2018 Jan 12. Heredity (Edinb). 2018. PMID: 29326479 Free PMC article.
-
Factors affecting levels of genetic diversity in natural populations.Philos Trans R Soc Lond B Biol Sci. 1998 Feb 28;353(1366):177-86. doi: 10.1098/rstb.1998.0200. Philos Trans R Soc Lond B Biol Sci. 1998. PMID: 9533122 Free PMC article. Review.
-
Reappraisal of the Genetic Diversity Patterns in Puya raimondii-The Queen of the Andes: Insights from Molecular Marker Analysis Reveal an Inbreeding Reproductive Strategy.Plants (Basel). 2025 Jan 22;14(3):321. doi: 10.3390/plants14030321. Plants (Basel). 2025. PMID: 39942885 Free PMC article. Review.
Cited by
-
Genetic Diversity and Interpopulation Variability of the Hong Kong Newt (Paramesotriton hongkongensis) in an Urbanized and Deforested Landscape.Ecol Evol. 2025 Apr 7;15(4):e70849. doi: 10.1002/ece3.70849. eCollection 2025 Apr. Ecol Evol. 2025. PMID: 40196406 Free PMC article.
-
Chromosome-level haplotype-resolved genome of the tropical loach (Oreonectes platycephalus).Sci Data. 2025 Jan 7;12(1):29. doi: 10.1038/s41597-024-04301-0. Sci Data. 2025. PMID: 39774106 Free PMC article.
References
-
- Bell G (2017) Evolutionary rescue. Annu Rev Ecol Evol Syst 48:605–62710.1146/annurev-ecolsys-110316-023011 - DOI
MeSH terms
Grants and funding
LinkOut - more resources
Full Text Sources
Research Materials
Miscellaneous
