. 2024 Jul 3;7(1):806.
doi: 10.1038/s42003-024-06447-4.

Direct and indirect pathways for heterosynaptic interaction underlying developmental synapse elimination in the mouse cerebellum

Affiliations

Direct and indirect pathways for heterosynaptic interaction underlying developmental synapse elimination in the mouse cerebellum

Hisako Nakayama et al. Commun Biol. .

Abstract

Developmental synapse elimination is crucial for shaping mature neural circuits. In the neonatal mouse cerebellum, Purkinje cells (PCs) receive excitatory synaptic inputs from multiple climbing fibers (CFs) and synapses from all but one CF are eliminated by around postnatal day 20. Heterosynaptic interaction between CFs and parallel fibers (PFs), the axons of cerebellar granule cells (GCs) forming excitatory synapses onto PCs and molecular layer interneurons (MLIs), is crucial for CF synapse elimination. However, mechanisms for this heterosynaptic interaction are largely unknown. Here we show that deletion of AMPA-type glutamate receptor functions in GCs impairs CF synapse elimination mediated by metabotropic glutamate receptor 1 (mGlu1) signaling in PCs. Furthermore, CF synapse elimination is impaired by deleting NMDA-type glutamate receptors from MLIs. We propose that PF activity is crucial for CF synapse elimination by directly activating mGlu1 in PCs and indirectly enhancing the inhibition of PCs through activating NMDA receptors in MLIs.


Conflict of interest statement

The authors declare no competing interests.

Figures
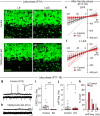
Fig. 1
Fig. 1. Deficient AMPAR-mediated EPSCs in GCs in lobules 8-9 but not in lobules 1-4/5 of TARPγ2-GC KO mice during the late phase of CF elimination.
ad Immunohistochemistry for the AMPA receptor subunit GluA2 in lobule 9 (a and b) and lobule 4/5 (c and d) of the cerebellum from a control (a and c) and a TARPγ2-GC-KO (b and d) mouse at P14. Scale bar, 20 μm. e, f Instantaneous I–V relationships of the AMPA (10 μM)-induced current evoked in GCs in lobules 8-9 (e) and lobules 1-4/5 (f) of the cerebellum from control (white symbols with bold black line, n = 7 for e and n = 6 for f) and TARPγ2-GC KO (red symbols with red bold line, n = 6 for both e and f) mice at P17–P19. Data from individual cells are shown with faint lines. Data are mean ± SEM. g, h Sample traces of in vivo whole-cell recordings from GCs in lobules 8/9 of a control mouse at P13 (g) and a TARPγ2-GC KO mouse at P12 (h). Membrane potentials (upper traces) were recorded under the current clamp mode at a resting membrane potential of − 50 mV. Membrane currents (lower traces) were recorded under voltage-clamp mode at a holding potential of − 60 mV. The Inset trace in (g) represents an average of spontaneous EPSCs. Scale bars, 40 mV and 5 s (upper traces), 5 pA and 100 ms (lower traces), 2 pA and 10 ms (inset). ik Total absence of spontaneous EPSCs and slightly reduced spontaneous firing frequency in GCs in vivo sampled in lobules 8/9 of TARPγ2-GC KO mice. Summary bar graphs showing the mean frequency of spontaneous EPSCs (i), the mean frequency of spontaneous action potentials (j), and the frequency distribution of GCs in terms of spontaneous firing frequency (k) in control and TARPγ2-GC KO mice at P11–P18. *P < 0.05, ***P < 0.001, Mann-Whitney U test. Data in I and j are mean ± SEM.
Fig. 2
Fig. 2. Persistent multiple CF innervation of PCs in lobules 8-9 but not in lobules 1-4/5 of adolescent TARPγ2-GC-KO mice.
ad Sample CF-EPSC traces (a, c) and frequency distribution histograms of PCs in terms of the number of discrete CF-EPSC steps (b, d) for control (open columns) and TARPγ2-GC-KO (filled columns) mice aged P21–P40. Holding potentials for (a, c), − 10 mV. Scale bars for (a, c), 10 ms, and 0.5 nA. ***P < 0.001, Mann-Whitney U test. el Triple immunofluorescence labeling for the PC marker calbindin (blue or gray), anterogradely-labeled (DA488-positive) CFs (red), and the CF terminal marker VGluT2 (green) in lobule 8 (eh) and lobule 4/5 (il) of a control (e, f1, f2, i, j1, j2) and a TARPγ2-GC-KO (g, h1, h2, k, l1, l2) mouse at 3 weeks of age. Boxed regions in e, g, i, and k are enlarged in f1 and f2, h1 and h2, j1 and j2, and l1 and l2, respectively. Arrows in h1 and h2 indicate anterogradely unlabeled (DA488-negative) VGluT2-positive CF terminals. Scale bars: e, 20 μm; f1, 5 μm.
Fig. 3
Fig. 3. Enhanced CF translocation and impaired elimination of somatic CF synapses in lobules 8-9 but not in lobules 1-4/5 of adult TARPγ2-GC-KO mice.
ad Double immunostaining for VGluT2 (red) and calbindin (green) (a1, b1c1d1) and single immunostaining of VGluT2 (a2b2, c2d2) in lobule 9 (a, b) and lobule 4/5 (c, d) from a control (a, c) and a TARPγ2-GC-KO (b, d) mouse at 8 weeks of age. Dotted lines indicate the pial surface. Boxed regions in (a1, b1, c1, d1) are enlarged as insets in individual figure panels. Scale bars in (c1) and (d1), 20 μm for the lower magnification images and 5 μm for the higher magnification images. e, f Summary violin plots for the relative height of the tip of VGluT2-positive CF terminals (e), representing the shortest distance from the middle of the PC layer to the distal tip of the VGluT2-positive puncta divided by the molecular layer thickness. n = 282 and 333 in lobules 8-9 and1-4/5, respectively, from 3 control mice; n = 264 and 348 in lobules 8-9 and1-4/5, respectively, from 3 TARPγ2-GC-KO mice) and the number of VGluT2-positive CF terminals around the PC soma (f, representing the number of VGluT2-positive CF terminals per 10 μm length of the PC somatic membrane. n = 120 and 132 in lobules 8-9 and 1-4/5, respectively, from 3 control mice; n = 126 and 137 in lobules 8-9 and1-4/5, respectively, from 3 TARPγ2-GC-KO mice) in lobules 8-9 and lobules 1-4/5 from control (open plots) and TARPγ2-GC-KO (filled plots) mice at 8 weeks of age. The dashed line within each violin plot represents the median, while the solid lines at the top and bottom indicate the 75th and 25th percentiles, respectively. *P < 0.05, ***P < 0.001, t test.
Fig. 4
Fig. 4. Impairment of the late phase of CF elimination mediated by mGlu1 in PCs in cerebellar lobules 8-9 of TARPγ2-GC-KO mice.
ad Developmental changes in CF innervation. Frequency distribution histograms of PCs in terms of the number of discrete CF-EPSC steps during P6–P8 (a), P10–P12 (b), P13–P15 (c), and P16–P18 (d) in cerebellar lobules 8-9 from control (white columns) and TARPγ2-GC-KO (red columns) mice. *P < 0.05, Mann-Whitney U test. e, f CF innervation in adult PCs. Frequency distribution histograms of PCs in terms of the number of discrete CF-EPSC steps during P60-P80 in cerebellar lobules 8-9 (e) and 1-4/5 (f) from control (white columns) and TARPγ2-GC-KO (red columns) mice. ***P < 0.001, Mann-Whitney U test. gj Occlusion of impaired CF synapse elimination by mGlu1 knockdown in PCs of TARPγ2-GC-KO mice. Sample CF-EPSC traces (g, i) and frequency distribution histograms in terms of the number of discrete CF-EPSC steps (h, j) for mGlu1 knockdown in PCs of control mice aged P21 to P37 (g, h) and TARPγ2-GC-KO aged P22 to P34 (i, j). Holding potentials for (g, i), − 10 mV. Scale bars for g, i, 10 ms, and 0.5 nA. *P < 0.05, Mann-Whitney U test.
Fig. 5
Fig. 5. NMDARs in GCs are dispensable for CF synapse elimination.
af Immunohistochemistry for the NMDAR subunit GluN1 and Neuro Trace Green (NTG) in a control (a, b, c1, c2) and a GluN1-GC-KO (d, e, f1, f2) mouse at P40. Boxed regions in (a) and (d) are enlarged in (b) and (e), respectively. Scale bar: 1000 μm for (a) and (d), 500 μm for (b) and (e), 20 μm for (c1) and (f1). g, h Sample traces (g) and a summary bar graph showing the ratio of the NMDAR component over the AMPAR component (h) of EPSCs recorded from GCs by stimulating MFs at a holding potential of − 70 mV and + 40 mV in cerebellar lobules 8-9 of control and GluN1-GC-KO mice. The amplitude of the AMPAR component and that of the NMDAR component were measured at the peak of EPSC with a holding potential of − 70 mV and at 20 ms after the stimulus with a holding potential of + 40 mV, respectively. ***P < 0.001, Mann-Whitney U test. Data in (h) are mean ± SEM. in Normal CF synapse elimination in GluN1-GC-KO mice. Sample CF-EPSC traces from PCs in lobules 8-9 (i, l) and frequency distribution histograms in terms of the number of discrete CF-EPSC steps in lobules 8-9 (j, m) and lobules 1-4/5 (k, n) of control (white columns) and GluN1-GC-KO (dark blue columns) mice aged P29 to P46 (ik) and P17 to P18 (ln).
Fig. 6
Fig. 6. NMDA receptors in MLIs are involved in CF synapse elimination.
a, b Impaired CF synapse elimination in GluN1-MLI/PC-KO mice aged P30 to P50. Sample CF-EPSC traces (a) and frequency distribution histograms in terms of the number of discrete CF-EPSC steps (b) in control (white columns) and GluN1-MLI/PC-KO (green columns) mice. Holding potential, − 10 mV. Scale bars, 10 ms and 0.5 nA. *P < 0.05, Mann-Whitney U test. c, d Developmental changes in CF innervation. Frequency distribution histograms of PCs in terms of the number of discrete CF-EPSC steps during P11−P13 (c), and P15−P18 (d) in control (white columns) and GluN1-MLI/PC-KO (green columns) mice. *P < 0.05, Mann-Whitney U test. e, f Triple immunofluorescence labeling for calbindin (blue or gray), anterogradely labeled (DA488-positive) CFs (red), and VGluT2 (green) in a control mouse at P30. Scale bar: 20 μm for (e), 5 μm for (f). g, h Triple immunofluorescence labeling similar to (e) and (f) but for data from a GluN1-MLI/PC-KO mouse. i, j Triple immunofluorescence labeling similar to (g) and (h) but for data from another GluN1-MLI/PC-KO mouse. Arrows in (h) and (j) indicate anterogradely unlabeled (DA488-negative) VGluT2-positive CF terminals on PCs.

Similar articles

Cited by

References

    1. Hensch TK. Critical period regulation. Annu Rev Neurosci. 2004;27:549–579. doi: 10.1146/annurev.neuro.27.070203.144327. - DOI - PubMed
    1. Katz LC, Shatz CJ. Synaptic activity and the construction of cortical circuits. Science. 1996;274:1133–1138. doi: 10.1126/science.274.5290.1133. - DOI - PubMed
    1. Lichtman JW, Colman H. Synapse elimination and indelible memory. Neuron. 2000;25:269–278. doi: 10.1016/S0896-6273(00)80893-4. - DOI - PubMed
    1. Kano M, Hashimoto K. Synapse elimination in the central nervous system. Curr Opin Neurobiol. 2009;19:154–161. doi: 10.1016/j.conb.2009.05.002. - DOI - PubMed
    1. Crepel F. Regression of functional synapses in the immature mammalian cerebellum. Trends Neurosci. 1982;5:266–269. doi: 10.1016/0166-2236(82)90168-0. - DOI

Publication types

Substances