. 2024 Aug;632(8024):366-374.
doi: 10.1038/s41586-024-07632-5. Epub 2024 Jul 3.

The cortical amygdala consolidates a socially transmitted long-term memory

Affiliations

The cortical amygdala consolidates a socially transmitted long-term memory

Zhihui Liu et al. Nature. 2024 Aug.

Abstract

Social communication guides decision-making, which is essential for survival. Social transmission of food preference (STFP) is an ecologically relevant memory paradigm in which an animal learns a desirable food odour from another animal in a social context, creating a long-term memory1,2. How food-preference memory is acquired, consolidated and stored is unclear. Here we show that the posteromedial nucleus of the cortical amygdala (COApm) serves as a computational centre in long-term STFP memory consolidation by integrating social and sensory olfactory inputs. Blocking synaptic signalling by the COApm-based circuit selectively abolished STFP memory consolidation without impairing memory acquisition, storage or recall. COApm-mediated STFP memory consolidation depends on synaptic inputs from the accessory olfactory bulb and on synaptic outputs to the anterior olfactory nucleus. STFP memory consolidation requires protein synthesis, suggesting a gene-expression mechanism. Deep single-cell and spatially resolved transcriptomics revealed robust but distinct gene-expression signatures induced by STFP memory formation in the COApm that are consistent with synapse restructuring. Our data thus define a neural circuit for the consolidation of a socially communicated long-term memory, thereby mechanistically distinguishing protein-synthesis-dependent memory consolidation from memory acquisition, storage or retrieval.


Conflict of interest statement

The authors declare no competing interests.

Figures

Fig. 1
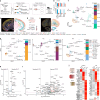
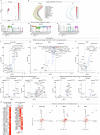
Fig. 1. STFP selectively activates neurons in the COApm that form synaptic connections with the AOB.
a, Innate food preference (n = 15 mice, P = 0.0043, two-tailed Wilcoxon signed-rank test). b, STFP training (n = 11 mice, t10 = 2.464, P = 0.0335, two-tailed paired Student’s t-test). Dem., demonstrator. c, Retrograde tracing showing that COApm neurons project to the AOB (left, schematics; middle, representative image (scale bar, 1 mm); right, percentage of AOB-projecting neurons in the ipsi- and contralateral COApm (n = 3 mice; F3,8 = 523.7, P = 1.6 × 10−9; one-way ANOVA with post-hoc Tukey test; statistical details are reported in Supplementary Table 6). AP, anterior/posterior to bregma; vHip, ventral hippocampus. df, AOB-projecting COApm neurons receive excitatory inputs from the AOB. d, Schematic of experimental strategy. e, Sample traces (left) and amplitude (right) of monosynaptic currents (layer 2 (L2): tdT+, n = 17, tdT, n = 13; layer 3 (L3): tdT+, n = 15, tdT, n = 20, cells; P = 4.1 × 10−9, Kruskal–Wallis with post-hoc two-stage linear step-up test, adjusted P value). PSCs, postsynaptic currents. f, Optogenetic COApm current inhibition by 6-cyano-7-nitroquinoxaline-2,3-dione (CNQX), D-(-)-2-amino-5-phosphonopentanoic acid (APV) and picrotoxin (PTX) (n = 9 cells, for PTX + CNQX + APV versus PTX, P = 0.0039, two-tailed Wilcoxon signed-rank test). gj, AOB-projecting COApm neurons are selectively activated during long-term STFP memory consolidation. g, Schematic of experimental strategy for labelling STFP-training-activated COApm neurons using FOS expression. i.p., intraperitoneal; TAM, tamoxifen. h, Representative COApm images (red, TRAPed cells; green, retrogradely labelled COApm–AOB projection neurons). Scale bar, 200 μm. i,j, Quantification of activated ‘TRAPed’ cell densities in layers 2 (i) or 3 (j) of all images acquired (left, all neurons; right, AOB-projecting and AOB-nonprojecting neurons) (gj: home cage n = 3, conspecific n = 4, food choice n = 3, STFP failed n = 6, STFP success n = 5 mice; i left, F4,16 = 3.567, P = 0.0291; j left, F4,16 = 6.114, P = 0.0035, one-way ANOVA with post-hoc Tukey test; i right, F4,32 = 6.337, P = 7.1 × 10−4; j right F4,32 = 8.749, P = 6.9 × 10−5; i,j right, two-way ANOVA with post-hoc Tukey test). All data are mean ± s.e.m. For detailed statistics, see Supplementary Tables 5 and 6; #, *P < 0.05; ##, **P < 0.01; ***P < 0.001. Source Data
Fig. 2
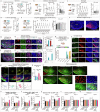
Fig. 2. Silencing of COApm or OFC neurons, but not of BLA, ventral hippocampus or mPFC neurons, blocks long-term STFP memory formation.
All panels analyse the effects of the indicated manipulations on STFP memory formation, with af depicting the experimental strategy on the left and summary graphs on the right and gj following the same strategy as b. a,b, TeNT silencing of the COApm three weeks before (a) or one day after (b) training (a, GFP, n = 22, TeNT, n = 15; middle, P = 0.0012; right, P = 5.4 × 10−5; b, GFP, n = 10, TeNT, n = 8; middle, t7 = 4.374, P = 0.0033; right, t16 = 4.626, P = 2.8 × 10−4). c,d, TeNT silencing of AOB-projecting (c), but not of AOB-nonprojecting (d) COApm neurons impairs long-term STFP memory (c, GFP, n = 11, TeNT, n = 15, middle, P = 4.3 × 10−4, right, P = 0.0090; d, GFP, n = 15, TeNT, n = 11). e,f, TeNT silencing of AOB neurons projecting to the COApm instituted three weeks before (e) or 1 day after (f) STFP training (e, GFP, n = 10, TeNT, n = 9; e middle, P = 0.0195; e right, t17 = 3.447, P = 0.0031; f, GFP, n = 9; TeNT, n = 7). gj, TeNT silencing one day after STFP training in the OFC (g), ventral hippocampus (h), BLA (i) or mPFC (j) (g, GFP n = 7, TeNT n = 8, left, t7 = 4.774, P = 0.0020, right, P = 0.0012; h, GFP n = 14, TeNT n = 10; i, GFP n = 9, TeNT n = 8; j, GFP n = 10, TeNT n = 8). Data are mean ± s.e.m. Statistics: two-tailed paired Student’s t-test: b,f,g,i (middle-TeNT); two-tailed unpaired Student’s t-test: b,e,i (right); two-tailed Wilcoxon signed-rank test: a,c,d,e,h,j (middle), b,f,i (middle-GFP); two-sided Mann–Whitney test: a,c,d,f,g,h,j (right), with #, *P < 0.05; ##, **P < 0.01; ###, ***P < 0.001. For detailed statistics, see Supplementary Tables 5 and 6. Source Data
Fig. 3
Fig. 3. AOB-projecting COApm neurons mediate long-term STFP memory consolidation through protein synthesis.
ac, Experimental chemogenetics approach for silencing of COApm AOB-projecting neurons. a, Injection strategy. b, Timeline (letters refer to panels dg). c, Representative sagittal AOB (left) and coronal (right) brain sections (red, Cre-tdTomato expressed via retro-AAVs injected into the AOB; green, DIO-hM4Di-GFP in the COApm and transported to AOB axon terminals). AOBgr, AOB granule cells; AOBmi, AOB mitral cells. Scale bars, 0.5 mm (left); 1 mm (right). dg, Effect of temporally controlled chemogenetic suppression of COApm neuron activity. CNO was administered for the entire three weeks (d), 40 min before test (e), during the third week (f) or during the first week (g) (d, CNO-GFP, n = 12 mice; CNO-hM4Di, n = 9; saline-GFP, n = 10; saline-hM4Di, n = 7; F3,34 = 6.985, P = 8.7 × 10−4; e, CNO-GFP, n = 9; CNO-hM4Di, n = 10; saline-GFP, n = 7; saline-hM4Di, n = 8; f, CNO-GFP, n = 11; CNO-hM4Di, n = 8; saline-GFP, n = 10; saline-hM4Di, n = 8; g, CNO-GFP, n = 10; CNO-hM4Di, n = 8; saline-GFP, n = 10; saline-hM4Di, n = 7; F3,31 = 9.772, P = 1.1 × 10−4). h,i, Effect of anisomycin (ANI) administered into the COApm (h) or OFC (i) immediately (immed.) after STFP training (day 0). Left, experimental design; middle, percentage of cinnamon-flavoured food eaten on day 0 and after 3 weeks; right, memory retention indices (h, saline n = 9, ANI n = 10, middle, t9 = 3.888, P = 0.0037; right, t17 = 3.002, P = 0.0080; i, saline n = 9, ANI n = 8, middle, P = 0.0078, right, t15 = 5.486, P = 6.3 × 10−5). Data are mean ± s.e.m. Statistics: two-tailed paired Student’s t-test: h (middle), i (middle-saline); two-tailed unpaired Student’s t-test: h,i (right); two-tailed Wilcoxon signed-rank test: i (middle-ANI); one-way ANOVA with Tukey post-hoc test: d,g; Kruskal–Wallis with post-hoc two-stage linear step-up test: e,f. #, *P < 0.05; ##, **P < 0.01; ###, ***P < 0.001. For detailed statistics, see Supplementary Tables 5 and 6. Source Data
Fig. 4
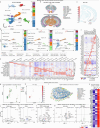
Fig. 4. Spatially resolved transcriptomics reveals neuronal composition and STFP-training-induced changes in gene expression in the COApm, ventral hippocampus and OFC.
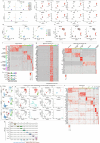
a, Experimental strategy. For analyses of the COApm and the ventral hippocampus, AOB-projecting neurons were labelled by injecting the AOB with AAV2retro-hSyn-tdTomato two weeks before STFP training, whereas analyses of the OFC were performed using uninjected wild-type (WT) mice (n = 4 mice per group). b, AOB-projecting (tdT+) neuron density in the COApm and ventral hippocampus quantified by MERFISH (4 mice per group; mean ± s.e.m.). ce, Spatial representations of neuronal markers and cell-type identification in brain sections containing the COApm and ventral hippocampus (c,d) or the OFC (e) (c,e, left, MERFISH fluorescent images (dark background); right, neuron types (white background); d, top, magnified COApm image (from c); bottom, spatial localization of tdT+ neurons in the COApm). Scale bars, 1 mm (c); 0.2 mm (d); 0.5 mm (e). f,g, Unbiased clustering of all neurons (n = 978,574; f) or separately of COApm, ventral hippocampus and OFC neurons (g) in a uniform manifold approximation and projection (UMAP) format with cell cluster percentages on the right. h,i, Volcano plots showing DEGs in comparisons of AOB-projecting (tdT+) versus AOB-nonprojecting (tdT) COApm neurons in the STFP training group (h) or in comparisons of AOB-projecting COApm neurons in STFP training versus odour groups (i) (false discovery rate (FDR) < 1 × 10−10 by the Benjamini–Hochberg method; fold change (FC) > ±0.5). j, Schematic (left) and heat map of enriched genes (right) detected in excitatory AOB-projecting (tdT+) neurons in the COApm (left) and ventral hippocampus (right). Genes related to synapse formation are in bold.
Fig. 5
Fig. 5. Deep scRNA-seq reveals that STFP training induces marked changes in gene expression in COApm neurons.
a, Experimental strategy. b, Unbiased clustering shown in UMAP plots of scRNA-seq transcriptomes of COApm neurons. c, COApm neuron subtypes are identified by distinct marker genes, with expression of tdTomato highly enriched in cluster 1. d, Volcano plots showing DEGs detected in the STFP-trained mouse group in comparisons of AOB-projecting (tdT+) and nonprojecting (tdT) excitatory neurons (cluster 1) of the COApm (FDR < 1 × 10−2 by the Benjamini–Hochberg method). e, Top upregulated DEGs (ranked by P value) in AOB-projecting (tdT+) neurons. f, STFP memory-specific DEGs. Left, computation strategy; right, heat map of identified STFP-specific DEGs in the home cage, odour and STFP-training groups (see Supplementary Table 4 for details). Genes related to synapse formation are in bold.
Fig. 6
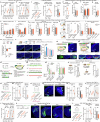
Fig. 6. Projections from the COApm to the AONm mediate the transfer of memories consolidated in the COApm.
a, TeNT silencing of AONm neurons that receive synaptic inputs from the COApm, one day after STFP training. Left, experimental approach; middle, percentage of cinnamon-flavoured food eaten on day 0 and after 3 weeks (P = 0.0234, two-tailed Wilcoxon signed-rank test); right, memory retention indices (P = 0.0464, two-tailed Mann–Whitney test) (with GFP, n = 9; TeNT, n = 8 mice). b, Chemogenetic inhibition of COApm projections to the AONm during the first week after STFP training impairs STFP memory (CNO-GFP, n = 17; CNO-hM4Di, n = 9; saline-GFP, n = 15, saline-hM4Di, n = 9; F3,46 = 3.995, P = 0.0131, one-way ANOVA with Tukey post-hoc test). c, Summary diagram of the central role of the COApm and its interactions with various brain regions in STFP memory consolidation. Left, schematic of brain circuits; right, information flow during STFP consolidation. LEC, lateral entorhinal cortex. Pir, piriform cortex. Brain map based on reference coordinates from the Allen Mouse Brain Reference Map, Allen Institute for Brain Science (http://atlas.brain-map.org/). Data in a,b are mean ± s.e.m. For details of statistics, see Supplementary Tables 5 and 6. #, *P < 0.05, **P < 0.01. Source Data
Extended Data Fig. 1
Extended Data Fig. 1. Further characterizations of long-term STFP memory, and description of AOB-projecting neurons in the COApm and TRAP2 mapping of STFP-training-activated neurons in the COApm.
a, CD1 mice exhibit the same innate food preference as C57BL/6 J mice for cocoa over cinnamon (left) and this innate food preference is similarly reversed by STFP training (right) as shown in Fig. 1a,b for C57BL/6 J mice (for each section, experimental strategies are shown on the left and summary graphs of food consumption on the right [left, innate food-preference measurements, n = 14, t13 = 3.825, p = 0.0021; right, STFP measurements, n = 15, t14 = 3.680, p = 0.0025, two-tailed paired Student t-test]). b,c. Exposure of C57BL/6 J mice to cinnamon odour alone (b) or to a cinnamon-scented fake mouse (c) does not alter their innate preference for cocoa over cinnamon different from STFP (left, experimental design; middle and right, percentage of cocoa vs. cinnamon food eaten (middle) or of cinnamon food eaten (right) at different time points [b, n = 17, 3 weeks, p = 0.0110; 9 weeks, p = 0.0063; c, n = 9, day 0, p = 0.0117, two-tailed Wilcoxon signed-rank test]). d, Long-term STFP memory is sustained beyond 3 weeks after a one-trial STFP training session in C57BL/6 J mice even when memory acquisition is not tested on day 0 after STFP training (left, experimental design; right, percentage of food eaten at the 3-week test [n = 10, p = 0.0488, two-tailed Wilcoxon signed-rank test]). e, Long-term STFP memory is sustained for at least 45 weeks after a single STFP training session as revealed by retesting the same cohort of mice over a 3-45 week period (left, experimental design; middle and right, percentage of cocoa vs. cinnamon food eaten (middle) or of cinnamon food eaten (right) at different time points [n = 9; day 0, t8 = 2.718, p = 0.0263, two-tailed paired Student t-test; 6 weeks, p = 0.0117; 9 weeks, p = 0.0273; 15 weeks, p = 0.0273; 30 weeks, p = 0.0391, two-tailed Wilcoxon signed-rank test]). f, Expanded representative images of the COApm after unilateral retrograde labelling of COApm neurons using retro-AAVs injected into the AOB (from the boxed areas of Fig. 1c, n = 3 mice). gl, Immunohistochemical staining of COApm neurons using antibodies to glutamate (g-i) or GABA (j-l) demonstrates that all AOB-projecting COApm neurons are glutamatergic and that only a minority of layer-2 neurons but a majority of layer-3 neurons project to the AOB. AOB-projecting neurons in the COApm were retrogradely labelled by stereotactically infecting the AOB of Ai75 reporter mice with AAV2retro-Cre (g,h,j,k, representative images of stained COApm sections [scale bars apply to all images of a set]; i,l, percentage of glutamate- (i) and GABA- positive neurons (l) in AOB-projecting tdT+ and AOB-nonprojecting tdT- neurons in layers 2 and 3 [i, F3,8 = 63.5, p = 6.4 × 10−6, one-way ANOVA with Tukey post-hoc test; l, p = 0.0006, Kruskal–Wallis with post-hoc Two-stage linear step-up test]; n = 3 mice). mo, Cell-type tracing of AOB-projecting neurons of the COApm using defined Cre-driver mouse lines demonstrates that AOB-projecting neurons of the COApm are glutamatergic vGluT2- and CAMKII-expressing neurons, whereas vGAT-, SST- and PV-expressing, presumptively GABAergic, neurons are not labelled (m, experimental strategy whereby the AOB of various Cre-driver lines was injected with retro-AAVs encoding tdTomato in the absence and GFP in the presence of Cre to selectively label AOB-projecting neurons with GFP; n, quantifications of GFP-positive cells as per cent of total labelled cells [sum of GFP- and tdTomato-positive cells]; o, representative images of COApm sections [n = 3 mice for each group]). p, Representative images of COApm sections (top) with reconstructed neurons filled with biocytin to map the local dendrites of neurons. Layer 2 tdT+ n = 7, layer 2 tdT- n = 6, layer 3 tdT+ n = 6, layer 3 tdT- n = 3, cells. q, Summary graphs of the neuronal capacitance corresponding to the layer-2 and layer-3 tdT+ and tdT- neurons recorded in Fig. 1e (p = 8.03 × 10−5, Kruskal–Wallis with post-hoc Two-stage linear step-up test) (layer 2: tdT+ , n = 17, tdT-, n = 13; layer 3: tdT+, n = 15, tdT-, n = 20, cells). Note that only AOB-projecting tdT+ layer-3 neurons that constitute the vast majority of the AOB-projecting neurons of the COApm exhibit an intrinsically higher capacity, suggesting a larger size. rv, Further characterization of TRAP2 mapping of activated COApm neurons in Fig. 1h–j, confirming that only STFP training but not odour by itself or the home cage activates COApm neurons (r, merged representative images of TRAPed cells (tdT+ , red) and EGFP (green) in COApm sections (top) and expanded single-colour views of sections from STFP-trained mice (bottom), complementing Fig. 1h; sv, cell density quantifications of layers 2 and 3 of the COApm, with graphs showing the absolute (s) and GFP-normalized (t) density of cells co-labelled for GFP+ and tdT+ [s, layer 2, F4,16 = 3.733, p = 0.0249; layer 3, F4,16 = 6.430, p = 0.0028; t, layer 2, p = 0.0392 (Kruskal–Wallis with post-hoc Two-stage linear step-up test), layer 3, F4,16 = 4.517, p = 0.0124], or showing the density of tdT+ cells lacking GFP (u) [layer 3, F4,16 = 4.688, p = 0.0107], or showing the total density of GFP+ cells (v)). One-way ANOVA with post-hoc Tukey test except for t layer 2. w, The total area of layers 2 and 3 of the mouse COApm does not change after odour exposure or STFP training. For s and w, home cage n = 3, conspecific n = 4, food choice n = 3, STFP failed n = 6, STFP success n = 5 mice. Data are means ± s.e.m. For details and statistical comparisons, see Supplementary Tables 5 and 6. *, #p < 0.05, **, ##p < 0.01, ***, ###p < 0.001. Source Data
Extended Data Fig. 2
Extended Data Fig. 2. Experiments including extensive further controls to show that TeNT-induced silencing of COApm neurons specifically and efficiently impairs long-term STFP memory.
a,b, Percentage of food eaten at day 0 and 3 weeks after STFP training (a, AAVs-TeNT-EGFP or EGFP were injected 3 weeks prior to STFP training in Fig. 2a [Day 0 GFP, p = 0.0003; 3 weeks, GFP, t21 = 4.854, p = 8.5 × 10−5, GFP, n = 22, TeNT, n = 15]; b, mice with successful STFP training were injected with the same AAVs one day after STFP training in Fig. 2b [day 0, GFP, p = 0.0020, TeNT, t7 = 7.309, p = 0.0002; 3 weeks, GFP, t9 = 8.721, p = 1.1 × 10−5], GFP, n = 10, TeNT, n = 8). c, TeNT silencing of the COApm after STFP training also blocks long-term STFP memory when using a one-trial test procedure that omits tests of short-term STFP memory acquisition on day 0 (left, experimental strategy; middle, percentage of cocoa- and cinnamon-flavoured food consumed at 3 weeks; right, percentage of cinnamon-flavoured food eaten at 3 weeks in the middle [GFP, n = 14; TeNT, n = 10; middle, cocoa vs. cinnamon, GFP, p = 0.0295; TeNT, n = 0.0645; right, p = 0.0073]). dj, TeNT-induced silencing of the COApm has no effect on innate food preference (d), total food intake (e), body weight (f), buried food finding test (g), olfactory sensitivity (h), contextual fear memory (i) and open field behaviours of mice (j), demonstrating its selectivity for long-term STFP memory formation without altering olfaction (d, n = 12, p = 0.0068; e, GFP, n = 36; TeNT, n = 25; f, GFP, n = 14; TeNT, n = 10; g, GFP, n = 19; TeNT, n = 14; h, GFP, n = 11; TeNT, n = 9; i, GFP, n = 8; TeNT, n = 6; j, GFP, n = 8; TeNT, n = 6). k, TeNT silencing of the COApm does not impair non-associative olfactory memory (left, experimental strategy; middle, anise preference index of naive versus pre-exposed mice does not differ between GFP (p = 0.0181) vs. TeNT groups (p = 0.0137); right, ratio of pre-exposed anise preference index/naive anise preference index [GFP, n = 15; TeNT, n = 10]). l, Quantifications reveal that TeNT silencing of COApm neurons does not alter social behaviours (observers’ sniffing at demonstrators’ muzzle, body, and anogenital areas, observers’ self-grooming, and total fighting bouts between observers and demonstrators as scored during the 30-minute social interaction phase of STFP training [GFP, n = 11; TeNT, n = 10]). m, TeNT-mediated silencing of COApm neurons has no effect on odour preferences using aversive and attractive odour pairs. Aversive odour, 2MB, 2-methylbutyric acid; and attractive odour, 2PE, 2-phenylethanol (GFP, n = 13; TeNT, n = 11). n, COApm neurons are not directly activated by aversive or attractive odours as analysed by FOS immunohistochemistry, whereas COApl neurons fully respond, thus constituting a positive control (top; experimental strategy; bottom left, sample images of the COApl; bottom right, summary graph of FOS+ neurons [COApl, F2,7 = 22.10, p = 9.4 × 10−4; water n = 4, 2MB n = 3, 2PE n = 3, mice]). o, Representative injection site images (right) and schematic of AAV constructs (left) for Fig. 2c,d (o1, Cre-on EGFP & TeNT; o2, Cre-off EGFP & TeNT combined with Cre-on tdT). p, mEPSC recordings in layer 2 of the COApm demonstrate that Cre-off TeNT expression effectively silences non-AOB-projecting neurons. Recordings were performed in AOB-projecting or non-AOB-projecting neurons, both of which receive local synaptic inputs from non-AOB-projecting neurons expressing control proteins or TeNT (p1, experimental strategy; p2, example traces; p3, mEPSC frequency (left) and amplitude (right) summary graphs in the four conditions of p1 and p2 [left, p = 6.4 × 10−7; EGFP only set: GFP+ n = 14/4, tdT+ , n = 15/4; EGFP-TeNT set: GFP+ , n = 11/3, tdT+ , n = 10/4, cells/mice]). qs, Repeat of the experiments in Figs. 1a,b and 2b with a different food odour pair (cumin vs. thyme) demonstrates that C57BL/6 J mice exhibit an innate food preference for thyme (q) that can be reversed by STFP training (r), and that with this food odour pair TeNT-induced silencing of COApm AOB-projecting neurons after STFP training also inactivates long-term STFP memory formation (s). Mice used in s included successfully trained mice in r (q & r: left, experimental strategy; right, summary graph of percentage of food eaten [q, n = 15, p = 1.2 × 10−4; r, n = 11]; s1, injection strategy; s2 left, percentage of cumin-flavoured food eaten; s2 right, memory retention index [GFP, n = 12, TeNT, n = 12, with TeNT in the left graph, p = 9.8 × 10−4; right graph, p = 1.4 ×10⁻⁴]). t, Selective activity-dependent TeNT-induced silencing of COApm neurons using TRAP2 mice severely impairs long-term STFP memory (t1, experimental strategy; t2, injection sites of COApm (top) and their projections to the AOB (bottom); t3, percentage of cinnamon-flavoured food on day 0 and 3 weeks (left) and memory retention index (right) [GFP, n = 14; TeNT, n = 9. t3, left, TeNT, t8 = 5.004, p = 0.0010; right, p = 1.1 × 10−4]). u,v, Percentage of food eaten at day 0 and 3 weeks after STFP training (see Fig. 2e,f) (u, GFP, n = 10, TeNT, n = 9; day 0, GFP, t9 = 2.662, p = 0.0260; 3 weeks, GFP, p = 0.0273. v, GFP, n = 9; TeNT, n = 7; day 0, GFP, p = 0.0039; TeNT, t6 = 5.658, p = 0.0013; 3 weeks, GFP, p = 0.0039; TeNT, t6 = 4.973, p = 0.0025). w, Experimental strategy (left) and example images of injection sites (right) for experiments in Fig. 2g–j. x, TeNT silencing of OFC neurons 7 days after STFP training impairs long-term STFP memory (left, experimental strategy; middle, percentage of cinnamon-flavoured food on day 0 and after 3 weeks; right, memory retention index [GFP, n = 9; TeNT, n = 9. Middle, TeNT, t8 = 4.495, p = 0.0020; right, t16 = 3.527, p = 0.0028]). Data are means ± s.e.m. Statistics: two-tailed paired student t-test: a (3 weeks-GFP), b (day 0-TeNT, 3 weeks-GFP), t3 (left-TeNT), u (day 0-GFP), v (day 0-TeNT, 3 weeks-TeNT), x (middle-TeNT); two-tailed unpaired student t-test: x (right); two-tailed Wilcoxon signed-rank test: a (day 0-GFP), b (day 0-GFP), c (middle), d, k, q, s2 (left-TeNT), u (3 weeks), v (day 0-GFP, 3 weeks-GFP); two-tailed Mann–Whitney test: c (right), t3 (right), s2 (right); one-way ANOVA with Tukey post-hoc test: n (COApl); Kruskal–Wallis with post-hoc Two-stage linear step-up test: p3 (left-frequency). For details and statistical comparisons, see Supplementary Tables 5 and 6. #, *p < 0.05, ##, **p < 0.01, ###, ***p < 0.001. Source Data
Extended Data Fig. 3
Extended Data Fig. 3. Further experimental data for temporally defined COApm-silencing experiments using chemogenetics and electrophysiological analyses of long-term STFP memory.
a, Validation of the efficacy of chemogenetic silencing of COApm neurons in successfully STFP-trained mice (a1, example traces [green trace = 200 pA current injection]; a2, spike frequency before and after perfusion of 10 μM CNO [n = 12 cells, F1,154 = 196.2, p < 1.0 × 10−15]). b, Summary graphs of the cinnamon-flavoured food consumption in STFP memory tests on day 0 and at 3 weeks during the chemogenetics experiments (corresponds to Fig. 3d–g, b1, CNO-GFP, n = 12 mice; CNO-hM4Di, n = 9; saline-GFP, n = 10, saline-hM4Di, n = 7; b2, CNO-GFP, n = 9; CNO-hM4Di, n = 10; saline-GFP, n = 7, saline-hM4Di, n = 8; b3, CNO-GFP, n = 11; CNO-hM4Di, n = 8; saline-GFP, n = 10, saline-hM4Di, n = 8; b4, CNO-GFP, n = 10; CNO-hM4Di, n = 8; saline-GFP, n = 10, saline-hM4Di, n = 7; [b1, CNO, hM4Di, 3 wk vs. day 0, t8 = 6.927, p = 1.2 × 10−4; b4, CNO, hM4Di, 3 wk vs. day 0, t7 = 4.092, p = 0.0046]). c, Chemogenetic silencing of the COApm has no effect on three-chamber social behaviours (c1, experimental strategy; c2 & c3, summary plots of sociability (c2) and social novelty behaviours (c3), with left and right graphs showing the durations and mean ratios (indices) of interactions [GFP, n = 10; hM4Di, n = 11; c2, left, GFP, t9 = 4.840, p = 9.2 × 10−4; hM4Di, t10 = 2.280, p = 0.0458; c3, left, GFP, t9 = 4.083, p = 0.0027; hM4Di, t10 = 2.953, p = 0.0145]). d, Chemogenetic silencing of AOB-projecting COApm neurons, when applied during the 3 weeks after STFP training but not when applied during the 40 min before the 3-week long-term STFP memory test, also blocks STFP memory formation that is tested with the cumin vs. thyme food odour pair different from the cinnamon vs. cocoa food odour pair used in analogous experiments in Fig. 3 (d1, experiment strategy; d2 & d3 left, percentage of cumin food consumed on day 0 and after 3 weeks; d2 & d3 right, memory retention indices [d2, GFP, n = 13; hM4Di, n = 16, left, hM4Di, p = 3.1 × 10−5; right, p = 6.0 × 10−5; d3, GFP, n = 10; Gi, n = 9]). e,f, Chemogenetic silencing of AOB-projecting COApm neurons for 24 h (e) or for 48 h (f) after STFP training does not impair recent STFP memory formation (e1 & f1, experimental strategies; e2 & f2 left, percentage of cinnamon food consumed on day 0 and day 1 or 2; e2 & f2 right, memory retention indices [e2, CNO-GFP, n = 8; CNO-hM4Di, n = 11; saline-GFP, n = 12; saline-hM4Di, n = 10, CNO, GFP, day 1 vs. day 0, t7 = 2.474, p = 0.0426; f2, GFP, n = 16; Gi, n = 15]). A saline control was only performed for the 24 h but not the 48 h test since the 24 h chemogenetic inhibition had no effect on recent STFP memory formation. g, Chemogenetic silencing of the ventral hippocampus for 48 h after STFP training significantly impairs recent STFP memory formation (g1, experimental strategy; g2 left, percentage of cinnamon-flavoured food eaten on day 0 and day 2; g2 right, memory retention index [mCh, n = 9; Gi, n = 9; g2 left, hM4Di, t8 = 2.782, p = 0.0239; g2 right, p = 0.0315]). h, Chemogenetic silencing of COApm-derived presynaptic terminals in the AOB, implemented by CNO infusions for 3 weeks after STFP training, doesn’t alter long-term STFP memory formation, thereby confirming TeNT-silencing experiments showing that the AOB is only involved in STFP memory acquisition but not consolidation (h1, experimental strategy; h2, left, percentage of cinnamon-flavoured food eaten; right, memory retention index [GFP, n = 7; hM4Di, n = 9]). i, Experimental strategy for electrophysiological analyses. jl, Successful STFP training does not alter the intrinsic excitability of AOB-projecting COApm neurons at 1–2 days after STFP training (j) but produces a significant shift at 1 week (k) or 3 weeks after STFP training (l) (jl top, example traces; jl bottom left, summary plots of the spike frequency as a function of injected current; jl bottom right, summary graphs of the calculated current required to elicit minimal spiking (I0) [day 1–2, uncued food, n = 20/4, STFP success, n = 23/4; 1 week, uncued food, n = 21/4, STFP success, n = 26/6, STFP failed, n = 21/4; 3 week, uncued food, n = 23/5, STFP success, n = 25/6, STFP failed, n = 15/3, cells/mice; k lower left, F2, 390 = 20.06, p = 5.1 × 10−9, STFP success vs. uncued food p = 8.9 × 10−5, STFP success vs. STFP failed p = 7.2 × 10−9; k lower right, F2, 65 = 4.426, p = 0.0158; l lower left, F2, 360 = 16.84, p = 1.0 × 10−7, STFP success vs. uncued food p = 2.8 × 10−6, STFP success vs. STFP failed p = 7.1 × 10−6; l lower right, F2, 60 = 4.212, p = 0.0194]). mr, Successful STFP training does not alter the resting membrane potential (m), input resistance (n), firing threshold (o), amplitude (p), or after-hyperpolarization amplitude (r) of layer-3 AOB-projecting COApm neurons at 1–2 days, 1 week or 3 weeks after STFP training and does not affect the axon potential rise time (AP dV/dt max) at 1–2 days after STFP training (q left) but modestly increases this parameter at 1 week after STFP training (q middle, F2, 65 = 4.316, p = 0.0174) and decreases it at 3 weeks after STFP training (q right, F2, 60 = 3.040, p = 0.0553) (n’s are the same as in jl, day 1–2, uncued food, n = 20/4, STFP success, n = 23/4; 1 week, uncued food, n = 21/4, STFP success, n = 26/6, STFP failed, n = 21/4; 3 week, uncued food, n = 23/5, STFP success, n = 25/6, STFP failed, n = 15/3, cells/mice; [n, right, F2,60 = 3.114, p = 0.0517; o, left, p = 0.0228]). s, Successful STFP training does not alter the AMPAR/NMDAR ratio (s1) or the rectification index of AMPAR EPSCs (s2) of layer-3 AOB-projecting COApm neurons (s1 left, example traces; s1 right, AMPAR/NMDAR ratio summary graph; s2 left, example traces; s2 right, AMPAR rectification index summary graph [s1, uncued n = 17/4, STFP success n = 17/4; s2, uncued n = 19/4, STFP success n = 17/4, cells/mice]). Data are means ± s.e.m. Statistics: two-tailed paired student t-test: b1 (CNO-hM4Di), b4 (CNO-hM4Di), c2 (left), c3 (left), e2 (CNO-GFP), g2 (left-hM4Di); two-tailed Wilcoxon signed-rank test: d2 (left); two-sided Mann–Whitney test: d2 (right), g2 (right), o (left); one-way ANOVA with Tukey post-hoc test: k and l (lower right), q (middle and right), n (right); two-way ANOVA: a2, k and l (lower left). For details, see Supplementary Tables 5 and 6. #, *p < 0.05, ##, **p < 0.01, ###, ***p < 0.001. Source Data
Extended Data Fig. 4
Extended Data Fig. 4. In-depth MERFISH spatially resolved transcriptomics analysis of cell types and their specific markers and of the gene-expression changes in the COApm after STFP training.
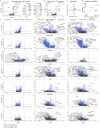
a, Unbiased UMAP clustering of all cells identifies a total of 1.6 million cells in spatially revolved transcriptomic sections (n = 4 mice per experiment). b, Spatial images of all cell types in both coronal sections analysed by MERFISH. c, tdTomato spatial expression pattern reveals selective labelling of the COApm, ventral hippocampus, and entorhinal cortex in the coronal section containing the COApm. Note that the injection of retro-AAVs triggering tdTomato expression into the AOB is likely to involve limited spillover into the adjacent MOB and AON. As a result, the tdTomato labelling of the ventral hippocampus and entorhinal cortex could at least in part be due to MOB and/or AON projections. d, UMAP plots depict unbiased clustering of all cell types in the COApm, ventral hippocampus, and OFC. The bars on the right of the UMAP plots illustrate the cell composition percentages. e,f, Markers for all cell types (e) and all neurons (f) in all three brain regions as determined by MERFISH spatially resolved transcriptomics. g,h, UMAP plots showing that all cell types were consistently found in the COApm in the three experimental groups (home cage, odour, and STFP training) (g) but that tdT+ AOB-projecting COApm neurons are concentrated in the main Otof+ neuron type in the COApm in all three groups (see Fig. 4g, COApm, for the definition of neuron clusters). i, Zoomed-in MERFISH image of the COApm to illustrate cell types, with cell annotations listed on the right. j,k, Volcano plots of DEGs identified in a comparison of excitatory AOB-projecting vs. AOB-nonprojecting (tdT+ vs. tdT-) neurons of the COApm reveal no major changes in home cage (j) or odour (k) conditions in contrast to the STFP condition (see Fig. 4h). For volcano plots, dotted lines indicate an FDR<1e-10 by Benjamini–Hochberg Methodor, and a 0.5 log2 fold change (FC). l, Volcano plots of DEGs identified in a comparison of excitatory tdT+ neurons in the STFP vs. home cage conditions complementing the volcano plot for the STFP vs. odour comparison shown in Fig. 4i. FDR<1e-10, log2FC < 0.5. m,n, Volcano plots of DEGs identified in the comparison of STFP vs. home cage & odour conditions in astrocytes (m) and microglia (n). FDR<1e-5, log2FC < 0.5. o, Expanded heat map for the STFP-condition enriched genes of the COApm shown in Fig. 4j. Genes related to synapse formation are in bold.
Extended Data Fig. 5
Extended Data Fig. 5. Spatially resolved transcriptomics of the ventral hippocampus reveals a unique gene-expression architecture and shows that STFP-training-induced DEGs differ between the COApm and the ventral hippocampus.
a, UMAP plot of all tdT+ AOB-projecting neurons in the ventral hippocampus pooled from home cage, odour, and STFP training groups. b, Image of all cell types in the ventral hippocampus revealed by MERFISH (left) and of the spatial localization of tdT+ cells in the ventral hippocampus (right, red on blue). ce, Expression levels of three neurotransmitter markers (c, Gad1 [GABA synthesis]; d, Slc17a7 [vesicular glutamate transporter vGluT1]; e, Slc17a6 [vesicular glutamate transporter vGluT2]) in the 14 types of neurons in MERFISH analyses of the ventral hippocampus of the pooled groups. fh, Volcano plots uncovering DEGs in a comparison of tdT+ vs. tdT- excitatory neurons of the ventral hippocampus in home cage (f), odour (g), or STFP-trained mouse groups (h). For volcano plots, dotted lines indicate an FDR <1e-10 by Benjamini–Hochberg Method and a 0.5 log2 fold change (FC). i,j, Volcano plots showing DEGs in a comparison of tdT+ excitatory neurons between STFP vs. home cage (i), and STFP vs. odour mouse groups (j). FDR<1e-10, log2(FC) < 0.5. k,l, Volcano plots revealing DEGs in a comparison of STFP vs. home cage & odour in astrocytes (k) and microglia (l). FDR<1e-5, log2(FC) < 0.5. m, Heat maps of enriched genes in the ventral hippocampus. The left heat map shows an expanded analysis of enriched genes in the ventral hippocampus corresponding to the right panel of Fig. 4j, while the right heat map shows the expression of COApm-enriched genes (from the left panel of Fig. 4j) in the ventral hippocampus. np, Scatter plots comparing DEGs identified tdT+ vs. tdT- neurons in the COApm and the ventral hippocampus under home cage (n), odour (o) or STFP (p) conditions.
Extended Data Fig. 6
Extended Data Fig. 6. Spatially resolved transcriptomics identifies major changes in gene expression in the OFC that are driven mainly by odour perception even though the OFC does not receive direct inputs from the olfactory bulb.
ac, Expression levels of three neurotransmitter markers (a, Gad1 [GABA synthesis]; b, Slc17a7 [vesicular glutamate transporter vGluT1]; c, Slc17a6 [vesicular glutamate transporter vGluT2]) in the 14 types of neurons identified in MERFISH spatially resolved transcriptomic analyses of the OFC in the pooled home cage, odour, and STFP-trained groups. df, Volcano plots analysing gene-expression changes in excitatory neurons by comparing odour vs. home cage (d), STFP vs. home cage (e), and STFP vs. odour (f). For these and the following volcano plots, dotted lines indicate an FDR <1e-5 by Benjamini–Hochberg Method and a 0.5 log2 fold change (FC). gi, Same as df but in inhibitory neurons. j, Volcano plots analysing gene-expression changes in astrocytes (top) and microglia (bottom) by comparing STFP training conditions with home cage and odour conditions. k, Heat map of OFC enriched genes in excitatory neurons. l, Heat map illustrating the expression of COApm-enriched genes (same genes as in the left panel of Fig. 4j) in the OFC.
Extended Data Fig. 7
Extended Data Fig. 7. scRNA-seq reveals a unique cellular composition of the COApm that only partly overlaps with that of the PFC neurons, as shown by an integrated analysis.
a, In-depth scRNA-seq of COApm identified six major cell types that are similarly present in all three behavioural conditions analysed (home cage, odour only, and STFP training). b, The expression of Nrxn3, Snap25, Rbfox3, and Syt1 is enriched in all neuron clusters. c, The glia marker Aqp4 is expressed in astrocytes, Oligo2 and Pllp in OPCs, and Ctss in microglia. d, Subclustering of COApm neurons reveals six principal neuronal cell types that are similarly abundant in all three conditions. e, Expression of the excitatory neuron markers Slc17a7 and Slc17a6 is enriched in clusters 1, 2, and 4, whereas expression of the inhibitory neuron marker Gad1 is enriched in clusters 3 and 5. f, Heat map of the distinct marker genes of each neuronal cell type in the COApm. g, Heat map illustrating a specific gene cluster that is selectively enriched in the unusual progenitor-like neuron cluster 2 in the COApm, a neuron type that was not previously identified. h, Violin plots showing that one or more neuronal marker genes (Nrxn3, Snap25, Rbfox3, Syt1) are expressed in the six neuron clusters of the COApm. i, Integrated analysis of PFC and COApm non-neuronal cells reveals six cell clusters. jp, Integrated analysis of neuronal transcriptomes of the COApm and the prefrontal cortex (PFC) reveals nine clusters corresponding to neuronal cell types C’1-C’9 (I.C’1-I.C’9). Four of these neuronal cell types are found in both the COApm and PFC (I.C’1-I.C’3, I.C’7) (j). As a cross preference, C1 cells from COApm were distributed in I.C’1 and I.C’3 (k), C3 cells in I.C’2 (m), and C5 in I.C’7 (o). Three clusters were more abundant in the COApm than the PFC, including I.C’5 (Mroh2a+, corresponding to C2) (m), I.C’8 (Ndnf+, C4) (n), I.C’9 (Mup18, C6) (p). Two neuron types, I.C’4 (Arhgap25+) and I.C’6 (Tshz2+) were enriched in PFC. q,r, Expression levels of distinct cell markers for the nine types of neurons are shown in a violin plot (q) and heat map (r).
Extended Data Fig. 8
Extended Data Fig. 8. Differential gene expression in different neuron subtypes and glial cell types of the COApm compared between home cage, odour and STFP-trained mice uncovers widespread transcriptome changes in three types of neurons and in astrocytes.
ac, Comparison of the gene-expression signature of cluster 1 neurons that project (tdT+) or do not project (tdT-) to the AOB under the home cage (a) or odour (b) conditions, and correlation of the DEGs under these two conditions (c). d, Correlation analysis of MERFISH and scRNA-seq datasets reveals excellent correspondence between the two methods (R2 was calculated by the linear regression model). e, Volcano plots analysing gene-expression changes induced by the three behavioural conditions (home cage, odour, and STFP training) for cluster 1, 2 and 3 neurons uncover widespread STFP-specific changes in AOB-projecting (tdT+) and non-AOB-projecting neurons (tdT-) of cluster 1 and in the neurons of cluster 3, but only few STFP-specific changes in cluster 2. f, Volcano plots analysing gene-expression changes induced by the three behavioural conditions (home cage, odour, and STFP training) in OPCs, microglia, and astrocytes identify major STFP-specific changes only in astrocytes but not in OPCs or microglia. For all volcano plots, dotted lines indicate an FDR<1e-5 by the Benjamini–Hochberg method and a log2 fold change (FC) of 4 or 5.
Extended Data Fig. 9
Extended Data Fig. 9. Retrograde pseudotyped rabies virus tracing of AOB-projecting COApm neurons.
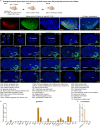
a, Experimental strategy. b, Representative images of starter cells in injection sites, with tdT+ starter cells shown in red. Note that a large fraction of the green GFP+ cells do not overlap with the red starter cells, demonstrating that the COApm contains local synaptic networks. c, Representative image of the contralateral COApm illustrating that a subset of neurons in layer 2 forms synaptic inputs onto the contralateral COApm. dx, Representative coronal sections of brain slices showing retrograde pseudo-rabies virus-labelled inputs into COApm AOB-projecting neurons (green = GFP). Abbreviations designating brain regions are explained below the images, and the positions of the sections are listed in the top right corner of every image. Scale bar in the last image applies to all images in a set. y,z, Quantification of the relative number of synaptic inputs onto AOB-projecting neurons in the COApm from other regions of the entire mouse brain from images acquired from 5 mice. (y) ipsilateral; (z) contralateral. Note that identified multiple ipsilateral brain regions, including the AOB, provide inputs into COApm neurons, consistent with our optogenetic recording results (Fig. 1d–f and Extended Data Fig. 1p,q). In contrast, few contralateral brain regions provide synaptic inputs, including contralateral layer-2 COApm neurons. The results agree with retrograde tracing data obtained using Fluorogold, but extend these data in identifying AOB-projecting COApm neurons as targets. Data are means ± s.e.m. (n = 5 mice). Source Data
Extended Data Fig. 10
Extended Data Fig. 10. Brain-wide mapping of presynaptic projections by COApm neurons to target brain regions using SynaptoTag tracing.
a, Experimental strategy. Three different types of SynaptoTag mapping were performed: mapping all projections from the COApm by standard SynaptoTag; mapping COApm AOB-projecting neurons using Cre-dependent Cre-on SynaptoTag; and mapping only the COApm non-AOB-projecting neurons using Cre-off SynaptoTag. b, Maps of SynaptoTag constructs that co-express mCherry as a cytoplasmic marker allowing tracing of axons with GFP-tagged synaptobrevin-2 as a presynaptic terminal marker. ce, Representative images of SynaptoTag mapping experiments analysing projections of all COApm neurons (c), of only AOB-projecting neurons (d), or of only non-AOB-projecting neurons (e). Injection site images of the COApm are shown on top, and images from different target regions are shown below, with the regions identified by numbers that are explained on the right of the images. Scale bars apply to all images in a set in c and e. In d, scale bar in the AP+1.97 image applies to the rest. f,g, Quantifications of target projections of COApm neurons obtained with the three different SynaptoTag strategies described above, with the intensity of SynaptoTag staining normalized to the injection site signal in the COApm. Regular SynaptoTag, n = 3; Cre-on SynaptoTag, n = 4; Cre-off SynaptoTag, n = 5, mice. For f, F2, 207 = 20.74, p = 6.2 × 10−9; for g, F2, 36 = 31.61, p = 1.2 × 10−8. h, Summary of the inputs and output maps of the COApm as determined by pseudo-rabies virus and SynaptoTag tracing experiments. i,j. Supplementary data for Fig. 6. i, representative image of TeNT expression in the AONm. j, percentage of cinnamon-flavoured food consumed during day 0 and 3-week food-choice test for Fig. 6b, CNO-GFP, n = 17; CNO-hM4Di, n = 9; saline-GFP, n = 15, saline-hM4Di, n = 9. CNO, hM4Di, 3 wk vs. day 0, t8 = 2.739, p = 0.0255. All data are means ± s.e.m. Two-way ANOVA with post-hoc Tukey test was used to detect differences in the SynaptoTag tracings. Data are transformed by taking square root (f) or Ln (g) first to make sure data are normally distributed and have equal variances. *p < 0.05, **p < 0.01, ***p < 0.001. Paired two-tailed student t-test was applied to (j), with #*<0.05, **<0.01, ***<0.001. For details, see Supplementary Tables 5 and 6. Source Data

Similar articles

Cited by

References

    1. Galef, B. G. Jr. Studies of social learning in Norway rats: a brief review. Dev. Psychobiol.15, 279–295 (1982). - PubMed
    1. Wrenn, C. C. Social transmission of food preference in mice. Curr. Protoc. Neurosci.10.1002/0471142301.ns0805gs28 (2004). - PubMed
    1. Jeon, D. et al. Observational fear learning involves affective pain system and Cav1.2 Ca2+ channels in ACC. Nat. Neurosci.13, 482–488 (2010). - PMC - PubMed
    1. Kwon, J. T. et al. An amygdala circuit that suppresses social engagement. Nature593, 114–118 (2021). - PMC - PubMed
    1. Langford, D. J. et al. Social modulation of pain as evidence for empathy in mice. Science312, 1967–1970 (2006). - PubMed