. 2024 Jul;631(8020):386-392.
doi: 10.1038/s41586-024-07626-3. Epub 2024 Jul 3.

Geographical migration and fitness dynamics of Streptococcus pneumoniae

Collaborators, Affiliations

Geographical migration and fitness dynamics of Streptococcus pneumoniae

Sophie Belman et al. Nature. 2024 Jul.

Abstract

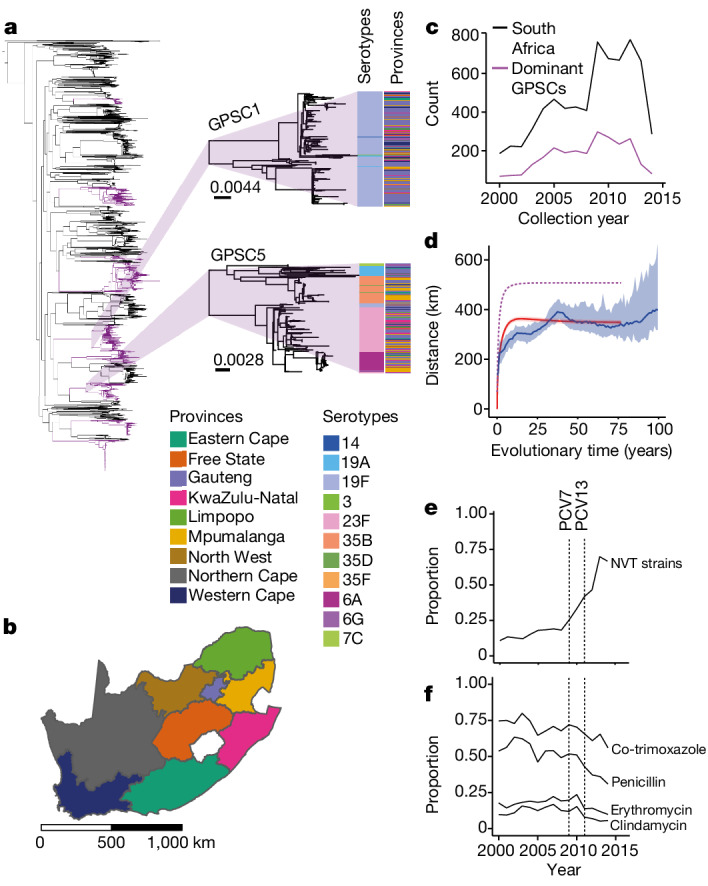
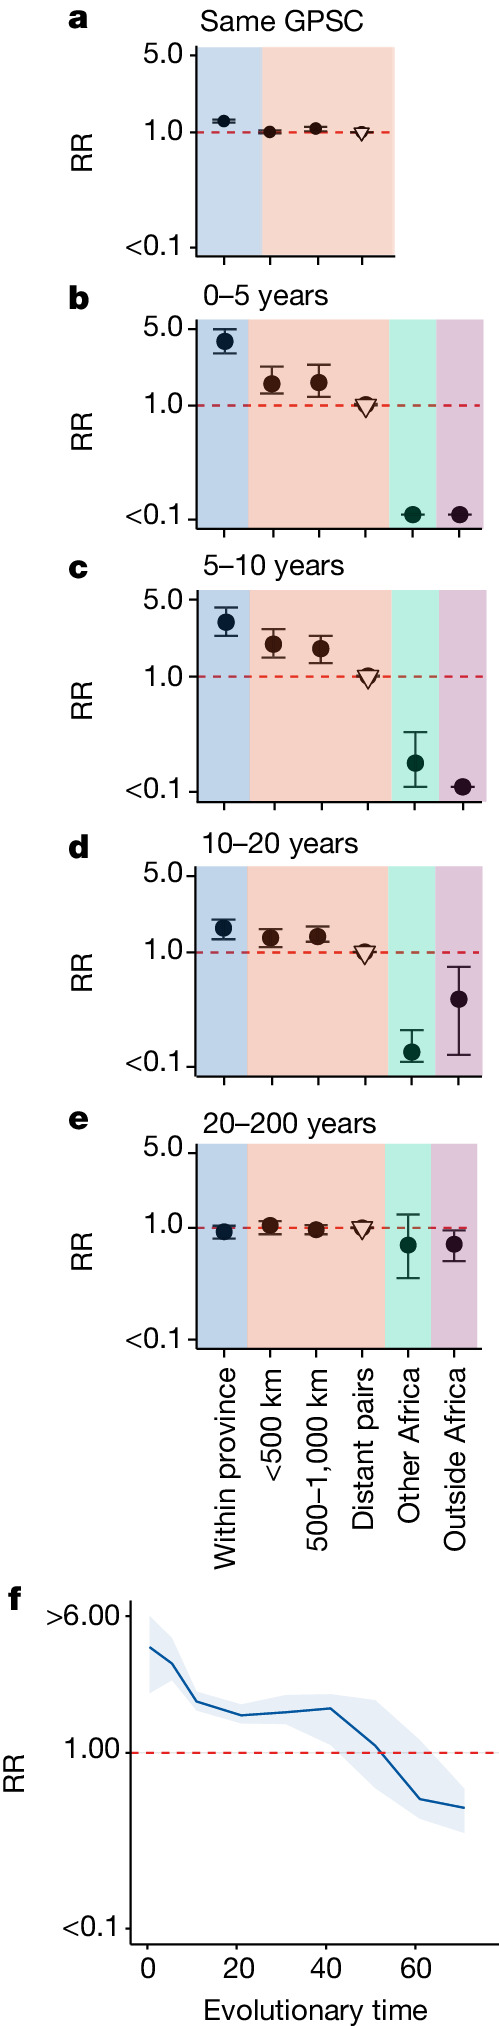
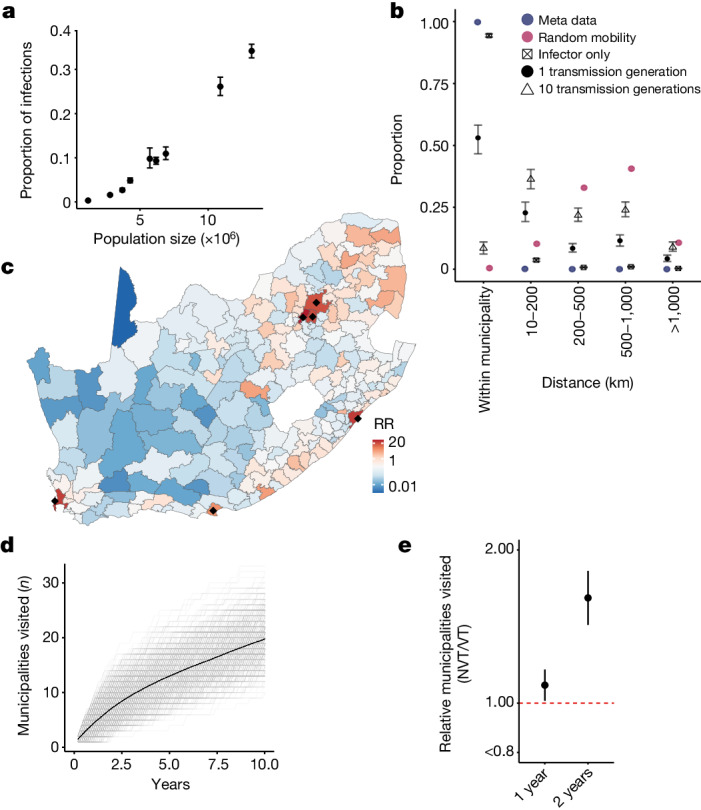
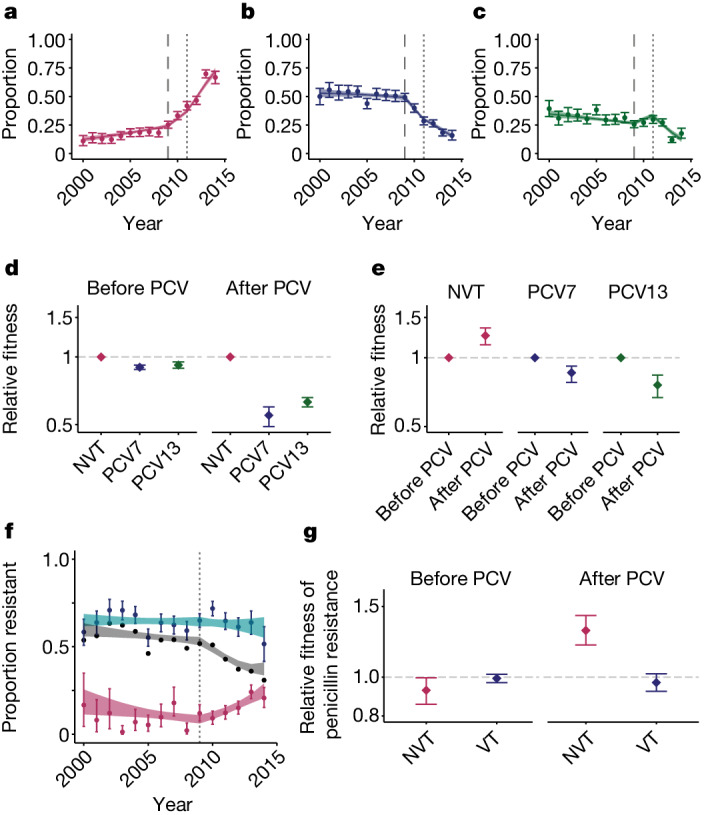
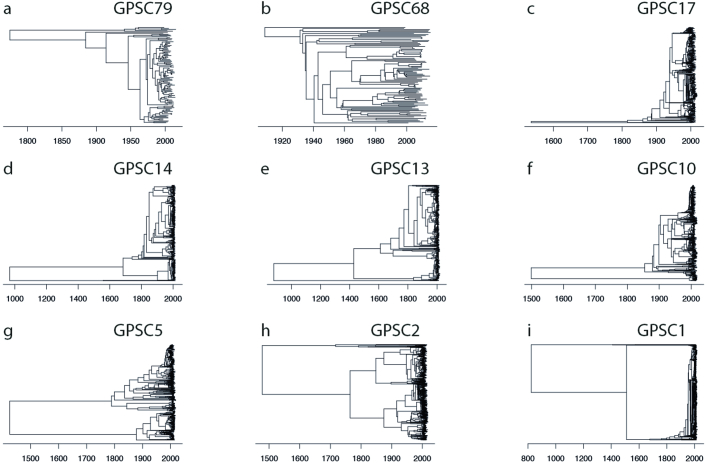
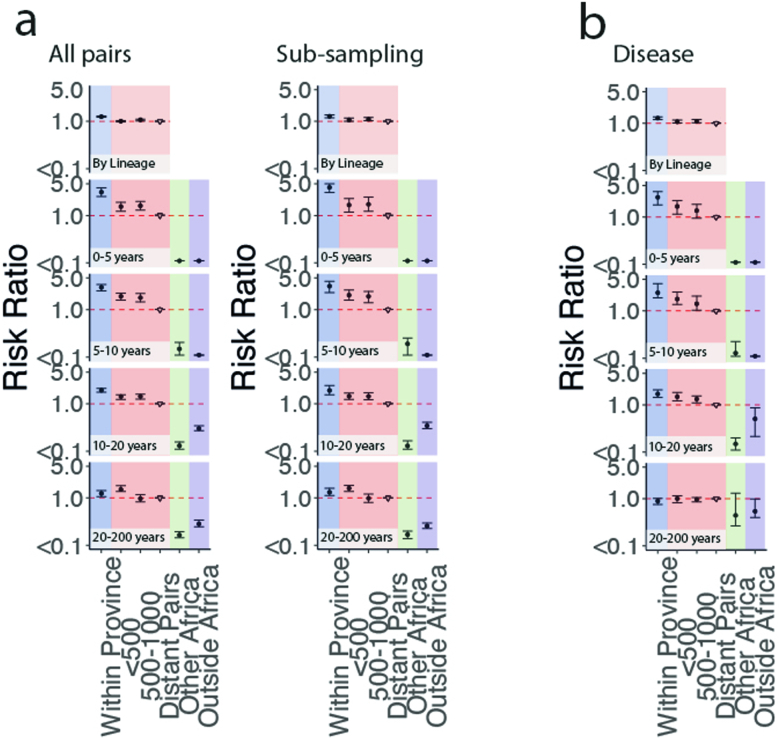
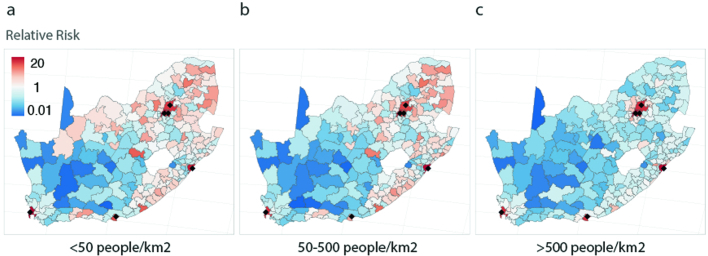
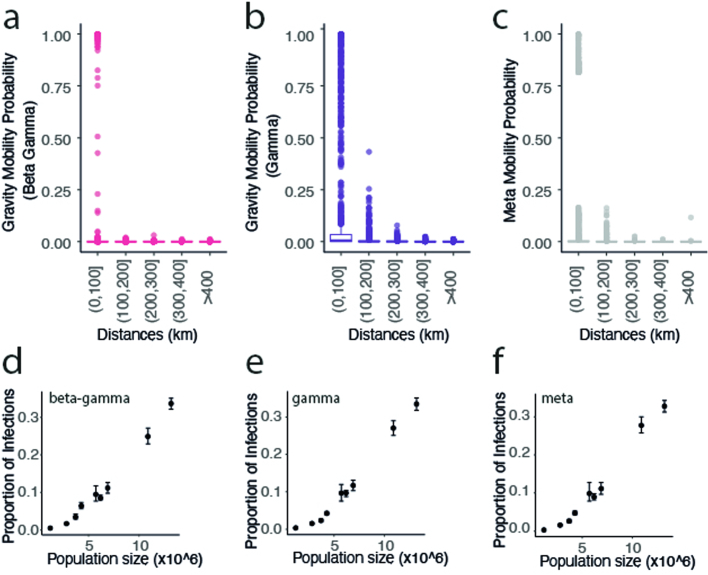
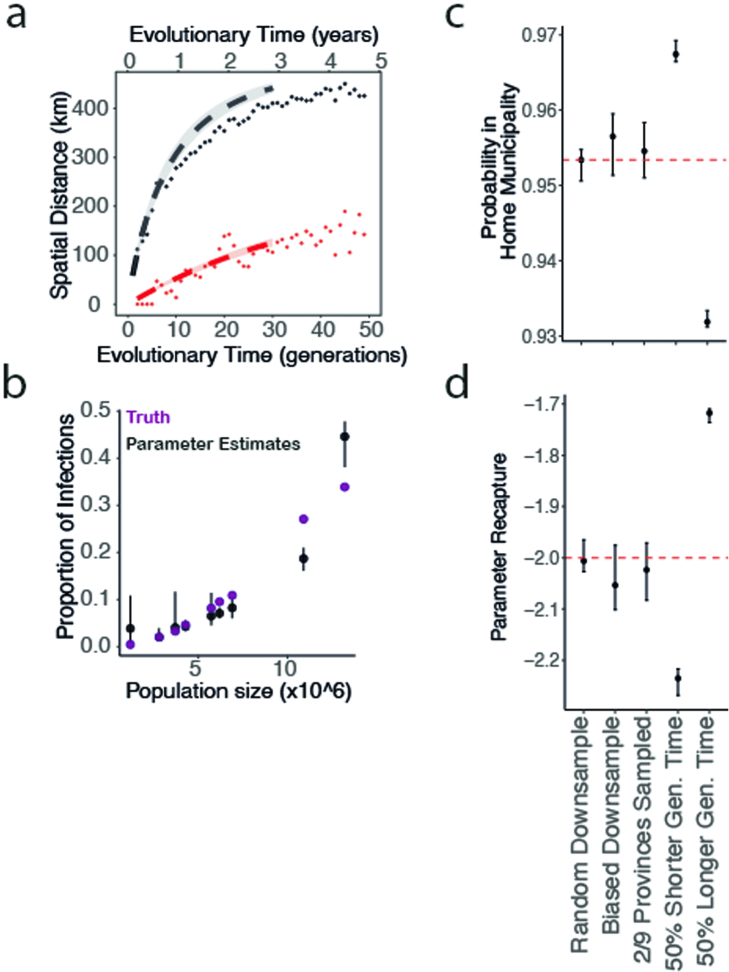
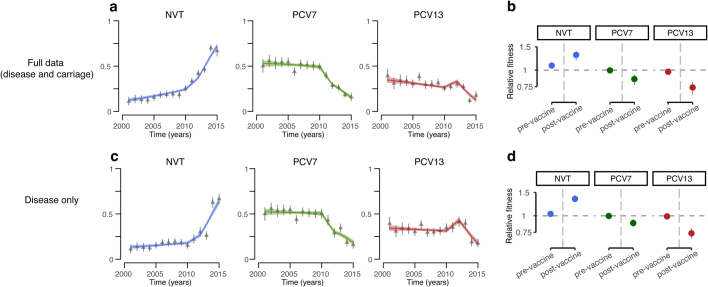
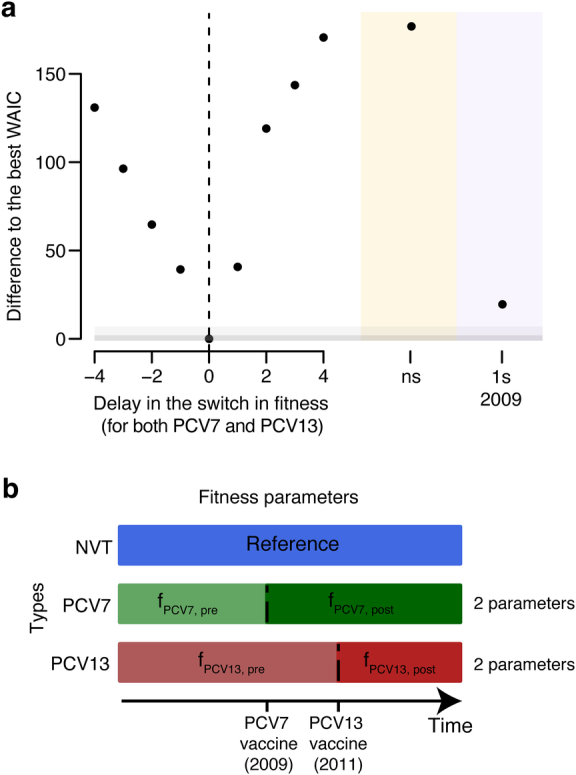
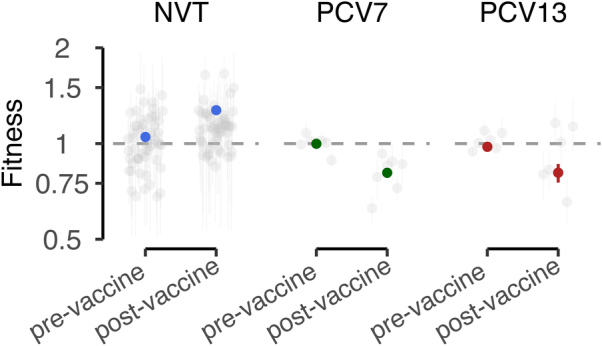
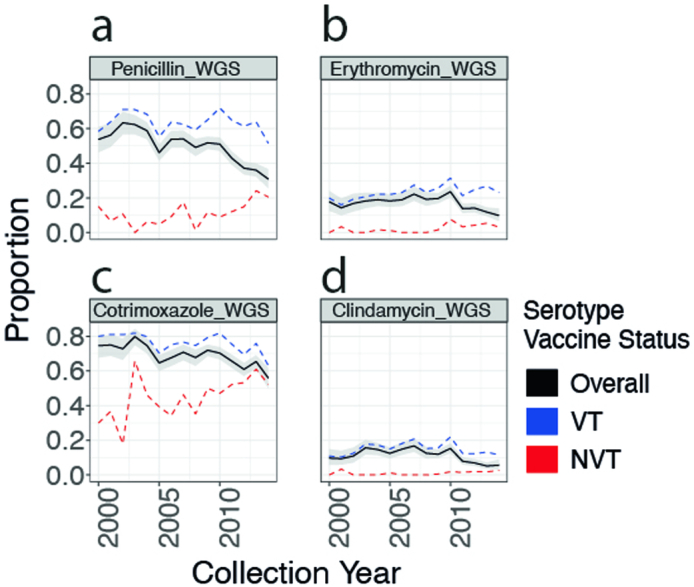
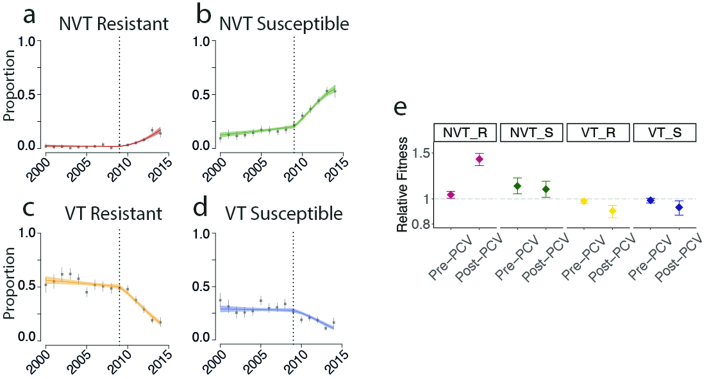
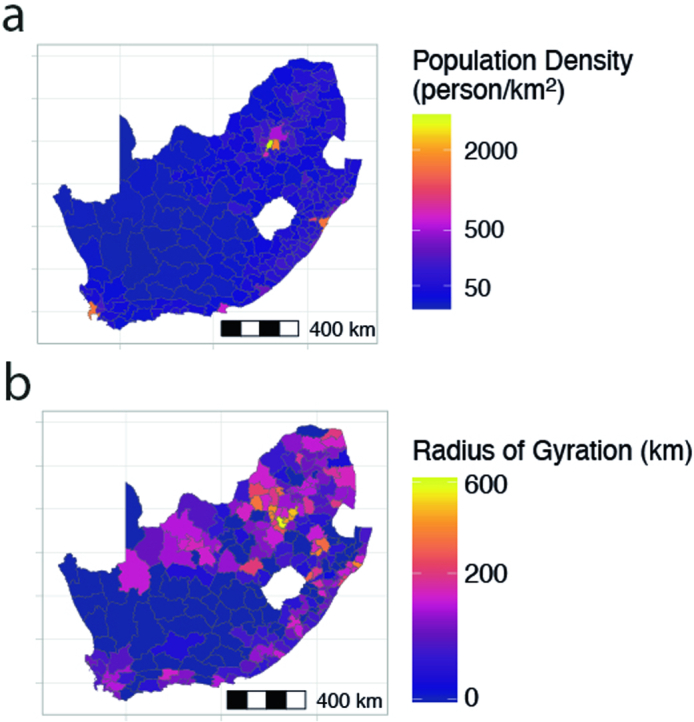
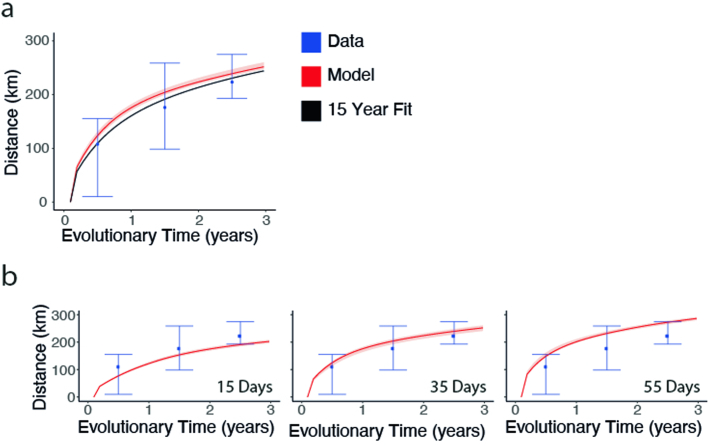
Streptococcus pneumoniae is a leading cause of pneumonia and meningitis worldwide. Many different serotypes co-circulate endemically in any one location1,2. The extent and mechanisms of spread and vaccine-driven changes in fitness and antimicrobial resistance remain largely unquantified. Here using geolocated genome sequences from South Africa (n = 6,910, collected from 2000 to 2014), we developed models to reconstruct spread, pairing detailed human mobility data and genomic data. Separately, we estimated the population-level changes in fitness of strains that are included (vaccine type (VT)) and not included (non-vaccine type (NVT)) in pneumococcal conjugate vaccines, first implemented in South Africa in 2009. Differences in strain fitness between those that are and are not resistant to penicillin were also evaluated. We found that pneumococci only become homogenously mixed across South Africa after 50 years of transmission, with the slow spread driven by the focal nature of human mobility. Furthermore, in the years following vaccine implementation, the relative fitness of NVT compared with VT strains increased (relative risk of 1.68; 95% confidence interval of 1.59-1.77), with an increasing proportion of these NVT strains becoming resistant to penicillin. Our findings point to highly entrenched, slow transmission and indicate that initial vaccine-linked decreases in antimicrobial resistance may be transient.


Conflict of interest statement

The authors declare no competing interests.

Figures

Fig. 1
Fig. 1. Descriptive summary of S.pneumoniae isolates.
a, Phylogenetic tree of 6,910 South African isolates included in this study. Dominant GPSCs (n > 50) are in purple. GPSC1 (top) and GPSC5 (bottom) are highlighted. The columns describe the serotypes and provincial region for each isolate. The branch length legends refer to single nucleotide polymorphisms (SNPs) per site and trees are midpoint rooted. b, Map of the nine provinces of South Africa coloured by province. Scale bar is included in kilometres (km). c, Count of isolates (n = 6,910) per collection year from 2000 to 2014 used in the lineage-level analysis (black) and the 9 dominant GPSCs used in the divergence time analysis (maroon). d, The mean geographical distance for sequence pairs as a function of cumulative evolutionary distance across all GPSCs with 95% CI (blue). The model fit is shown in red. The implied true pattern of spread is shown in purple, after accounting for a biased observation process. e, The proportion of NVT serotypes across the study period. f, The proportion of in silico predicted AMR isolates for four drugs across the study period. The vertical lines denote the introduction of PCV7 in 2009 and PCV13 in 2011. An interactive phylogeny and metadata are available at Microreact (https://microreact.org/project/7wqgd2gbBBEeBLLPKonbaT-belman2024southafricapneumococcus).
Fig. 2
Fig. 2. RR framework to determine geographical structure.
a, RR of being the same GPSC within a province (blue), between different provinces over increasing distance (red) and compared with geographically distant pairs (>1,000 km) (reference). (South Africa; n = 6,910). be, RR of having a time to most recent common ancestor (tMRCA) 0–5 years (b), 5–10 years (c), 10–20 years (d) and 20–200 years (e) ago within South African provinces (blue), across larger distances within South Africa (red), from South Africa to other countries in Africa (n = 1,157) (green), and from South Africa to countries outside of Africa (n = 2,944) (purple). All plots use a reference of pairs that are from distant provinces in South Africa (open triangle). f, RR of similarity over rolling 20-year windows of divergence times for pairs isolated within the same South African province compared with pairs from distant provinces in South Africa (>1,000 km apart). For af, plots are centred at the median and error bars represent 2.5 and 97.5 percentiles across posterior phylogenies.
Fig. 3
Fig. 3. Mechanisms of geographical migration.
a, The estimated probability of the location (province) of each MRCA (y axis) compared with the population size (x axis) in that province. Points are centred at the median and error bars represent 95% credible intervals. b, The proportion of individual or pathogen mobility as a function of distance from the origin location. We compared the mean distance travelled when we consider the infector only (crossed square), when we consider the mobility of both the infector and the infectee (black filled circle) after a single transmission generation, as well as the overall mobility of the pathogen after ten generations (triangle). As a comparison, we present the expected pathogen spread after a single generation if transmission was completely spatially random (maroon). We also present the difference between Meta users (blue circle) and the movement of those involved in transmission. Points are centred at the median and error bars represent 95% credible intervals. c, The RR of being in each of the 234 municipalities of South Africa after 1 year (10 transmission generations) of sequential person-to-person transmission compared with being in a randomly selected municipality. Black dots denote municipalities with populations of >3 million people. d, The number of unique municipalities visited for 500 unique sequential simulations (grey) and the mean (black-dashed) across years of transmission following an introduction in a randomly selected municipality given the modelled migration probabilities at each transmission generation. e, The relative number of unique municipalities visited by NVT serotypes compared with VT serotypes after 1 and 2 years of transmission. Points are centred at the median and error bars represent 95% credible intervals.
Fig. 4
Fig. 4. Vaccine-induced fitness dynamics.
ac, Data (points) and model fit (lines) for the proportion of serotypes from NVTs (a), PCV7 types (b) and additional PCV13 types not included in PCV7 (c) from the years 2000 to 2014 in this study. The long dashed line indicates the time of PCV7 implementation (2009) and the short, dashed line indicates the time of PCV13 implementation (2011). d, Relative fitness for the three groups of serotypes compared with the NVT fitness estimates before and after PCVs were introduced. e, Relative fitness estimates for all three groups of serotypes comparing the before and after PCV eras. For ae, before PCV refers to before 2009 for NVT serotypes, before 2009 for PCV7 type serotypes and before 2011 for PCV13 type serotypes. f, Proportion of penicillin resistance overall (black line), within NVT strains (maroon points) and within VT strains (turquoise points) with model fits. The dashed line indicates the time of PCV implementation (2009). g, Relative fitness of penicillin resistance among NVTs (pink) and VTs (blue) in before (left) and after (right) PCVs. Data in d, e and g are on a log scale. For af, plots are centred at the median and include error bars representing 95% credible intervals around the posterior parameter distributions (n = 6,798).
Extended Data Fig. 1
Extended Data Fig. 1. Time Resolved Trees for Dominant GPSCs.
Trees are recombination masked, aligned to a reference for each GPSC. Time resolution was performed using BactDating. The dates are along the x-axis. (a) GPSC79, N = 102 (b) GPSC68, N = 97 (c) GPSC17, N = 531 (d) GPSC14, N = 521 (e) GPSC13, N = 611 (f) GPSC10, N = 718 (g) GPSC5, N = 841 (h) GPSC2, N = 1430 (i) GPSC1, N = 1943.
Extended Data Fig. 2
Extended Data Fig. 2. Risk ratio framework sensitivity analyses to determine geographic structure when sub-sampling and only including disease isolates.
Risk ratio of being the same GPSC within a province (blue), between different provinces over increasing distance (red), compared to geographically distant pairs (>1000 km) (reference) (top) and the risk ratio of having a tMRCA 0–5, 5–10, 10–20, or 20–200 years ago within South African provinces (blue), across larger distances within South Africa (red), from South Africa to other countries in Africa (green), and from South Africa to countries outside of Africa (purple) (South Africa; N = 6910). (a) Including all isolates from each province (left) compared with sub-sampling to 300 with replacement to compensate for biased sampling in each province. (b) Including only isolates sampled from patients with pneumococcal disease. All plots use a reference of pairs which are from distant provinces in South Africa (open triangle). Error bars represent 2.5 to 97.5 CIs.
Extended Data Fig. 3
Extended Data Fig. 3. Relative risk of a pneumococcal strain being in each of municipality after 1 year of transmission.
Sequential transmission chains starting in municipalities with (a) <50 people/km2, (b) 50–500 people/km2, or (c) >500 people/km2 across 100,000 samples.
Extended Data Fig. 4
Extended Data Fig. 4. Estimated mobility and proportion of infections.
(a) a gravity model with two parameters adjusting the destination population size (beta) and the distance between locations (gamma) (pink), (b) a distance model whereby the probability of mobility is a function of the distance between locations adjusted with parameter gamma, (c) is the Meta mobility data between locations with a parameter adjusting the probability of staying in the home location (main model) across distances. (d-f) are the estimated proportion of infections by each of these models compared to the population size.
Extended Data Fig. 5
Extended Data Fig. 5. Replicated simulations for model performance testing.
Testing model performance using replicated simulations. (a) Simulated the total epidemic (black dots), biased down-sampled data as per true proportion per province (red dots) (“Biased Down-sample” in c and d), model fit to down-sampled data (red line), removing the sampling probability the model recapturing the true epidemic (black dot) (b) Population size (x-axis) compared to the proportion of infections from the down-sampled data (black) compared to the truth from the overall simulated epidemic (purple). (c) The probability of being in the home municipality and (d) the recaptured parameter after inputting a parameter of −2 to adjust the diagonal of the mobility matrix after one transmission generation. Both c and d include values from left to right for sampling as per the true data proportions in each province (6.5% of total infections), down-sampling to fit on only 2 of the 9 provinces, and if our generation time estimate is 50% smaller than the truth, exactly right, or 50% larger. Error bars represent 2.5 to 97.5 percentiles.
Extended Data Fig. 6
Extended Data Fig. 6. Comparison of fitness model results with full data or disease only data.
(a-b) Results with the full data. (c-d) Results with the disease-only data. a and c present the model fits for the proportion of serotypes from non-vaccine type (NVT), PCV7 types, and additional PCV13 types not included in PCV7 from the years 2000 to 2014 in this study. Points represent data and line represent the model fit. b and d present the relative fitness estimates for all three groups of serotypes in each era. Pre-vaccine era is prior to 2009 for NVTs, prior to 2009 for PCV7 and prior to 2011 for PCV13. Post-vaccine era is post-2009 for NVTs, post-2009 for PCV7 and post-2011 for PCV13. Error bars represent 2.5 and 97.5 percentiles.
Extended Data Fig. 7
Extended Data Fig. 7. Fitness growth model testing year of switch and schematic.
(a) Testing year of fitness switch for the logistic growth -fitness model. Adjusting the year of the fitness switch in the model fitting to vaccine status. The difference to the best WAIC (2009 [PCV7 implementation] & 2011 [PCV13 implementation]) is on the y-axis where the year of fitness switch relative to 2009 & 2011 is on the x-axis. Further we test no fitness switch (ns; yellow) and the impact of including one fitness switch in 2009 (purple). The dark gray box highlights equivalent models (ΔWAIC ≤2) and light gray box highlights similar models (ΔWAIC ≤ 7). (b) Schematic denoting the fitness growth model parameterisation which accounts for the specific timing of the PCV impacting each group of serotypes (NVT in blue; PCV7 in green; PCV13 in red).
Extended Data Fig. 8
Extended Data Fig. 8. Serotype fitness estimates.
Fitness estimates pre- and post-PCV (y-axis) for each serotype (grey), superimposed by group including NVT (blue), PCV7 (green), and PCV13 (red). Pre-vaccine and post-vaccine refer to pre- and post- 2009 and 2011 for PCV7 and PCV13 respectively. Individual serotype fitness estimates can be found in Fig. S9.
Extended Data Fig. 9
Extended Data Fig. 9. Antimicrobial resistance summary.
The proportional trends in antimicrobial resistance overall (black) and within Vaccine type [VT] (in blue) and Non-Vaccine Type [NVT] (in red) serotypes for in-silico predicted (a) penicillin (b) erythromycin (c) co-trimoxazole and (d) clindamycin.
Extended Data Fig. 10
Extended Data Fig. 10. Data fits for model accounting for proportions and fitness over time in four groups.
(a) NVT-penicillin resistant (red), (b) NVT-penicillin susceptible (green), (c) VT-penicillin resistant (yellow) and (d) VT-penicillin susceptible (blue). The dashed lines indicate the year of PCV7 implementation and fitness switch model implemented. (e) Fitness estimates pre-PCV and post-PCV for each group and colored accordingly. e is on a log scale. This model uses a shift in fitness in 2009. Error bars represent 2.5 to 97.5 percentiles.
Extended Data Fig. 11
Extended Data Fig. 11. Data descriptions across the 234 municipalities of South Africa.
(a) Population density as estimated given the area of each municipality and the populations estimated by LandScan and (b) the radius of gyration for each municipality given the distance between each municipality at the centroid weighted by the human mobility data from Meta Data for Good.
Extended Data Fig. 12
Extended Data Fig. 12. Parameter adjustment sensitivity analysis.
(a) Fitting the mobility model to 15 years of evolutionary distance. Fitting the probabilistic mobility model to pairs of genomes which are 15 years divergent from their MRCA (black), compared against the 10 years used in the main model (red), and the data (blue). (b) Assessing the mean geographic distance per evolutionary time in years for the data (blue), including the sampling probability (red) for, (left) generation time of 15 days, (middle) generation time of 35 days, and (right) generation time of 55 days.

Similar articles

Cited by

References

    1. World Health Organization. The top 10 causes of death. WHOhttps://www.who.int/news-room/fact-sheets/detail/the-top-10-causes-of-death (2020).
    1. Troeger C, et al. Estimates of the global, regional, and national morbidity, mortality, and aetiologies of lower respiratory tract infections in 195 countries: a systematic analysis for the Global Burden of Disease Study 2015. Lancet Infect. Dis. 2017;17:1133–1161. doi: 10.1016/S1473-3099(17)30396-1. - DOI - PMC - PubMed
    1. Ikuta, K. S. et al. Global mortality associated with 33 bacterial pathogens in 2019: a systematic analysis for the Global Burden of Disease Study 2019. Lancet400, 2221–2248 (2022). - PMC - PubMed
    1. Bender, R. G. et al. Global, regional, and national incidence and mortality burden of non-COVID-19 lower respiratory infections and aetiologies, 1990–2021: a systematic analysis from the Global Burden of Disease Study 2021. Lancet Infect. Dis.10.1016/S1473-3099(24)00176-2 (2024). - PubMed
    1. Lees JA, et al. Fast and flexible bacterial genomic epidemiology with PopPUNK. Genome Res. 2019;29:304–316. doi: 10.1101/gr.241455.118. - DOI - PMC - PubMed

MeSH terms

LinkOut - more resources