. 2024 Jul;631(8021):617-626.
doi: 10.1038/s41586-024-07636-1. Epub 2024 Jul 3.

Spike deep mutational scanning helps predict success of SARS-CoV-2 clades

Affiliations

Spike deep mutational scanning helps predict success of SARS-CoV-2 clades

Bernadeta Dadonaite et al. Nature. 2024 Jul.

Abstract

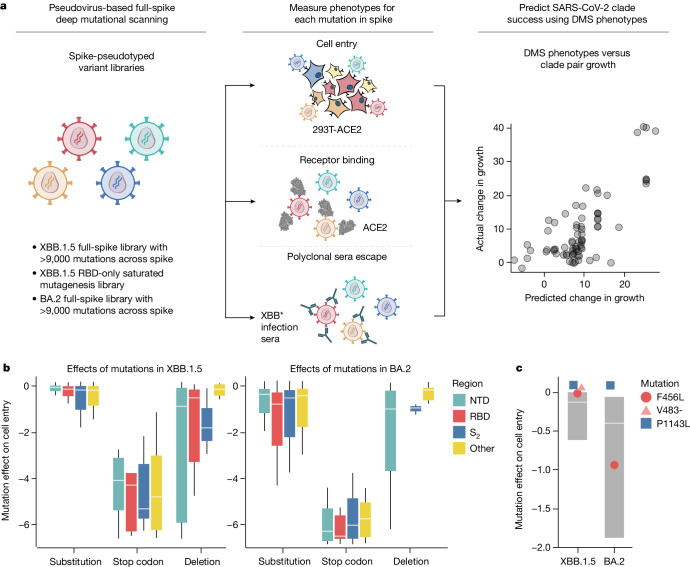
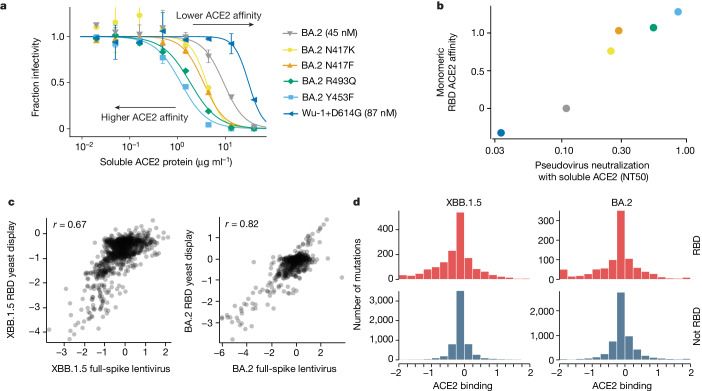
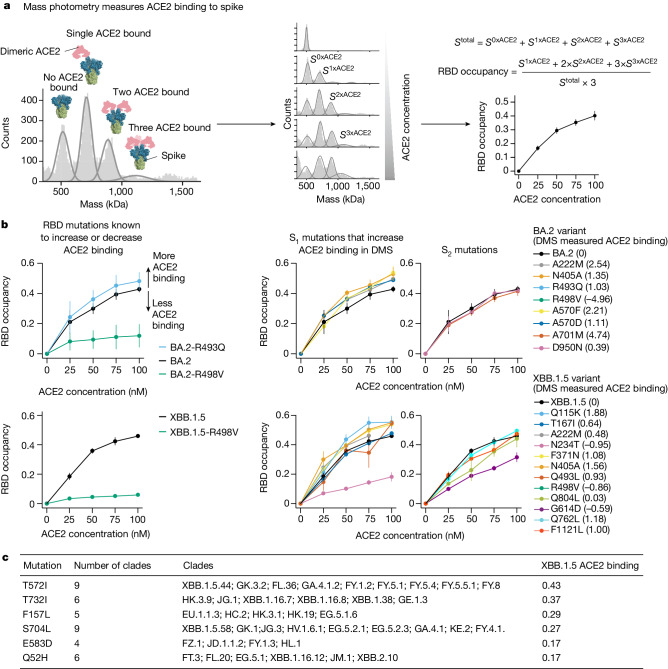
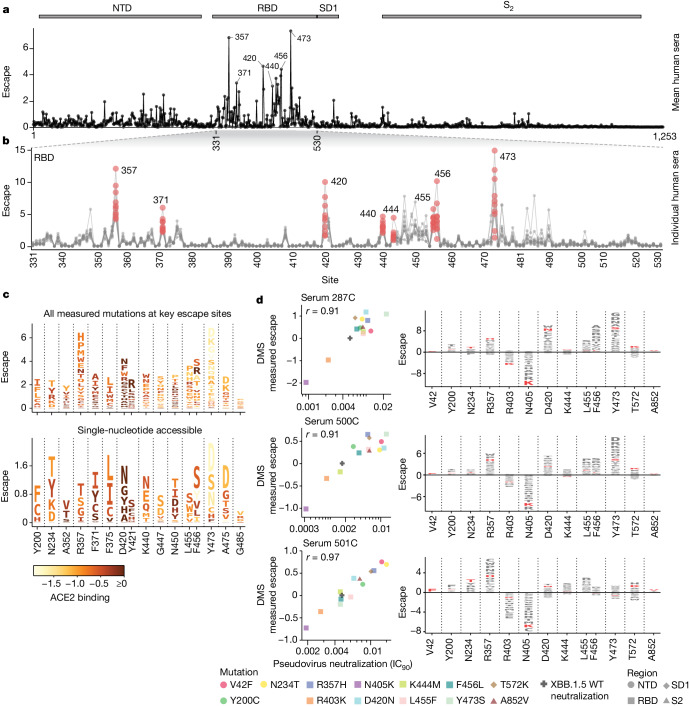
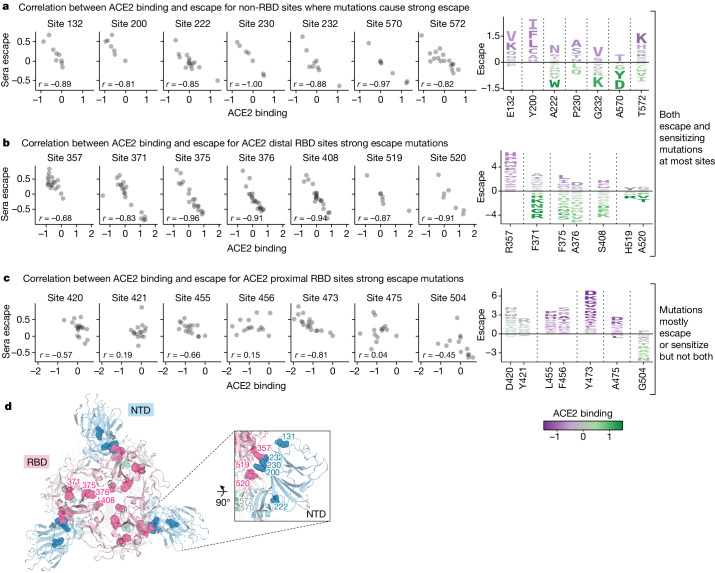
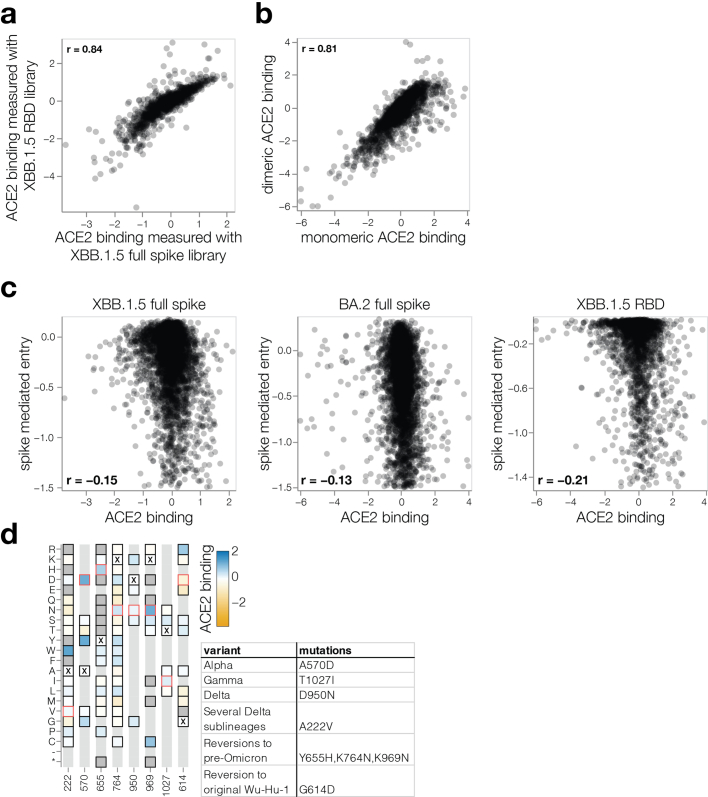
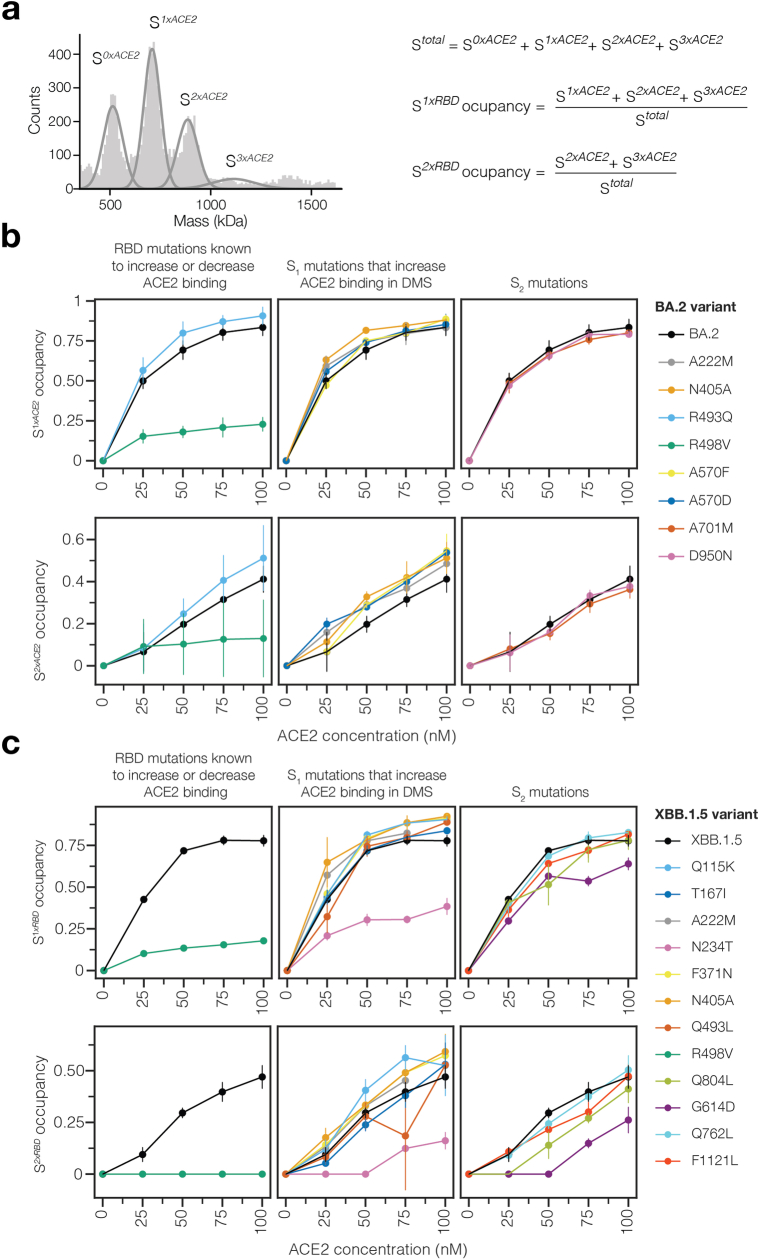
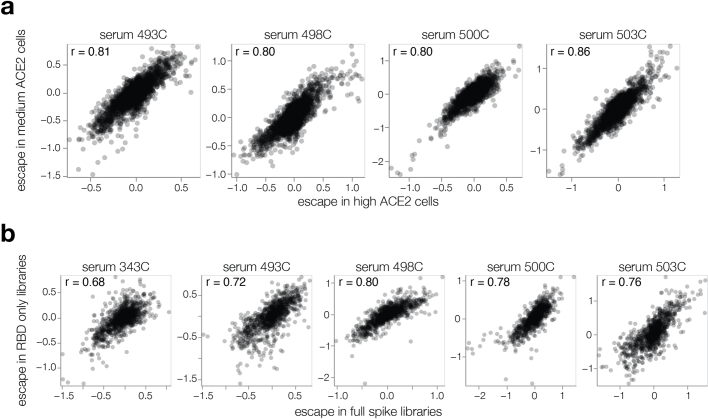
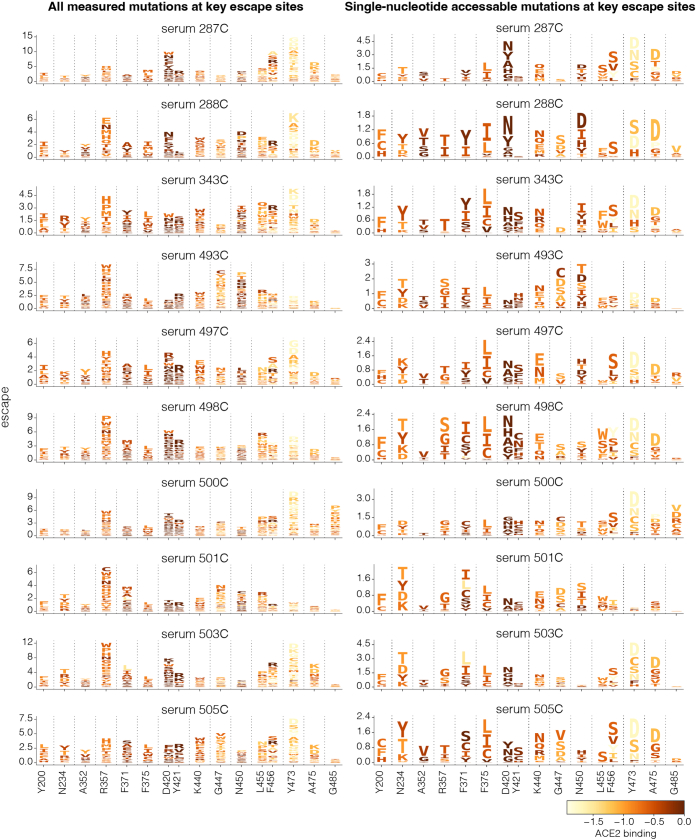
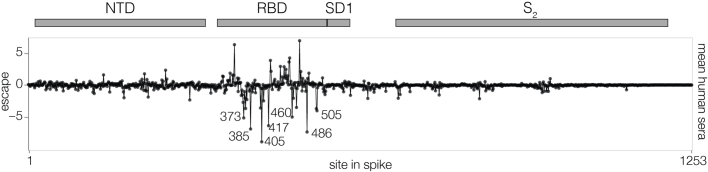
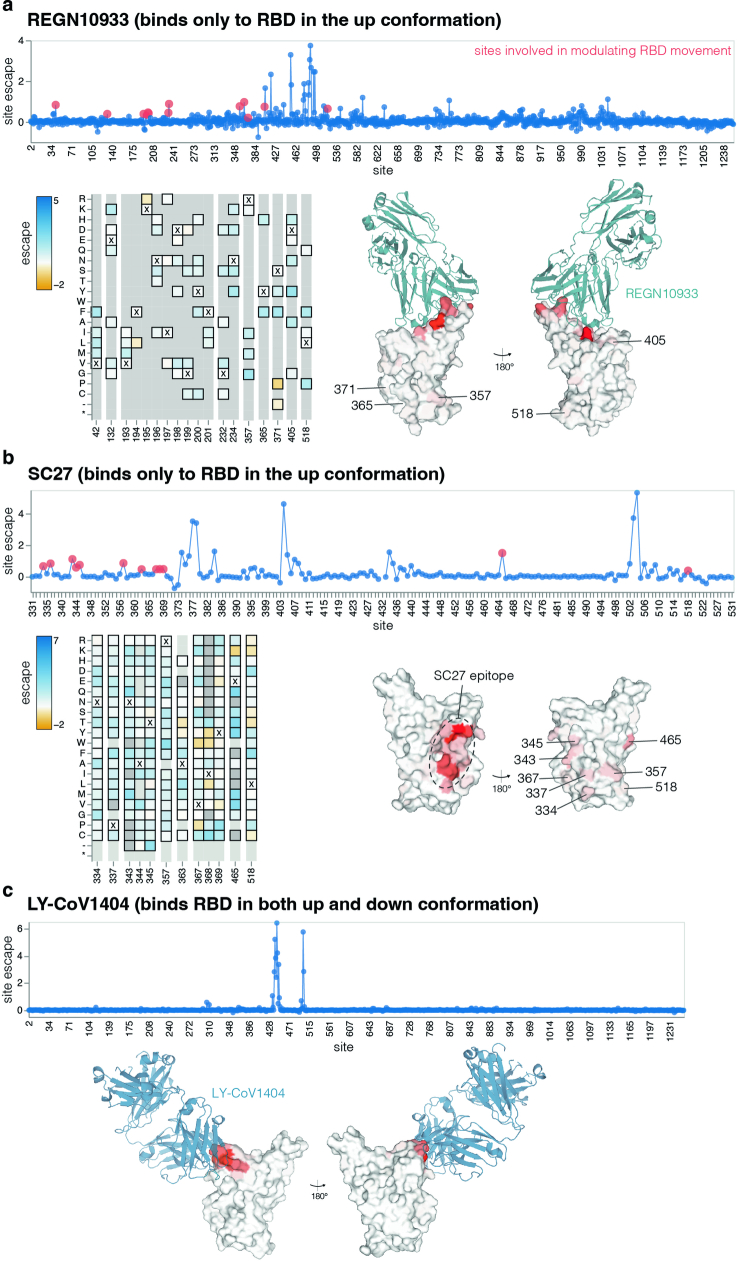
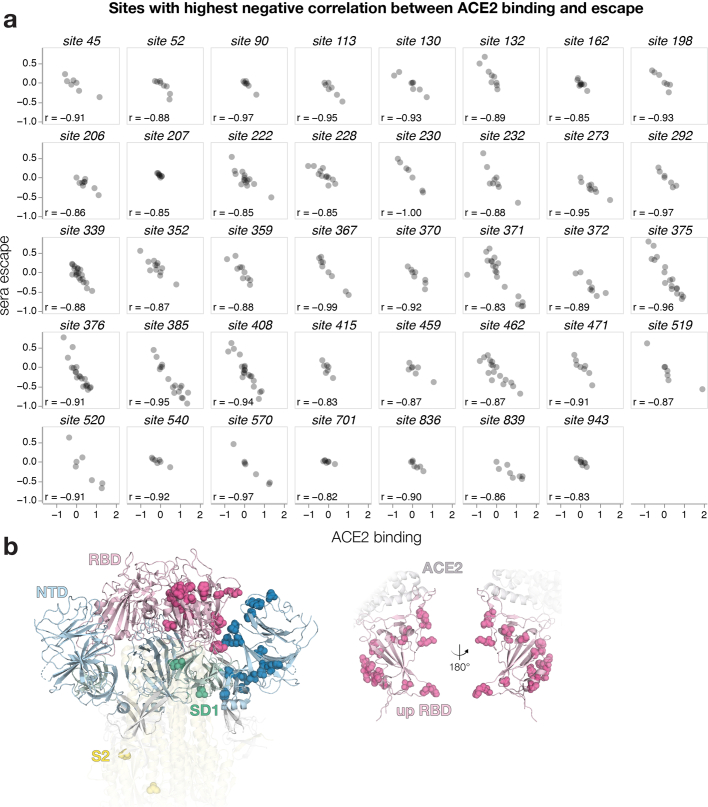
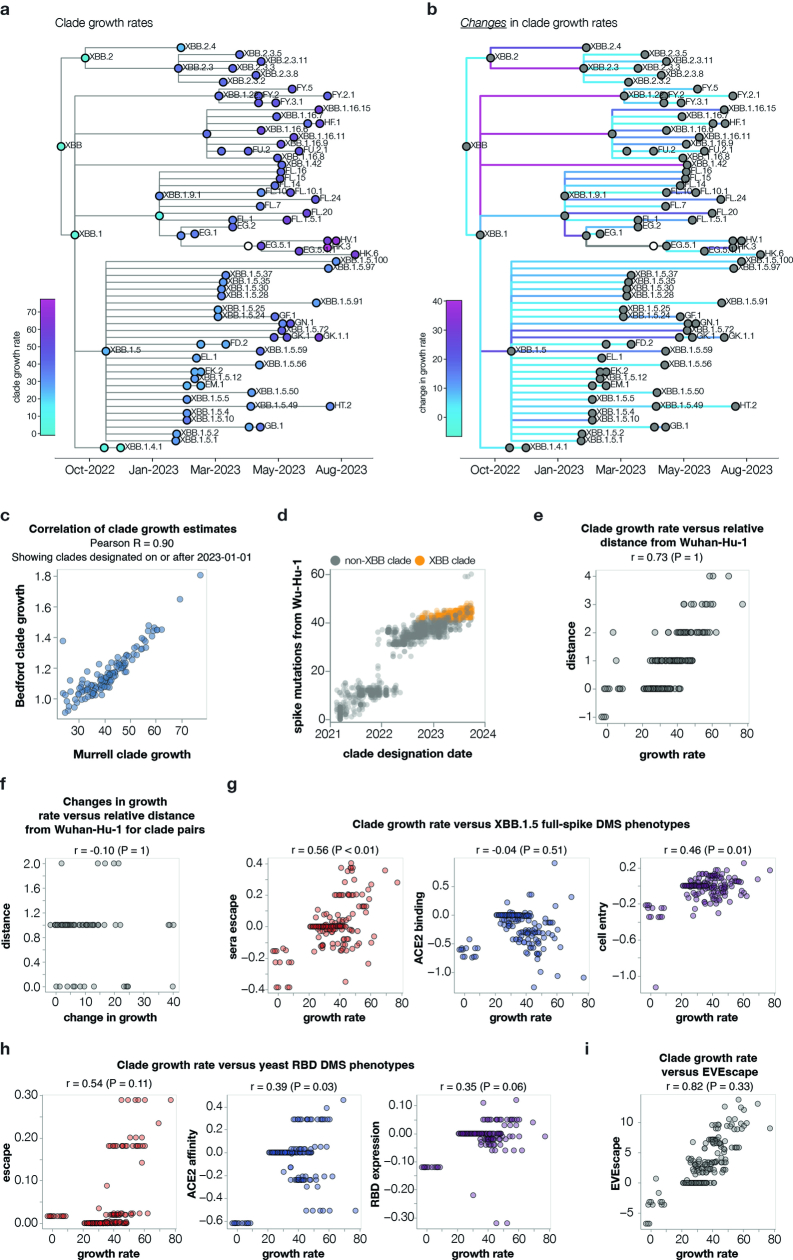
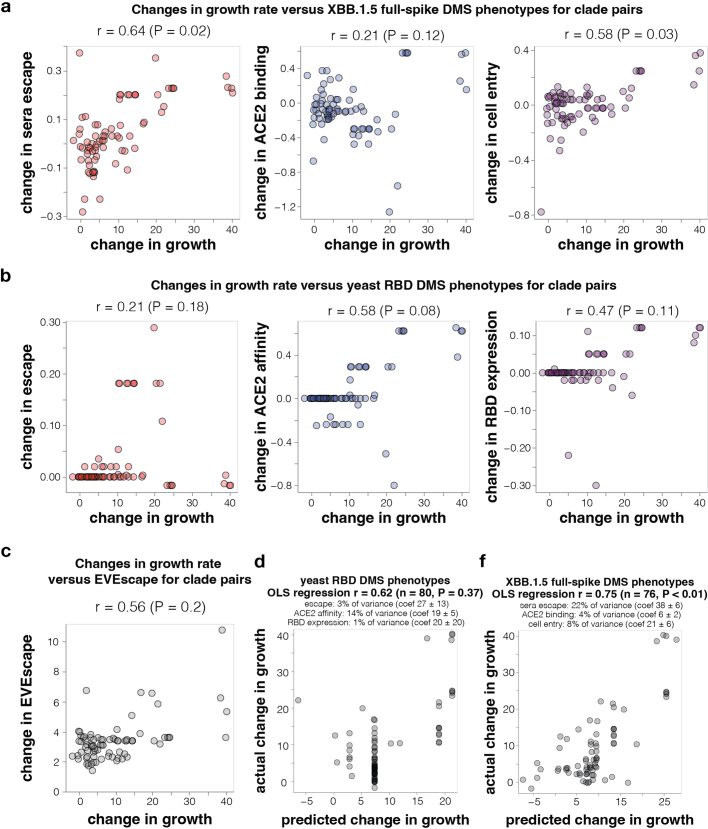
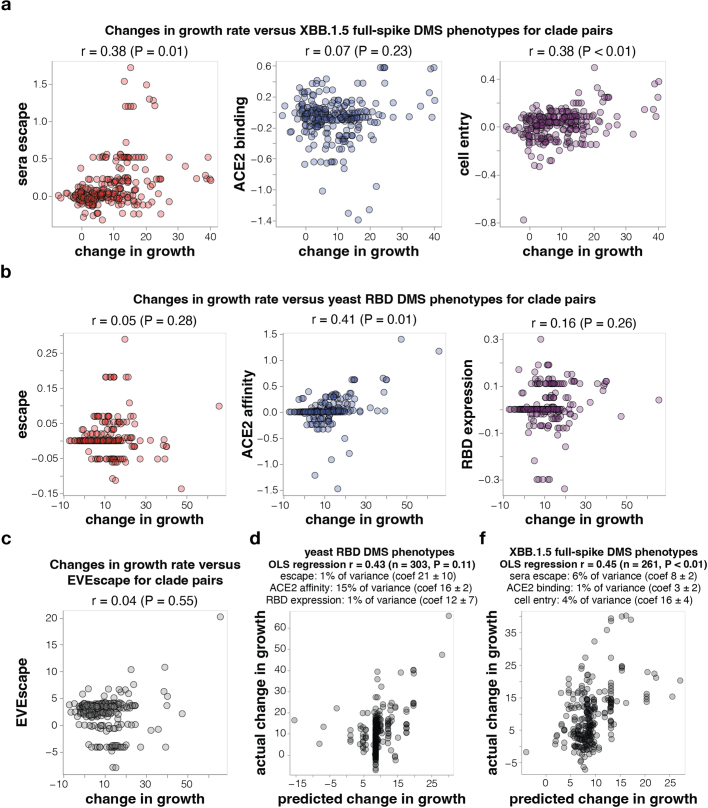
SARS-CoV-2 variants acquire mutations in the spike protein that promote immune evasion1 and affect other properties that contribute to viral fitness, such as ACE2 receptor binding and cell entry2,3. Knowledge of how mutations affect these spike phenotypes can provide insight into the current and potential future evolution of the virus. Here we use pseudovirus deep mutational scanning4 to measure how more than 9,000 mutations across the full XBB.1.5 and BA.2 spikes affect ACE2 binding, cell entry or escape from human sera. We find that mutations outside the receptor-binding domain (RBD) have meaningfully affected ACE2 binding during SARS-CoV-2 evolution. We also measure how mutations to the XBB.1.5 spike affect neutralization by serum from individuals who recently had SARS-CoV-2 infections. The strongest serum escape mutations are in the RBD at sites 357, 420, 440, 456 and 473; however, the antigenic effects of these mutations vary across individuals. We also identify strong escape mutations outside the RBD; however, many of them decrease ACE2 binding, suggesting they act by modulating RBD conformation. Notably, the growth rates of human SARS-CoV-2 clades can be explained in substantial part by the measured effects of mutations on spike phenotypes, suggesting our data could enable better prediction of viral evolution.


Conflict of interest statement

J.D.B. and B.D. are inventors on Fred Hutchinson Cancer Center licensed patents related to the pseudovirus deep mutational scanning system used in this paper. J.D.B. consults for Apriori Bio, Invivyd, Aerium Therapeutics, GlaxoSmithKline and the Vaccine Company on topics related to viral evolution. H.Y.C. reports consulting with Ellume, Pfizer and the Bill and Melinda Gates Foundation. She has served on advisory boards for Vir, Merck and Abbvie. She has conducted continuing medical education teaching with Medscape, Vindico and Clinical Care Options. She has received research funding from Gates Ventures, and support and reagents from Ellume and Cepheid, all outside the submitted work. D.V. is named as inventor on patents for coronavirus vaccines filed by the University of Washington. The other authors declare no competing interests.

Figures

Fig. 1
Fig. 1. Deep mutational scanning to measure phenotypes of the XBB.1.5 and BA.2 spikes.
a, We measure the effects of mutations in spike on cell entry, receptor binding and serum escape using deep mutational scanning (DMS). We then use these measurements to predict the evolutionary success of human SARS-CoV-2 clades. b, Distribution of effects of mutations in XBB.1.5 and BA.2 spikes on entry into 293T-ACE2 cells for all mutations in the deep mutational scanning libraries, stratified by the type of mutation and the domain in spike. Negative values indicate worse cell entry than the unmutated parental spike. Note that the library design favoured introduction of substitutions and deletions that are well tolerated by spike, explaining why many mutations of these types have neutral to only modestly deleterious effects on cell entry. c, Cell entry effects of mutations F456L, P1143L and deletion of V483 relative to the distribution of effects of all substitution and deletion mutations in the libraries. Interactive heat maps with effects of individual mutations across the whole spike on cell entry are at https://dms-vep.github.io/SARS-CoV-2_XBB.1.5_spike_DMS/htmls/293T_high_ACE2_entry_func_effects.html and https://dms-vep.org/SARS-CoV-2_Omicron_BA.2_spike_ACE2_binding/htmls/293T_high_ACE2_entry_func_effects.html. The boxes in b and c span the interquartile range, with the horizontal white line indicating the median. Whiskers in b indicate 0.75 of the interquartile range plotted from the smallest value of the first and highest value of the third quartile. For c, the effect of deleting V483 was not measured in the BA.2 spike. The effects of mutations are the mean of two biological replicate measurements made with different deep mutational scanning libraries.
Fig. 2
Fig. 2. Effects of mutations on full-spike ACE2 binding measured using pseudovirus deep mutational scanning.
a, Neutralization of pseudoviruses with the indicated spikes by soluble monomeric ACE2. Viruses with spikes that have stronger binding to ACE2 are neutralized more efficiently by soluble ACE2 (lower half-maximal neutralizing titers(NT50)), whereas viruses with spikes with worse binding are neutralized more weakly. Error bars indicate standard error between two replicates. ACE2 affinity values measured by surface plasmon resonance for BA.2 and Wu-1+D614G are shown in brackets. b, Correlation between neutralization NT50 by soluble ACE2 versus the RBD affinity for ACE2 as measured by titrations using yeast-displayed RBD. c, Correlations between the effects of RBD mutations on ACE2 binding measured using the pseudovirus-based approach (this study) and yeast-based RBD display,. d, Distribution of effects of individual mutations on full-spike ACE2 binding for all functionally tolerated mutations in our libraries, stratified by RBD versus non-RBD mutations. Note that effects of magnitude greater than two are clamped to the limits of the plots’ x axes. The effects of individual XBB.1.5 spike mutations on ACE2 binding are shown in Extended Data Fig. 3.
Fig. 3
Fig. 3. Non-RBD mutations affect ACE2 binding.
a, ACE2 binding measurements using mass photometry. The histogram on the left shows distribution of spike molecular mass when no (S0xACE2), one (S1xACE2), two (S2xACE2) or three (S3xACE2) ACE2 molecules are bound. We measure how this mass distribution changes as spike is incubated with increasing concentrations of soluble dimeric ACE2. RBD occupancy is the fraction of RBDs bound to ACE2, calculated using Gaussian components for S0xACE, S1xACE2, S2xACE2 and S3xACE2 at each ACE2 concentration. b, RBD occupancy measured using mass photometry for different BA.2 and XBB.1.5 spike variants. Top left panel shows that a BA.2 spike mutation known to increase ACE2 binding (R493Q/blue) has greater RBD occupancy relative to unmutated BA.2 (black) spike, by contrast a mutation known to decrease ACE2 binding (R498V/green) has lower RBD occupancy in both BA.2 (top left panel) and XBB.1.5 (bottom left panel) backgrounds. Panels on the right show RBD occupancy for BA.2 (top right) and XBB.1.5 (bottom right) spike variants with mutations in S1 or S2 subunits measured to increase ACE2 binding in the deep mutational scanning. Values shown in parentheses after the mutation in the legend are the effect on ACE2 binding measured by deep mutational scanning. Error bars in plots a and b indicate standard error between two replicates. c, Non-RBD mutations measured to increase ACE2 binding in deep mutational scanning experiments that have arisen independently as defining mutations in at least four XBB-descended clades.
Fig. 4
Fig. 4. Serum antibody escape mutations for individuals with previous XBB* infections.
a, Escape at each site in the XBB.1.5 spike averaged across ten sera collected from individuals with previous XBB* infections. The points indicate the total positive escape caused by all mutations at each site. See https://dms-vep.github.io/SARS-CoV-2_XBB.1.5_spike_DMS/htmls/summary_overlaid.html for an interactive version of this plot with extra mutation-level data. b, Enlarged view of the escape at each site in RBD with each line representing one of the ten sera. Key sites are labelled with red circles indicating escape for each of the ten sera. Red data points indicate escape for each individual at select RBD positions. c, Logo plots showing the 16 sites of greatest total escape after averaging across the sera. Letter heights indicate escape caused by mutation to that amino acid, and letters are coloured light yellow to dark brown depending on the impact of that mutation on ACE2 binding (see colour key). The top plot shows all amino-acid mutations measured, and the bottom plot shows only amino acids accessible by a single-nucleotide mutation to the XBB.1.5 spike. d, The left shows a correlation between DMS escape scores and pseudovirus neutralization assay IC90 values for three sera. The right is a logo plot showing escape for all sites with mutations validated in the neutralization assays, with the specific validated mutations in red.
Fig. 5
Fig. 5. Sera escape and ACE2 binding are inversely correlated for non-RBD and ACE2-distal RBD sites.
a, The left shows a correlation between ACE2 binding and sera escape for amino-acid mutations at non-RBD sites with the highest mutation-level sera escape (each point is a distinct amino-acid mutation). Average escape for each mutation across all sera is shown. The right shows a logo plot for the same sites, with letter heights proportional to escape caused by that mutation (negative heights mean more neutralization), and letter colours indicating effect on ACE2 binding (green means better binding). b, A similar plot for RBD sites that are distal (at least 15 Å) from ACE2. c, A similar plot for RBD sites proximal (within 15 Å) to ACE2. Only sites with at least seven different mutations measured are included in the logo plots. d, Top-down view of XBB spike (Protein Data Bank ID 8IOT) with the non-RBD and ACE2-distal sites shown in a and b highlighted as spheres. The RBD is pink, the NTD is blue and sites in SD1 are green.
Fig. 6
Fig. 6. Spike phenotypes measured by deep mutational scanning partially predict the evolutionary success of SARS-CoV-2 clades.
a, Correlation between the changes in growth rate for parent–descendant clade pairs versus the change in each spike phenotype measured in the XBB.1.5 full-spike deep mutational scanning (several mutations are assumed to have additive effects). The text above each plot shows the Pearson correlation (r) and a P value computed by comparing the actual correlation to that for 100 randomizations of the experimental data among mutations. b, Ordinary least-squares multiple linear regression of changes in growth rate versus all three measured spike phenotypes. The small text indicates the unique variance explained by each variable, as well as the coefficients (coef.) in the regression. See https://dms-vep.github.io/SARS-CoV-2_XBB.1.5_spike_DMS/htmls/current_dms_clade_pair_growth.html and https://dms-vep.github.io/SARS-CoV-2_XBB.1.5_spike_DMS/htmls/current_dms_ols_clade_pair_growth.html for interactive versions of both panels in which points can be hovered over for details on clades and their mutations. P values are for one-sided tests of the hypothesis that the tested predictor outperforms randomizations, and are reported individually for each comparison. See Extended Data Fig. 12 for a similar analysis that also includes BA.2 and BA.5 descended clades.
Extended Data Fig. 1
Extended Data Fig. 1. XBB.1.5 and BA.2 spike deep mutational scanning libraries.
a, Number of targeted and final number of mutations and barcoded variants in the XBB.1.5 and BA.2 full spike and XBB.1.5 RBD pseudovirus-based deep mutational scanning libraries. b, Total number of unique spike amino-acid mutations present in BA.2, BA.5, BA.2.86, and XBB descended Pango clades and the number of those mutations that are present in at least three barcoded variants in each replicate of the XBB.1.5 full spike libraries, which was the minimum number of occurrences we needed to make high-confidence estimates of the mutational effects on cell entry. The first number is the total number of mutations meeting the criteria and the number in parentheses is the number of these mutations covered in the libraries: for example, there are 108 spike amino-acid mutations that occur in more than one XBB-descended clade, and 107 of those mutations are well covered in our XBB.1.5 full spike libraries. c, Method for creating genotype-phenotype linked spike deep mutational scanning libraries, as previously described in Dadonaite et al.. Lentivirus backbone plasmids encoding barcoded mutagenised spike genes together with helper and VSV-G expression plasmids are transfected into 293 T cells to make VSV-G pseudotyped virus. These viruses are used to infect 293T-rtTA cells at MOI < 0.01 so that no more than one spike variant is integrated into each cell. Transduced cells are selected for lentiviral integration, and spike pseudotyped virus libraries are produced from these cells by transfecting helper plasmids in the presence of doxycycline to induce spike expression. In the absence of doxycycline and with added VSV-G expression plasmid, VSV-G pseudotyped virus libraries are also produced from the same cell lines; these VSV-G pseudotyped viruses are used to help estimate effects of spike mutations on cell entry as described in the next panel. d, Method used to measure effects of mutations in spike on cell entry. The ability of each spike variant to mediate cell entry is assessed by quantifying its relative frequency in 293T-ACE2 cells infected with spike-pseudotyped versus VSV-G pseudotyped libraries. e, Correlations between the effects of mutations on cell entry measured using each of the two independent full spike libraries of XBB.1.5 or BA.2. Throughout the rest of this paper, we report the mean value between the two libraries. f, Correlation between mutational effects on cell entry measured for the XBB.1.5 versus BA.2 full spike libraries. g, Cell-entry effects as measured in the deep mutational scanning of mutations in either the flexible loops or core β-sheets of the NTD. The left plot shows the effects of amino-acid mutations; the right plot shows the effects of single-residue deletions. The black line indicates the median entry effect, and the boxes indicate the interquartile range. Mutational effects are the median of two biological replicates. Whiskers indicate 0.75 of the interquartile range plotted from the smallest value of the 1st and highest value of the 3rd quartile. h, Correlation between mutational effects measured with the XBB.1.5 or BA.2 full spike libraries and fitness effects of those mutations estimated from actual human SARS-CoV-2 sequences.
Extended Data Fig. 2
Extended Data Fig. 2. Correlations among measured mutational effects on ACE2 binding.
a, Correlation between effects of mutations on ACE2 binding measured with XBB.1.5 full spike and XBB.1.5 RBD pseudovirus libraries. b, Correlation between effects of mutations on ACE2 binding measured using XBB.1.5 RBD pseudovirus library with monomeric and dimeric ACE2. Heatmaps with the XBB.1.5 RBD pseudovirus measurements made using monomeric and dimeric ACE2 are at https://dms-vep.github.io/SARS-CoV-2_XBB.1.5_RBD_DMS/htmls/monomeric_ACE2_mut_effect.html and https://dms-vep.github.io/SARS-CoV-2_XBB.1.5_RBD_DMS/htmls/dimeric_ACE2_mut_effect.html, respectively c, Correlation between effects of mutations on ACE2 binding and spike-mediated cell entry for different libraries. d, ACE2 binding heat map showing key non-RBD sites that have mutated in the past major SARS-CoV-2 variants. Specific variant mutations are highlighted in red outline. Table on the right indicates variants in which these mutations occurred. See https://dms-vep.github.io/SARS-CoV-2_XBB.1.5_spike_DMS/htmls/monomeric_ACE2_mut_effect.html for an interactive plot showing ACE2 binding for all mutations measured in spike is at.
Extended Data Fig. 3
Extended Data Fig. 3. Effects of NTD and RBD mutations on full-spike ACE2 binding.
Mutations that enhance ACE2 binding are shaded blue, mutations that decrease affinity are shaded orange, mutations that are too deleterious for cell entry to be measured in the binding assay are dark gray, and light gray indicates mutations not present in our libraries. Interactive heatmaps showing mutational effects on ACE2 binding for the full XBB.1.5 and BA.2 spikes are at https://dms-vep.github.io/SARS-CoV-2_XBB.1.5_spike_DMS/htmls/monomeric_ACE2_mut_effect.html and https://dms-vep.org/SARS-CoV-2_Omicron_BA.2_spike_ACE2_binding/htmls/monomeric_ACE2_mut_effect.html. Note that a few sites are missing in the static heatmap in this figure due to lack of coverage or deletions in the XBB.1.5 spike; see the interactive heatmaps for per-site numbering.
Extended Data Fig. 4
Extended Data Fig. 4. Mass photometry measurements for S1 and S2 occupancy.
a, Illustration of Gaussian components for no (S0xACE2), one (S1xACE2), two (S2xACE2), or three (S3xACE2) ACE2-bound spikes. S1xRBD occupancy is the fraction of spikes bound by one ACE2 molecule and S2xRBD occupancy is the fraction of spikes bound by two ACE2 molecules. b, Top row - S1xRBD occupancy measured using mass photometry for different BA.2 spike mutants. Bottom row - S2xRBD occupancy for different BA.2 spike mutants. c, Top row - S1xRBD occupancy for different XBB.1.5 spike mutants. Bottom row - S2xRBD occupancy for different XBB.1.5 spike mutants. Error bars in plots b-c indicate standard error between two biological replicates.
Extended Data Fig. 5
Extended Data Fig. 5. Correlation among serum escape mapping experiments.
a, Correlation between mutation escape scores for experiments using the full-spike XBB.1.5 libraries performed on 293 T cells expressing high or medium amounts of ACE2 for four sera. Note that the medium cells were used for all other figures shown in this paper. b, Correlation between mutation escape scores for mutations in the XBB.1.5 full spike and RBD-only libraries. See https://dms-vep.github.io/SARS-CoV-2_XBB.1.5_spike_DMS/htmls/compare_high_medium_ace2_escape.html and https://dms-vep.github.io/SARS-CoV-2_XBB.1.5_spike_DMS/htmls/compare_spike_rbd_escape.html for interactive versions of these scatter plots that also show line plots of per-site escape values for each serum.
Extended Data Fig. 6
Extended Data Fig. 6. Escape at key sites for each serum.
Logoplots showing XBB.1.5 spike escape at 16 highest escape sites for each of the 10 sera measured. Letter heights indicate the escape caused by mutation to that amino acid. Letters are colored light yellow to dark brown depending on mutation effect on ACE2 binding. Left: all mutations measured. Right: mutations accessible with a single-nucleotide substitution.
Extended Data Fig. 7
Extended Data Fig. 7. Mutations in XBB.1.5 spike that increase serum neutralization.
Escape at each site in the XBB.1.5 spike averaged across the 10 sera from individuals with prior XBB* infections, showing negative as well as positive values (Fig. 4 only shows positive values). Sites with negative escape in this plot are ones where many mutations make spike more sensitive to neutralization. Interactive plots with site and mutation-level escape are at https://dms-vep.github.io/SARS-CoV-2_XBB.1.5_spike_DMS/htmls/summary_overlaid.html (set ‘floor escape at zero’ at the bottom of the chart to false to show negative escape).
Extended Data Fig. 8
Extended Data Fig. 8. Only antibodies that bind RBD in the up conformation are escaped by mutations outside the structural epitope.
This figure shows previously generated and published deep mutational scanning escape maps for three monoclonal antibodies, two of which bind to RBD only in the up conformation (REGN10933 and SC27) and one of which binds to the RBD in both the up and down conformation (LY-CoV1404). All antibodies are escaped by mutations in their direct structural epitope, but only the antibodies that bind only the up conformation are escaped by ACE2-distal mutations outside their epitope that affect RBD up/down conformation. a, REGN10933 escape profile mapped using a Delta full spike deep mutational scanning library. REGN10933 only binds RBD in the up position,. Line plot shows mean escape at each position in Delta spike with sites that modulate RBD movement highlighted in red. Heatmap shows mutation escape scores for sites highlighted in red on the line plot. Surface representation of RBD is coloured by site mean escape score with sites showing escape in the RBD outside the main antibody labeled (PDB ID: 6XDG). b, SC27 antibody escape profile mapped using the XBB.1.5 saturated RBD deep mutational scanning library. SC27 only binds RBD in the up conformation. (PDB ID: 7MMO). c, LY-CoV1404 escape profile mapped using the BA.1 full spike deep mutational scanning library. LY-CoV1404 binds RBD in both up and down conformations. (PDB ID: 7MMO).
Extended Data Fig. 9
Extended Data Fig. 9. Sites with highest inverse correlation between ACE2 binding and serum escape.
a, Correlation between ACE2 binding and serum escape for sites in XBB.1.5 spike. Only sites with at least 7 mutations measured and Pearson r < 0.82 are shown. b, Most sites with strongly negative correlations between mutational effects on ACE2 binding and escape are at positions that could plausibly impact the RBD conformation in the context of the full spike, since they tend to be at the interface of the RBD and other spike domains. Left: all sites from a shown on spike structure as spheres. RBD is colored in light pink, NTD light blue, SD1 green and the S2 subunit in yellow. Spheres are shown on only one chain for each domain for clarity (PDB ID: 8IOU). Right: RBD sites from a shown on RBD in up position engaged with ACE2. RBD is colored in light pink and ACE2 is gray.
Extended Data Fig. 10
Extended Data Fig. 10. Correlations in absolute clade growth with absolute clade phenotypes.
a, Phylogenetic tree of XBB-descended Pango clades, colored by their relative growth rates. The tree shows only clades with at least 400 sequences and at least one new spike mutation, and their ancestors. Ancestor clades with insufficient sequences for growth rate estimates are in white. b, The same phylogeny but with branches colored by the change in growth rate between parent-descendant clade pairs. c, Correlation between clade growth estimates made using the Murrell lab multinomial logistic regression model (see methods) or a hierarchical multinomial logistic regression implemented by the Bedford lab (see https://github.com/nextstrain/forecasts-ncov/). Both sets of estimates are for clades designated after Jan-1-2023 and use the data available as of Oct-2-2023. The estimates are highly correlated, and everywhere else in this paper we report analyses using the Murrell lab estimates. d, Number of spike amino-acid mutations relative to the early Wuhan-Hu-1 virus in all SARS-CoV-2 Pango clades versus the clade designation dates. XBB-descended clades are in orange. As can be seen from this plot, newer clades tend to have more spike mutations. e, Because newer clades tend to have both more mutations and better growth, clade growth rate is trivially correlated with a clade’s relative distance (number of spike mutations) from Wuhan-Hu-1. However, this correlation is not informative as it is already known that new clades tend to have more mutations. f, If we instead correlate the change in growth rate between parent-descendant clade pairs separated by at least one spike mutation (Fig. 6b) with the change in spike mutational distance to Wuhan-Hu-1 there is no correlation, since this approach removes the co-variation with total mutation count. Therefore, simple mutation counting is not informative for predicting changes in clade growth. g, Correlations for the phenotypes measured by the full spike deep mutational scanning in the current paper; h, the phenotypes measured in yeast display RBD deep mutational scanning; i, predicted by the EVEscape method. These plots differ from Fig. 6a and Extended Data Fig. 11 in that they show the correlations in absolute clade growth with the absolute clade phenotypes, rather than comparing the changes in both for each parent-descendant clade pair. Absolute clade phenotypes are computed as the sum of mutation effects. The P-values above the plots is a one sided test that computes the fraction of times the correlation is greater than that for the actual data after randomizing the phenotypic effects among mutations. Note that the correlations are not reflective of the P-values (there can be high correlations but non-significant P-values) for the reasons noted in the main text and in e—phylogenetic correlations, and the fact that new clades have both more mutations and higher growth so that any “phenotype” that amounts to counting mutations gives a correlation in these plots. For this reason, comparing changes in clade growth to changes in spike phenotypes as done in Fig. 6a and Extended Data Fig. 11 is the correct approach to test whether a method can actually predict which new clades will be successful.
Extended Data Fig. 11
Extended Data Fig. 11. Correlations of changes in growth with various other properties of spike for XBB descended clades.
This figure shows the change in growth rate between parent-descendant clade pairs versus the change in various spike phenotypes, rather than showing the absolute clade growth and absolute spike phenotypes as in Extended Data Fig. 10. Comparing the changes removes phylogenetic correlations as discussed in the main text. a, Correlation between the changes in growth rate for parent-descendant clade pairs versus the change in each spike phenotype measured in the XBB.1.5 full-spike deep mutational scanning described in the current paper (multiple mutations are assumed to have additive effects). These panels are the same as those shown in Fig. 6a, and are re-printed here to enable easier comparison to other panels in this figure. b, Correlations of changes in clade growth with changes in site-level antibody escape, ACE2 affinity, and RBD expression measured for RBD mutations in yeast-display deep mutational scanning. c, Correlation of changes in the EVEscape score with changes in clade growth. d, Ordinary least-squares regression of changes in the yeast-display RBD deep mutational scanning phenotypes versus changes in XBB-descendant clade growth. The small text indicates the unique variance explained by each variable as well as the coefficients in the regression. e, Ordinary least squares multiple linear regression of changes in XBB-descendant clade growth rate versus all three measured spike phenotypes using the XBB.1.5 full spike deep mutational scanning. This panel is the same as Fig. 6b, and is re-printed here to enable easier comparison to other panels in this figure. All panels are labeled with the Pearson correlation (r) and a P-value which is a one-sided test determined by computing how many randomizations of the mutational data yield correlations as large as the actual one.
Extended Data Fig. 12
Extended Data Fig. 12. Correlations of changes in growth with various other properties of spike for BA.2, BA.5, and XBB descended clades.
This figure is the same as Extended Data Fig. 11 except that it includes clades descended from any of BA.2, BA.5, and XBB whereas Extended Data Fig. 11 includes just clades descended from XBB.

Update of

References

    1. Cao Y, et al. Imprinted SARS-CoV-2 humoral immunity induces convergent Omicron RBD evolution. Nature. 2023;614:521–529. - PMC - PubMed
    1. Starr TN, et al. Deep mutational scans for ACE2 binding, RBD expression, and antibody escape in the SARS-CoV-2 Omicron BA.1 and BA.2 receptor-binding domains. PLoS Pathog. 2022;18:e1010951. doi: 10.1371/journal.ppat.1010951. - DOI - PMC - PubMed
    1. Liu Y, et al. The N501Y spike substitution enhances SARS-CoV-2 infection and transmission. Nature. 2022;602:294–299. doi: 10.1038/s41586-021-04245-0. - DOI - PMC - PubMed
    1. Dadonaite B, et al. A pseudovirus system enables deep mutational scanning of the full SARS-CoV-2 spike. Cell. 2023;186:1263–1278.e20. doi: 10.1016/j.cell.2023.02.001. - DOI - PMC - PubMed
    1. Crawford KHD, et al. Protocol and reagents for pseudotyping lentiviral particles with SARS-CoV-2 spike protein for neutralization assays. Viruses. 2020;12:513. doi: 10.3390/v12050513. - DOI - PMC - PubMed

MeSH terms

Supplementary concepts

LinkOut - more resources