. 2024 Jul;631(8021):610-616.
doi: 10.1038/s41586-024-07643-2. Epub 2024 Jul 3.

Semantic encoding during language comprehension at single-cell resolution

Affiliations

Semantic encoding during language comprehension at single-cell resolution

Mohsen Jamali et al. Nature. 2024 Jul.

Abstract

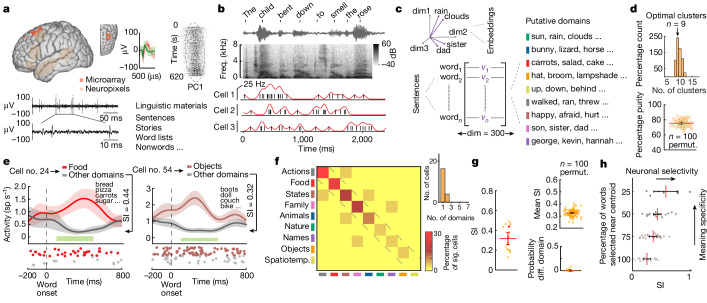
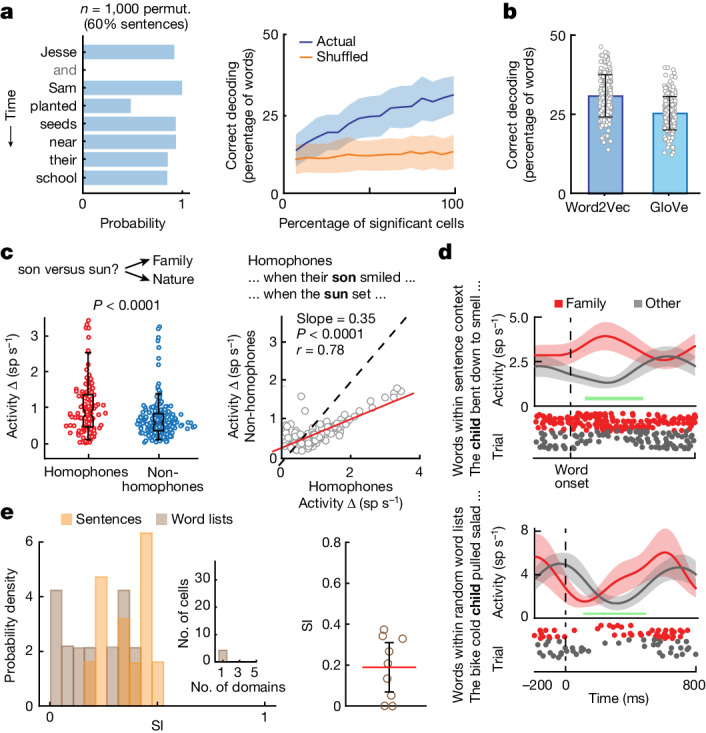
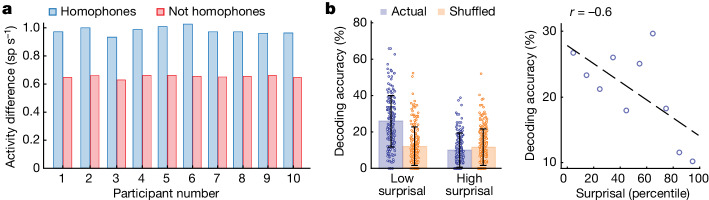
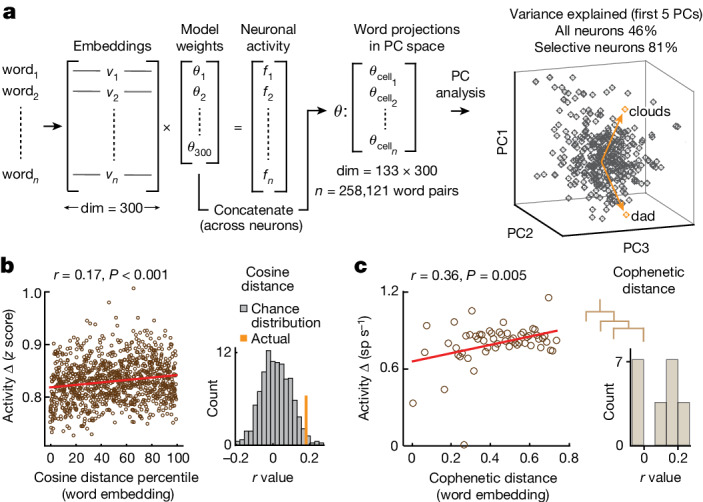
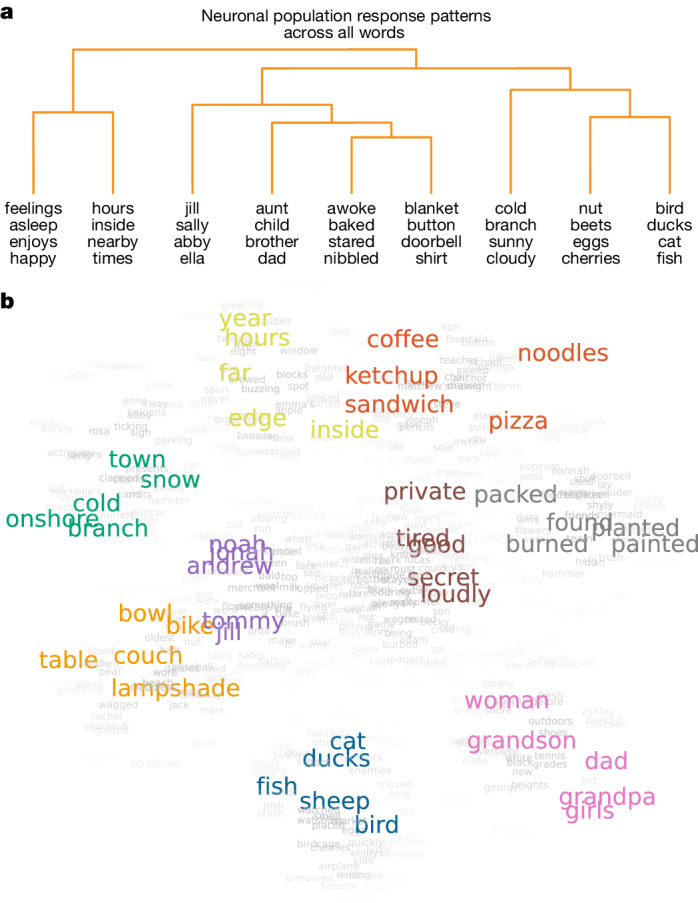
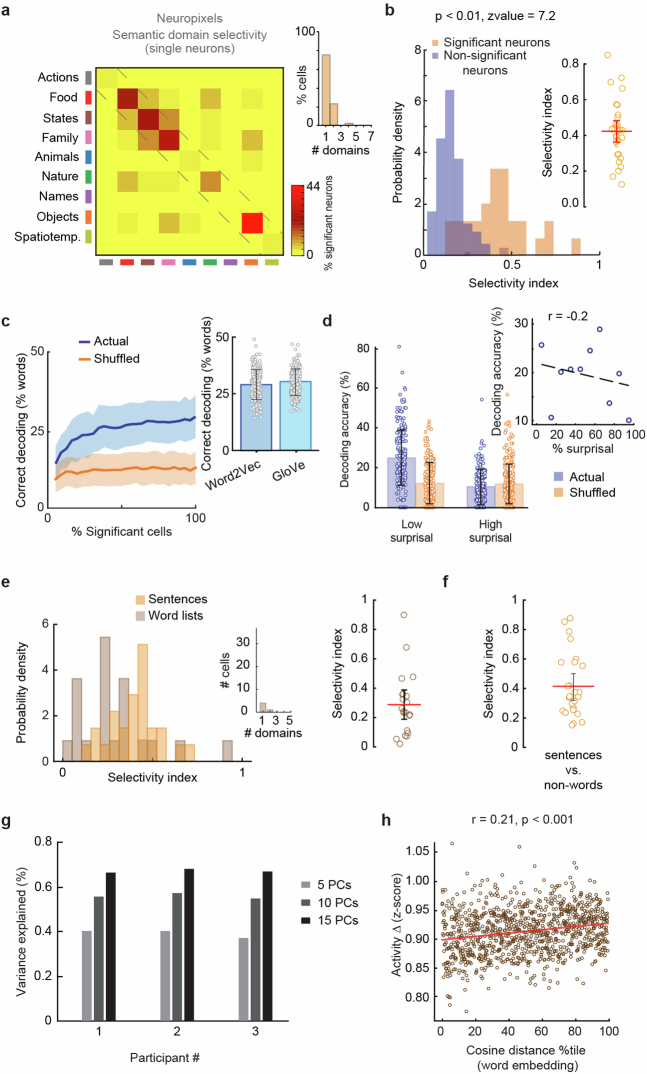
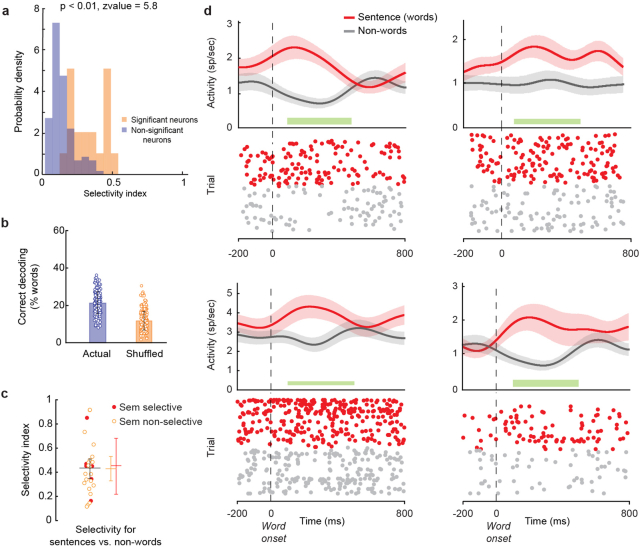
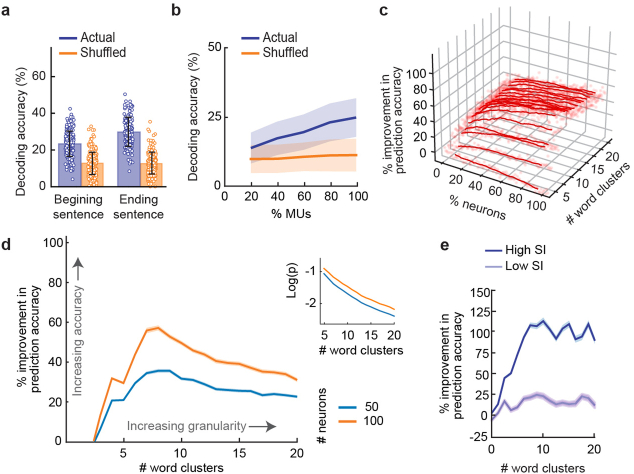
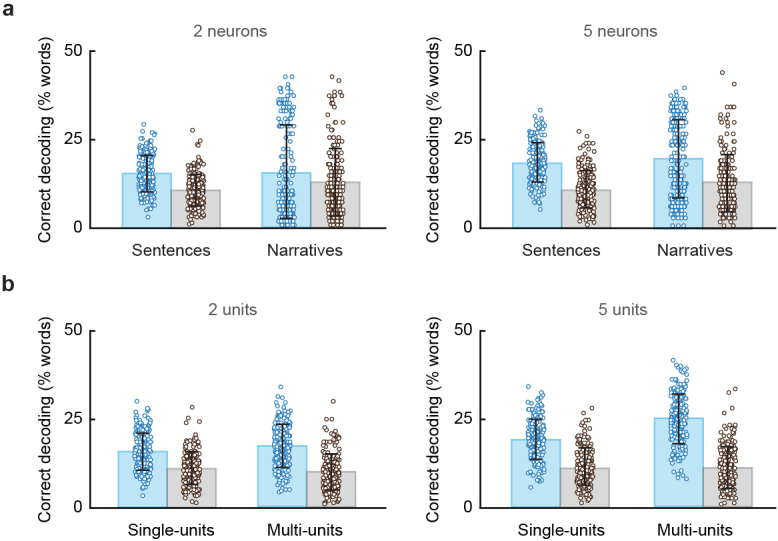
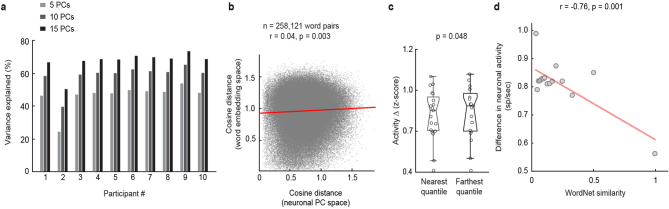
From sequences of speech sounds1,2 or letters3, humans can extract rich and nuanced meaning through language. This capacity is essential for human communication. Yet, despite a growing understanding of the brain areas that support linguistic and semantic processing4-12, the derivation of linguistic meaning in neural tissue at the cellular level and over the timescale of action potentials remains largely unknown. Here we recorded from single cells in the left language-dominant prefrontal cortex as participants listened to semantically diverse sentences and naturalistic stories. By tracking their activities during natural speech processing, we discover a fine-scale cortical representation of semantic information by individual neurons. These neurons responded selectively to specific word meanings and reliably distinguished words from nonwords. Moreover, rather than responding to the words as fixed memory representations, their activities were highly dynamic, reflecting the words' meanings based on their specific sentence contexts and independent of their phonetic form. Collectively, we show how these cell ensembles accurately predicted the broad semantic categories of the words as they were heard in real time during speech and how they tracked the sentences in which they appeared. We also show how they encoded the hierarchical structure of these meaning representations and how these representations mapped onto the cell population. Together, these findings reveal a finely detailed cortical organization of semantic representations at the neuron scale in humans and begin to illuminate the cellular-level processing of meaning during language comprehension.


Conflict of interest statement

The authors declare no competing interests.

Figures

Fig. 1
Fig. 1. Semantic selectivity by single neurons during naturalistic speech processing.
a, Left: single-neuron recordings were obtained from the left language-dominant prefrontal cortex. Recording locations for the microarray (red) and Neuropixels (beige) recordings (spm12; Extended Data Table 1) as well as an approximation of language-selective network areas (brown) are indicated. Right: the action potentials of putative neurons. b, Action potentials (black lines) and instantaneous firing rate (red trace) of each neuron were time-aligned to the onset of each word. Freq., frequency. c, Word embedding approach for identifying semantic domains. Here each word is represented as a 300-dimensional (dim) vector. d, Silhouette criterion analysis (upper) and purity measures (lower) characterized the separability and quality of the semantic domains (Extended Data Fig. 2a). permut., permutations. e, Peri-stimulus spike histograms (mean ± standard error of the mean (s.e.m.)) and rasters for two representative neurons. The horizontal green bars mark the window of analysis (100–500 ms from onset). sp, spikes. f, Left: confusion matrix illustrating the distribution of cells that exhibited selective responses to one or more semantic domains (P < 0.05, two-tailed rank-sum test, false discovery rate-adjusted). Spatiotemp., spatiotemporal.; sig. significant. Top right: numbers of cells that exhibited semantic selectivity. g, Left: SI of each neuron (n = 19) when compared across semantic domains. The SIs of two neurons are colour-coded to correspond to those shown in Fig. 1e. Upper right: mean SI across neurons when randomly selecting words from 60% of the sentences (mean SI = 0.33, CI = 0.32–0.33; across 100 iterations). Bottom right: probabilities of neurons exhibiting significant selectivity to their non-preferred semantic domains when randomly selecting words from 60% of the sentences (1.4 ± 0.5% mean ± s.e.m. different (diff.) domain). h, Relationship between increased meaning specificity (by decreasing the number of words on the basis of the words’ distance from each domain’s centroid) and response selectivity. The lines with error bars in d,g,h represent mean with 95% confidence limits.
Fig. 2
Fig. 2. Decoding word meanings during language comprehension.
a, Left: projected probabilities of correctly predicting the semantic domain to which individual words belonged over a representative sentence. Right: the cumulative decoding performance (±s.d.) of all semantically selective neurons during presentation of sentences (blue) versus chance (orange); see also Extended Data Fig. 4b. b, Decoding performances (±s.d.) across two independent embedding models (Word2Vec and GloVe). c, Left: the absolute difference in neuronal responses (n = 115) for homophone pairs that sounded the same but differed in meaning (red) compared to that of non-homophone pairs that sounded different but shared similar meanings (blue; two-sided permutation test). Right: scatter plot displaying each neuron’s absolute difference in activity for homophone versus non-homophone pairs (P < 0.0001, one-sided t-test comparing linear fit to identity line). d, Peri-stimulus spike histogram (mean ± s.e.m.) and raster from a representative neuron when hearing words within sentences (top) compared to words within random word lists (bottom). The horizontal green bars mark the window of analysis (100–500 ms from onset). e, Left: SI distributions for neurons during word-list and sentence presentations together with the number of neurons that responded selectivity to one or more semantic domains (inset). Right: the SI for neurons (mean with 95% confidence limit, n = 9; excluding zero firing rate neurons) during word-list presentation. These neurons did not exhibit changes in mean firing rates when comparing all sentences versus word lists independently of semantic domains (rank-sum test, P = 0.16).
Fig. 3
Fig. 3. Sentence context dependence and word meaning predictions.
a, Differences in neuronal activity comparing homophone (for example, ‘son’ and ‘sun’; blue) to non-homophone (for example, ‘son’ and ‘dad’; red) pairs across participants using a participant-dropping procedure (two-sided paired t-test, P < 0.001 for all participants). b, Left: decoding accuracies for words that showed high versus low surprisal based on the preceding sentence contexts in which they were heard. Words with lower surprisal were more predictable on the basis of their preceding word sequence. Actual and chance decoding performances are shown in blue and orange, respectively (mean ± s.d., one-sided rank-sum test, z value = 26, P < 0.001). Right: a regression analysis on the relation between decoding performance and surprisal.
Fig. 4
Fig. 4. Hierarchical semantic relationship between word representations.
a, Left: the activity of each neuron was regressed onto 300-dimensional word embedding vectors. A PC analysis was then used to dimensionally reduce this space from the concatenated set model parameters such that the cosine distance between each projection reflected the semantic relationship between words as represented by the neural population. Right: PC space with arrows highlighting two representative word projections. The explained variance and correlation between cosine distances for word projections derived from the word embedding space versus neural data (n = 258,121 possible word pairs) are shown in Extended Data Fig. 7a,b. b, Left: activities of neurons for word pairs based on their vectoral cosine distance within the 300-dimensional embedding space (z-scored activity change over percentile cosine similarity, red regression line; Pearson’s correlation, r = 0.17). Right: correlation between vectoral cosine distances in the word embedding space and difference in neuronal activity across possible word pairs (orange) versus chance distribution (grey, n = 1,000, P = 0.02; Extended Data Fig. 7c). c, Left: scatter plot showing the correlation between population-averaged neuronal activity and the cophenetic distances between words (n = 100 bins) derived from the word embedding space (red regression line; Pearson’s correlation, r = 0.36). Right: distribution of correlations between cophenetic distances and neuronal activity across the different participants (n = 10).
Fig. 5
Fig. 5. Organization of semantic representations within the cell population.
a, An agglomerative hierarchical clustering procedure was carried out on all word projections in PC space obtained from the neuronal population data. The dendrogram shows representative word projections, with the branches truncated to allow for visualization. Words that were connected by fewer links in the hierarchy have a smaller cophenetic distance. b, A t-stochastic neighbour embedding procedure was used to visualize all word projections (in grey) by collapsing them onto a common two-dimensional manifold. For comparison, representative words are further colour-coded on the basis of their original semantic domain assignments in Fig. 1c.
Extended Data Fig. 1
Extended Data Fig. 1. Language-related activity, recording stability, waveform morphology and isolation quality across recording techniques.
a, Example of waveform morphologies displaying mean waveform ± 3 s.d and associated PC distributions used to isolate putative units from the tungsten microarray recordings. The horizontal bar indicates a 500 µs interval for scale. The gray areas in PC space represent noise. All single units recorded from the same electrode were required to display a high degree of separation in PC space. b, Isolation metrics of the single units obtained from the tungsten microarray recordings. c, Left, waveform morphologies observed across contacts in a Neuropixels array. Right, PC distributions used to isolate and cluster single units. d, Isolation distance and nearest neighbor noise overlap of the recorded units obtained from the Neuropixels arrays.
Extended Data Fig. 2
Extended Data Fig. 2. Cluster separability and consistency of neuronal responses across participants.
a, The d’ (d-prime) indices measuring separability between the distribution of the vectoral cosine distances among all words within a cluster (purple) and those among all words across clusters (gray). The d’ indices were all above 2.5 reflecting strong separability. b, Selectivity index of neurons (mean with 95% CL, n = 19) when semantic domains were refined by moving or removing words whose meanings did not intuitively fit with their respective labels (Extended Data Table 2). c, There was no significant difference (χ2 = 2.33, p = 0.31) in the proportions of neurons that displayed semantic selectivity based on the participants’ clinical conditions of essential tremor (ET), Parkinson’s disease (PD) or cervical dystonia (CD). d, Left, the proportional contribution per participant based on the total percentage of neurons contributed. Right, the proportional contribution of semantically selective cells per participant based on the fraction contributed. Participants without selective cells are not shown. e, A leave one out cross-validation participant-dropping procedure demonstrated that population results remained similar. Here, we sequentially removed individual participants (i.e., participants #1-10) and then repeated our selectivity analysis. Semantic selectivity across neurons was largely unaffected by removal of any of the participants (one-way ANOVA, F(9, 44) = 0.11, p = 0.99). Here, the mean selectivity indices (± s.e.m.) are separately presented after removing each participant. f, A cross-validation participant-dropping procedure was used to determine whether any of the participants disproportionately contributed to the population decoding. Average decoding results and comparison to the shuffled data are separately presented after removing each participant (permutation test, p < 0.01; #1-10).
Extended Data Fig. 3
Extended Data Fig. 3. Confirming consistency of semantic representations by neurons using Neuropixels recordings.
a, Coincidence matrix illustrating the distribution of cells obtained from Neuropixels recordings that displayed selective responses to one or more semantic domains (two-tailed rank-sum test, p < 0.05, FDR adjusted). Inset, proportions of cells that displayed selective responses to one or more semantic domains. b, The distributions of SIs are shown separately for semantically-selective (n = 29, orange) and non-selective (n = 125, grey) cells. The mean SI of cells that did not display semantic selectivity (n = 125) was 0.16 (one-sided rank-sum test, z-value = 7.2, p < 0.0001). Inset, selectivity index (SI) of each neuron (n = 29) when compared across different semantic domains. c, The cumulative decoding performance (± s.d.) of all semantically selective neurons during sentences (blue) versus chance (orange). Inset, decoding performances (± s.d.) across two independent embedding models (Word2Vec and GloVe). d, Decoding accuracies for words that displayed high vs. low surprisal based on the preceding sentence contexts in which they were heard. Actual and chance decoding performances are shown in blue and orange, respectively (mean ± s.d., one-sided rank-sum test z-value = 25, p < 0.001). The inset shows a regression analysis on the relation between decoding performance and surprisal. e, Left, SI distributions for neurons during word list and sentence presentations together with the number of neurons that responded selectivity to one or more semantic domains (Inset). Right, the SI for neurons (mean with 95% CL, n = 21; excluding zero firing rate neurons) during word-list presentation. The SI dropped from 0.39 (CI = 0.33-0.45) during the sentences to 0.29 (CI = 0.19-0.39) during word list presentation (signed-rank test, z(41) = 168, p = 0.035). f, The selectivity index of neurons for which nonword lists presentation was performed (n = 26 of 153 cells were selective) when comparing their activities during sentences vs. nonwords (mean SI = 0.34, CI = 0.28-0.40). Here, the selectivity of each neuron reflects the degree to which it differentiates any semantic (meaningful) compared to non-semantic (nonmeaningful) information. g, Contribution to the variance explained in PC space for word projections across participants using a participant-dropping procedure. h, Activities of neurons for word pairs based on their vectoral cosine distance within the 300-dimensional embedding space (z-scored activity change over percentile cosine similarity; Pearson’s correlation r = 0.21, p < 0.001).
Extended Data Fig. 4
Extended Data Fig. 4. Selectivity of neurons to linguistically meaningful versus nonmeaningful information.
a, The distributions of SIs are shown separately for cells that displayed significance for semantic information (n = 19, orange) and those that did not (n = 114, grey). The mean SI of cells that did not display semantic selectivity (n = 114) was 0.14 (one-sided rank-sum test, z-value = 5.8, p < 0.0001). b, Decoding performances (mean ± s.d.) for cells that were not significantly selective for any particular semantic domain but which had an SI greater than 0.2 (n = 11) compared to that of shuffled data (21 ± 6%; permutation test, p = 0.046). c, The selectivity index of neurons for which nonword lists presentation was performed (n = 27 of 48 cells for which this control was performed displayed a significant difference in activity using a two-sided t-test) when comparing their responses to nonwords (i.e., that carried no linguistic meaning) versus sentences (i.e., that carried linguistic meaning; mean SI = 0.43, CI = 0.35-0.51). The semantically selective cells (n = 6, red) displayed a similar word vs. nonword SI when compared to the non-semantically selective cells (n = 21, orange; two-sided t-test, df = 26, p = 1.0). d, Peristimulus histograms (mean ± s.e.m.) and rasters of representative neurons when the participants were given words heard within sentences (red) or sets of nonwords (gray). The horizontal green bars display the 400 ms window of analysis.
Extended Data Fig. 5
Extended Data Fig. 5. Generalizability and robustness of word meaning representations.
a, Average decoding performances (± s.d., purple, n = 1000 iterations) were found to be slightly lower for words heard early (first 4 words) vs. late (last 4 words) within their respective sentences (23 ± 7% vs. 29 ± 8% decoding performance, respectively; One-sided rank sum test, z-value = 17, p < 0.001),. The orange bars represent control accuracy with shuffling neuronal activities. b, Cumulative mean decoding performance (±s.d., purple) for multi-units (MUs) compared with chance (orange). The mean decoding accuracy for all MUs was 23 ± 6% s.d. (one-sided permutation test, p = 0.02) and reflect the unsorted activities of units obtained through recordings (Methods). c, Relationship between the number of neurons considered, the number of word clusters modeled, and prediction accuracy. Here, a lower number of clusters leads to more words per grouping and therefore domains that are not as specific in meaning (e.g., “sun”, “rain”, “clouds”, and “sky”,) whereas a higher number of clusters means fewer words and therefore domains that are more specific in meaning (e.g., “rain” and “clouds”). d, The percent improvement in decoding accuracy (mean ± s.e.m) corresponds to decoding performance minus chance probability using 60% of randomly selected sentences for modeling and 40% for decoding (n = 200 iterations). Inset, relation between log of odds probability (mean ± s.e.m) of predicting the correct semantic domains and number of clusters (i.e., not accounting for chance probability). e, The relation between the number of word clusters modeled and the percent improvement in decoding accuracy (mean ± s.e.m) when considering semantically selective (high SI) and non-selective (low SI) cells separately.
Extended Data Fig. 6
Extended Data Fig. 6. Semantic selectivity during naturalistic story narratives.
a, Comparison of average decoding performances (± s.d., blue, n = 200 iterations) for sentences and naturalistic story narratives, matched based on the number of neurons (left: 2 neurons, right: 5 neurons). b, Comparison of average decoding performances (± s.d., blue, n = 200 iterations) for sentences, matched based on the number of single-units or multi-units (left: 2 units, right: 5 units). Chance decoding performances are given in gray.
Extended Data Fig. 7
Extended Data Fig. 7. Population organization of semantic representations.
a, Contribution to percent variance explained in PC space for word projections across participants using a participant-dropping procedure (first 5-15 PCs; two-sided z-test; p > 0.7). b, Correlation between the vectoral cosine distances between PC-reduced word-projections derived from the neural data and PC-reduced vectors derived from the 300-dimensional word embedding space (n = 258,121 possible word-pairs; note that not all pairs were used for all recordings per neuron since certain words were not heard by all participants). c, Difference in neuronal activities (n = 19 neurons, p = 0.048, two-sided paired t-test, t(18) = 2.12) for word pairs whose vectoral cosine distances were far versus near in the word embedding space. d, Relation between neuronal activity and word meaning similarity using a non-embedding based ‘synset’ approach (n = 100 bins, Pearson’s correlation r = −0.76, p = 0.001). Here, the degree of similarity ranges from 0 to 1.0, with a value of 1.0 indicating that the words are highly similar in meaning (e.g., “canine” and “dog”) and 0 indicating that their meanings are largely distinct.

Similar articles

Cited by

References

    1. Mesgarani N, Cheung C, Johnson K, Chang EF. Phonetic feature encoding in human superior temporal gyrus. Science. 2014;343:1006–1010. doi: 10.1126/science.1245994. - DOI - PMC - PubMed
    1. Theunissen FE, Elie JE. Neural processing of natural sounds. Nat. Rev. Neurosci. 2014;15:355–366. doi: 10.1038/nrn3731. - DOI - PubMed
    1. Baker CI, et al. Visual word processing and experiential origins of functional selectivity in human extrastriate cortex. Proc. Natl Acad. Sci. USA. 2007;104:9087–9092. doi: 10.1073/pnas.0703300104. - DOI - PMC - PubMed
    1. Fedorenko E, Nieto-Castanon A, Kanwisher N. Lexical and syntactic representations in the brain: an fMRI investigation with multi-voxel pattern analyses. Neuropsychologia. 2012;50:499–513. doi: 10.1016/j.neuropsychologia.2011.09.014. - DOI - PMC - PubMed
    1. Humphries C, Binder JR, Medler DA, Liebenthal E. Syntactic and semantic modulation of neural activity during auditory sentence comprehension. J. Cogn. Neurosci. 2006;18:665–679. doi: 10.1162/jocn.2006.18.4.665. - DOI - PMC - PubMed

LinkOut - more resources