

Effect of dynamic exclusion and the use of FAIMS, DIA and MALDI-mass spectrometry imaging with ion mobility on amyloid protein identification
- PMID: 38961380
- PMCID: PMC11223398
- DOI: 10.1186/s12014-024-09500-w
Effect of dynamic exclusion and the use of FAIMS, DIA and MALDI-mass spectrometry imaging with ion mobility on amyloid protein identification
Abstract
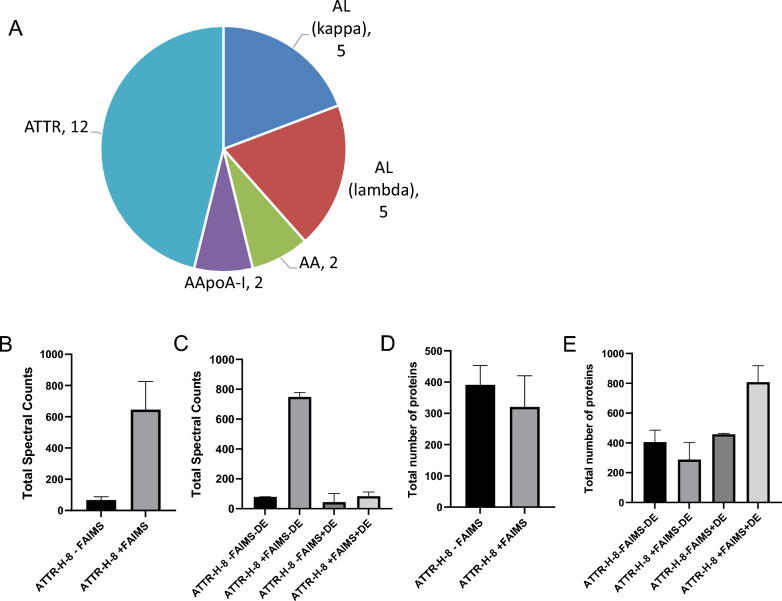
Amyloidosis is a disease characterized by local and systemic extracellular deposition of amyloid protein fibrils where its excessive accumulation in tissues and resistance to degradation can lead to organ failure. Diagnosis is challenging because of approximately 36 different amyloid protein subtypes. Imaging methods like immunohistochemistry and the use of Congo red staining of amyloid proteins for laser capture microdissection combined with liquid chromatography tandem mass spectrometry (LMD/LC-MS/MS) are two diagnostic methods currently used depending on the expertise of the pathology laboratory. Here, we demonstrate a streamlined in situ amyloid peptide spatial mapping by Matrix Assisted Laser Desorption Ionization-Mass Spectrometry Imaging (MALDI-MSI) combined with Trapped Ion Mobility Spectrometry for potential transthyretin (ATTR) amyloidosis subtyping. While we utilized the standard LMD/LC-MS/MS workflow for amyloid subtyping of 31 specimens from different organs, we also evaluated the potential introduction in the MS workflow variations in data acquisition parameters like dynamic exclusion, or testing Data Dependent Acquisition combined with High-Field Asymmetric Waveform Ion Mobility Spectrometry (DDA FAIMS) versus Data Independent Acquisition (DIA) for enhanced amyloid protein identification at shorter acquisition times. We also demonstrate the use of Mascot's Error Tolerant Search and PEAKS de novo sequencing for the sequence variant analysis of amyloidosis specimens.
Keywords: Amyloidosis; DDA; DIA; FAIMS; Laser capture microdissection; Light chain amyloidosis; MALDI-MSI; Transthyretin amyloidosis.
© 2024. The Author(s).
Conflict of interest statement
Drs. Joshua Fischer, Cristina Silvescu, and Shannon Cornett work for the company Bruker, which commercializes the instrumentation utilized for Figure 6.
Figures


Similar articles
-
Pathology and Proteomics-Based Diagnosis of Localized Light-Chain Amyloidosis in Dogs and Cats.Vet Pathol. 2020 Sep;57(5):658-665. doi: 10.1177/0300985820934113. Epub 2020 Jun 17. Vet Pathol. 2020. PMID: 32880234
-
Imaging mass spectrometry analysis of renal amyloidosis biopsies reveals protein co-localization with amyloid deposits.Anal Bioanal Chem. 2015 Jul;407(18):5323-31. doi: 10.1007/s00216-015-8689-z. Epub 2015 May 3. Anal Bioanal Chem. 2015. PMID: 25935672
-
MALDI Mass Spectrometry Imaging: A Novel Tool for the Identification and Classification of Amyloidosis.Proteomics. 2017 Nov;17(22):1700236. doi: 10.1002/pmic.201700236. Proteomics. 2017. PMID: 28994248 Free PMC article.
-
[Amyloid typing from formalin-fixed paraffin-embedded tissues using LMD-LC-MS/MS system].Rinsho Byori. 2014 Mar;62(3):291-6. Rinsho Byori. 2014. PMID: 24800507 Review. Japanese.
-
[New advances in the subtyping of systemic amyloidosis].Zhongguo Shi Yan Xue Ye Xue Za Zhi. 2014 Feb;22(1):259-62. doi: 10.7534/j.issn.1009-2137.2014.01.052. Zhongguo Shi Yan Xue Ye Xue Za Zhi. 2014. PMID: 24598691 Review. Chinese.
Cited by
-
Mass Spectrometry-Based Proteomics in Clinical Diagnosis of Amyloidosis and Multiple Myeloma: A Review (2012-2024).J Mass Spectrom. 2025 Mar;60(3):e5116. doi: 10.1002/jms.5116. J Mass Spectrom. 2025. PMID: 39967472 Free PMC article. Review.
References
LinkOut - more resources
Full Text Sources
Research Materials