

Targeted metabolomics identifies accurate CSF metabolite biomarkers for the differentiation between COVID-19 with neurological involvement and CNS infections with neurotropic viral pathogens
- PMID: 38961383
- PMCID: PMC11223383
- DOI: 10.1186/s12967-024-05422-1
Targeted metabolomics identifies accurate CSF metabolite biomarkers for the differentiation between COVID-19 with neurological involvement and CNS infections with neurotropic viral pathogens
Abstract
Background: COVID-19 is primarily considered a respiratory tract infection, but it can also affect the central nervous system (CNS), which can result in long-term sequelae. In contrast to CNS infections by classic neurotropic viruses, SARS-CoV-2 is usually not detected in cerebrospinal fluid (CSF) from patients with COVID-19 with neurological involvement (neuro-COVID), suggesting fundamental differences in pathogenesis.
Methods: To assess differences in CNS metabolism in neuro-COVID compared to CNS infections with classic neurotropic viruses, we applied a targeted metabolomic analysis of 630 metabolites to CSF from patients with (i) COVID-19 with neurological involvement [n = 16, comprising acute (n = 13) and post-COVID-19 (n = 3)], (ii) viral meningitis, encephalitis, or myelitis (n = 10) due to herpes simplex virus (n = 2), varicella zoster virus (n = 6), enterovirus (n = 1) and tick-borne encephalitis virus (n = 1), and (iii) aseptic neuroinflammation (meningitis, encephalitis, or myelitis) of unknown etiology (n = 21) as additional disease controls.
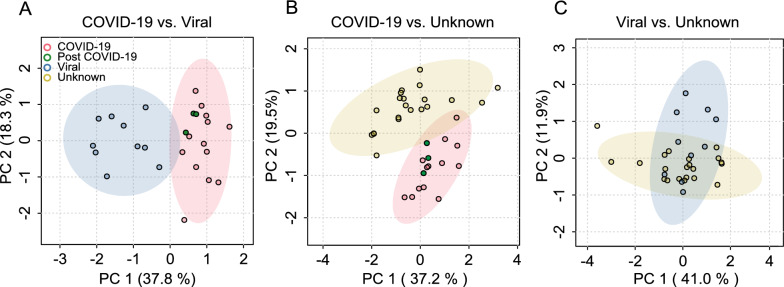
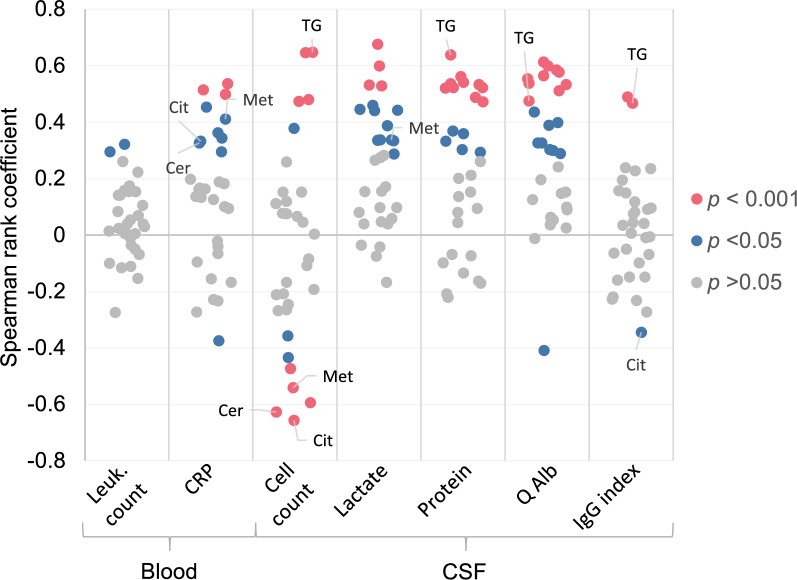
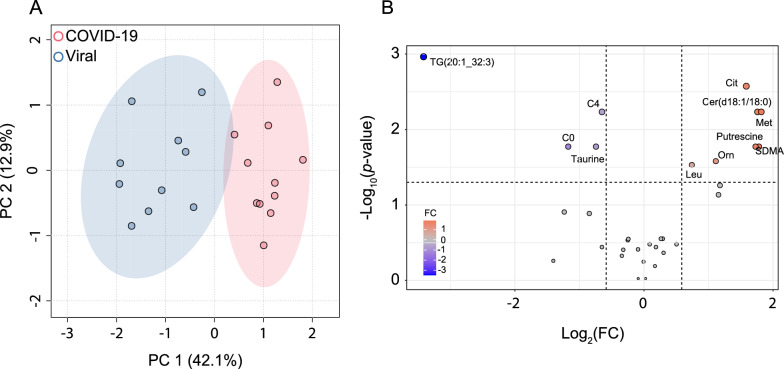
Results: Standard CSF parameters indicated absent or low neuroinflammation in neuro-COVID. Indeed, CSF cell count was low in neuro-COVID (median 1 cell/µL, range 0-12) and discriminated it accurately from viral CNS infections (AUC = 0.99) and aseptic neuroinflammation (AUC = 0.98). 32 CSF metabolites passed quality assessment and were included in the analysis. Concentrations of differentially abundant (fold change ≥|1.5|, FDR ≤ 0.05) metabolites were both higher (9 and 5 metabolites) and lower (2 metabolites) in neuro-COVID than in the other two groups. Concentrations of citrulline, ceramide (d18:1/18:0), and methionine were most significantly elevated in neuro-COVID. Remarkably, triglyceride TG(20:1_32:3) was much lower (mean fold change = 0.09 and 0.11) in neuro-COVID than in all viral CNS infections and most aseptic neuroinflammation samples, identifying it as highly accurate biomarker with AUC = 1 and 0.93, respectively. Across all samples, TG(20:1_32:3) concentration correlated only moderately with CSF cell count (ρ = 0.65), protein concentration (ρ = 0.64), and Q-albumin (ρ = 0.48), suggesting that its low levels in neuro-COVID CSF are only partially explained by less pronounced neuroinflammation.
Conclusions: The results suggest that CNS metabolite responses in neuro-COVID differ fundamentally from viral CNS infections and aseptic neuroinflammation and may be used to discover accurate diagnostic biomarkers in CSF and to gain insights into differences in pathophysiology between neuro-COVID, viral CNS infections and aseptic neuroinflammation.
Keywords: Biomarker; COVID-19; Ceramides; Cerebrospinal fluid; Diagnosis; Encephalitis; Long COVID; Long-COVID; Meningitis; Metabolism; Neuroinflammation; SARS-CoV-2; Triglycerides.
© 2024. The Author(s).
Conflict of interest statement
None of the authors have a competing interest relating to conduct of the study or publication of the manuscript.
Figures


Similar articles
-
Elevated phospholipids and acylcarnitines C4 and C5 in cerebrospinal fluid distinguish viral CNS infections from autoimmune neuroinflammation.J Transl Med. 2023 Nov 2;21(1):776. doi: 10.1186/s12967-023-04637-y. J Transl Med. 2023. PMID: 37919735 Free PMC article.
-
Mass-spectrometric profiling of cerebrospinal fluid reveals metabolite biomarkers for CNS involvement in varicella zoster virus reactivation.J Neuroinflammation. 2018 Jan 17;15(1):20. doi: 10.1186/s12974-017-1041-0. J Neuroinflammation. 2018. PMID: 29343258 Free PMC article.
-
Elevated Free Phosphatidylcholine Levels in Cerebrospinal Fluid Distinguish Bacterial from Viral CNS Infections.Cells. 2021 May 6;10(5):1115. doi: 10.3390/cells10051115. Cells. 2021. PMID: 34066349 Free PMC article.
-
Acute viral infections of the central nervous system in immunocompetent adults: diagnosis and management.Drugs. 2013 Feb;73(2):131-58. doi: 10.1007/s40265-013-0007-5. Drugs. 2013. PMID: 23377760 Review.
-
Neurochemical biomarkers to study CNS effects of COVID-19: A narrative review and synthesis.J Neurochem. 2021 Oct;159(1):61-77. doi: 10.1111/jnc.15459. Epub 2021 Aug 20. J Neurochem. 2021. PMID: 34170549 Free PMC article. Review.
Cited by
-
Metabolomic Profiling of Cerebrospinal Fluid Reveals Metabolite Biomarkers in Tick-Borne Encephalitis Patient.J Med Virol. 2024 Nov;96(11):e70082. doi: 10.1002/jmv.70082. J Med Virol. 2024. PMID: 39569456 Free PMC article.
-
Cerebrospinal fluid metabolomics, lipidomics and serine pathway dysfunction in myalgic encephalomyelitis/chronic fatigue syndroome (ME/CFS).Sci Rep. 2025 Mar 3;15(1):7381. doi: 10.1038/s41598-025-91324-1. Sci Rep. 2025. PMID: 40025157 Free PMC article.
-
Recent advances in diagnostic technologies for postoperative central nervous system infections: a review.Neurol Sci. 2025 Jun 2. doi: 10.1007/s10072-025-08279-4. Online ahead of print. Neurol Sci. 2025. PMID: 40455288 Review.
References
MeSH terms
Substances
LinkOut - more resources
Full Text Sources
Medical
Miscellaneous
