

Integrating lipid metabolite analysis with MRI-based transformer and radiomics for early and late stage prediction of oral squamous cell carcinoma
- PMID: 38961418
- PMCID: PMC11221018
- DOI: 10.1186/s12885-024-12533-x
Integrating lipid metabolite analysis with MRI-based transformer and radiomics for early and late stage prediction of oral squamous cell carcinoma
Abstract
Background: Oral Squamous Cell Carcinoma (OSCC) presents significant diagnostic challenges in its early and late stages. This study aims to utilize preoperative MRI and biochemical indicators of OSCC patients to predict the stage of tumors.
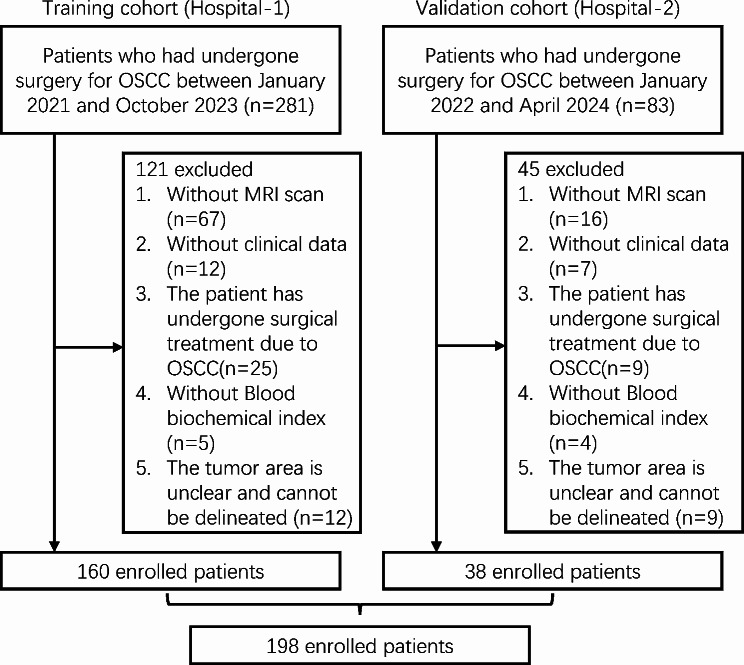
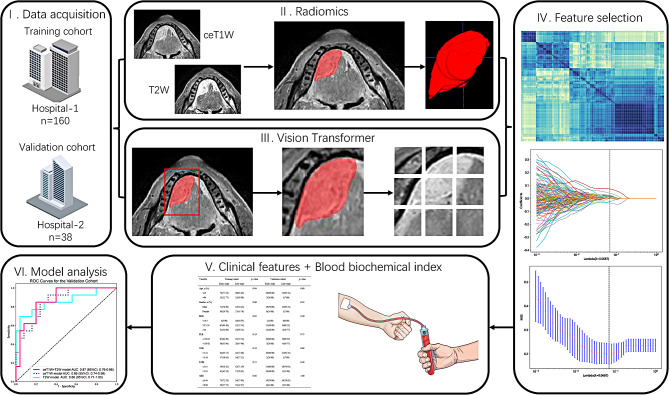
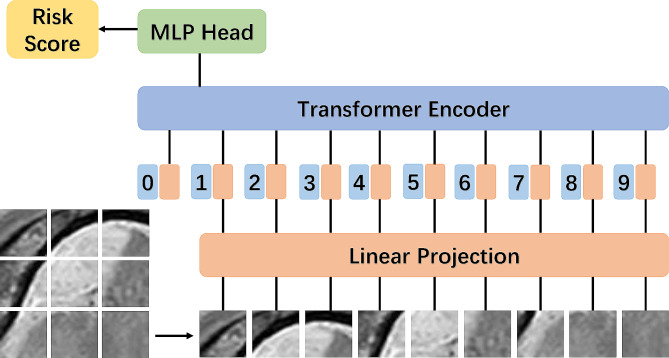
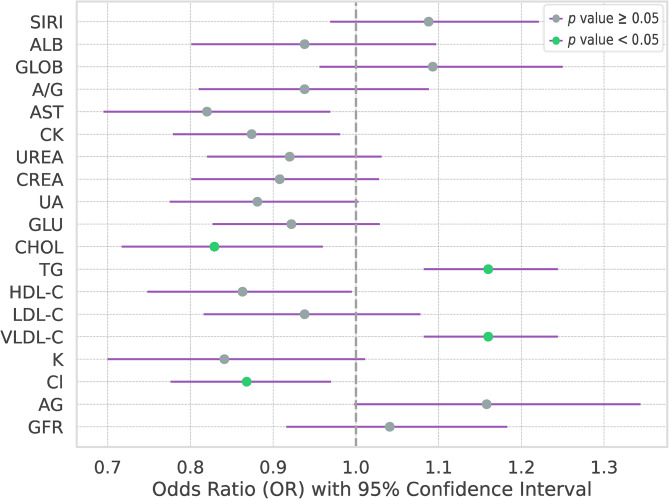
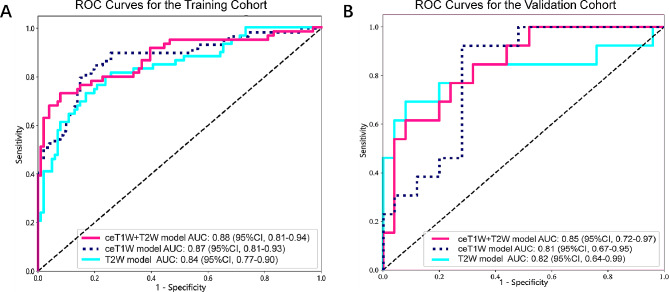
Methods: This study involved 198 patients from two medical centers. A detailed analysis of contrast-enhanced T1-weighted (ceT1W) and T2-weighted (T2W) MRI were conducted, integrating these with biochemical indicators for a comprehensive evaluation. Initially, 42 clinical biochemical indicators were selected for consideration. Through univariate analysis and multivariate analysis, only those indicators with p-values less than 0.05 were retained for model development. To extract imaging features, machine learning algorithms in conjunction with Vision Transformer (ViT) techniques were utilized. These features were integrated with biochemical indicators for predictive modeling. The performance of model was evaluated using the Receiver Operating Characteristic (ROC) curve.
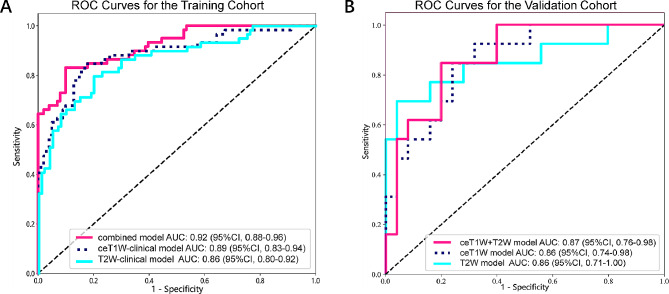
Results: After rigorously screening biochemical indicators, four key markers were selected for the model: cholesterol, triglyceride, very low-density lipoprotein cholesterol and chloride. The model, developed using radiomics and deep learning for feature extraction from ceT1W and T2W images, showed a lower Area Under the Curve (AUC) of 0.85 in the validation cohort when using these imaging modalities alone. However, integrating these biochemical indicators improved the model's performance, increasing the validation cohort AUC to 0.87.
Conclusion: In this study, the performance of the model significantly improved following multimodal fusion, outperforming the single-modality approach.
Clinical relevance statement: This integration of radiomics, ViT models, and lipid metabolite analysis, presents a promising non-invasive technique for predicting the staging of OSCC.
Keywords: Lipid metabolism; Oral squamous cell carcinoma; Radiomics; Vision Transformer.
© 2024. The Author(s).
Conflict of interest statement
The authors declare that they have no known competing financial interests or personal relationships that could have appeared to influence the work reported in this paper.
None declared.
Figures
References
MeSH terms
Substances
Grants and funding
LinkOut - more resources
Full Text Sources
Medical
