. 2024 Jul 3;21(1):169.
doi: 10.1186/s12974-024-03161-0.

Integrating single-nucleus RNA sequencing and spatial transcriptomics to elucidate a specialized subpopulation of astrocytes, microglia and vascular cells in brains of mouse model of lipopolysaccharide-induced sepsis-associated encephalopathy

Affiliations

Integrating single-nucleus RNA sequencing and spatial transcriptomics to elucidate a specialized subpopulation of astrocytes, microglia and vascular cells in brains of mouse model of lipopolysaccharide-induced sepsis-associated encephalopathy

Yanyan Zhu et al. J Neuroinflammation. .

Abstract

Background: Understanding the mechanism behind sepsis-associated encephalopathy (SAE) remains a formidable task. This study endeavors to shed light on the complex cellular and molecular alterations that occur in the brains of a mouse model with SAE, ultimately unraveling the underlying mechanisms of this condition.

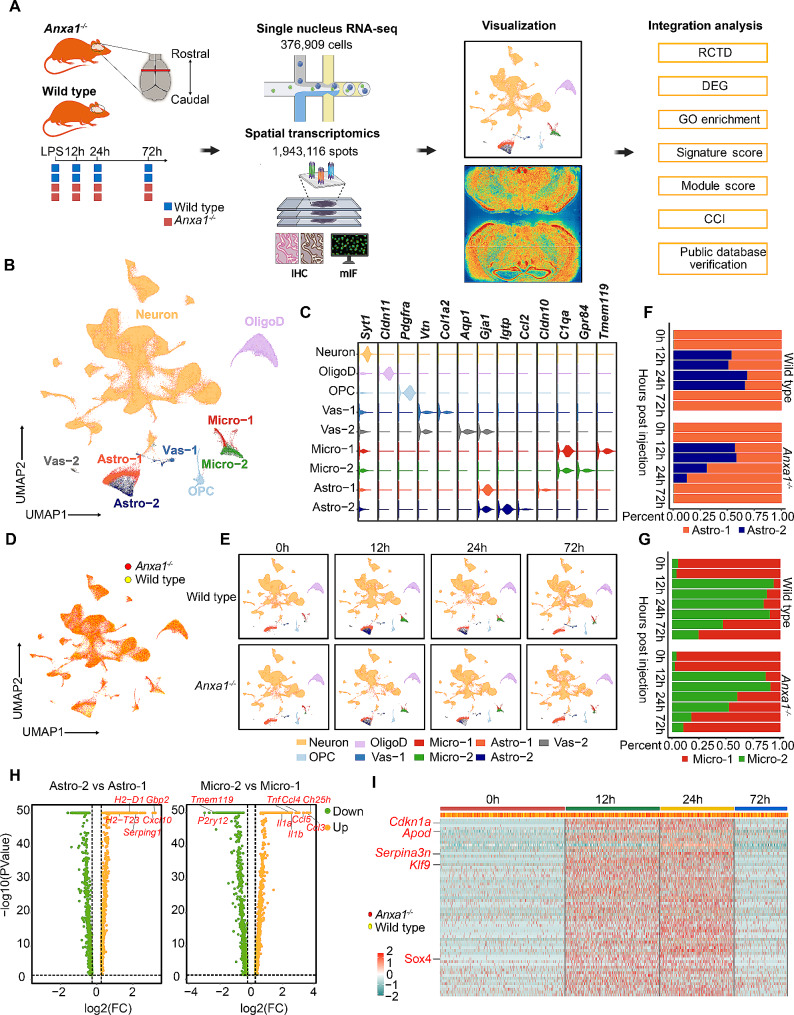
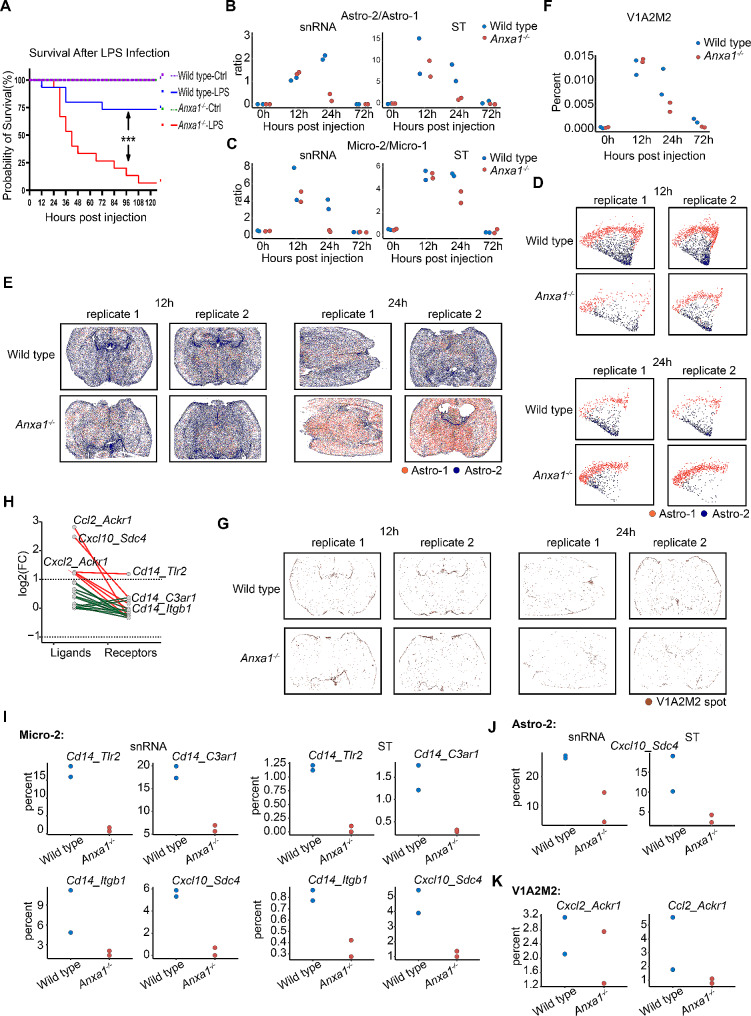
Methods: We established a murine model using intraperitoneal injection of lipopolysaccharide (LPS) in wild type and Anxa1-/- mice and collected brain tissues for analysis at 0-hour, 12-hour, 24-hour, and 72-hour post-injection. Utilizing advanced techniques such as single-nucleus RNA sequencing (snRNA-seq) and Stereo-seq, we conducted a comprehensive characterization of the cellular responses and molecular patterns within the brain.

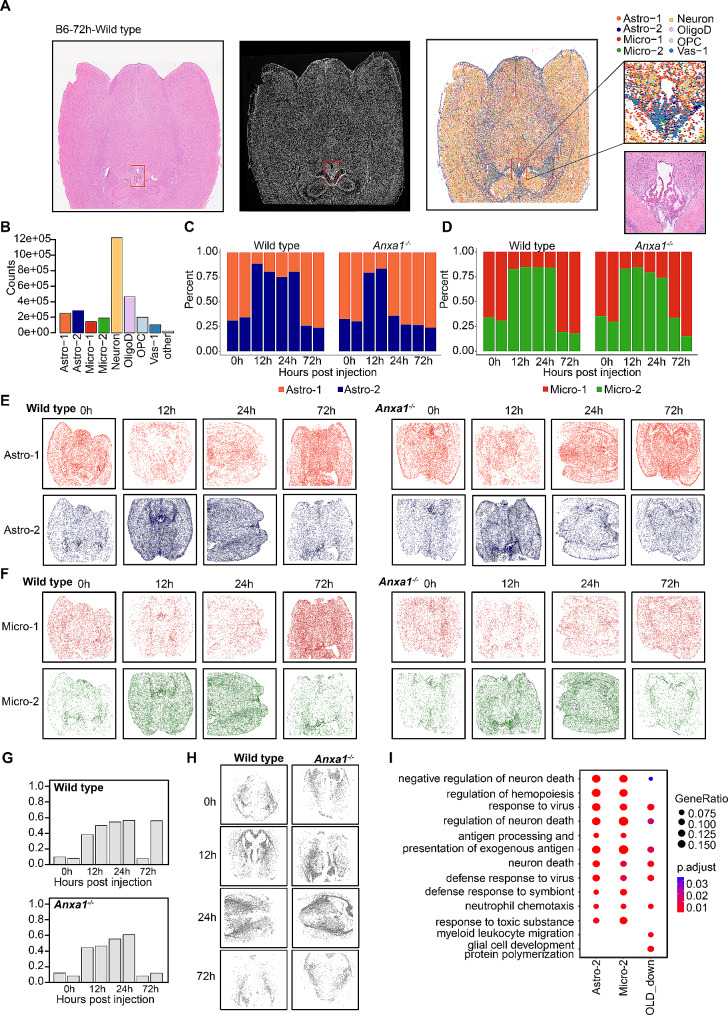
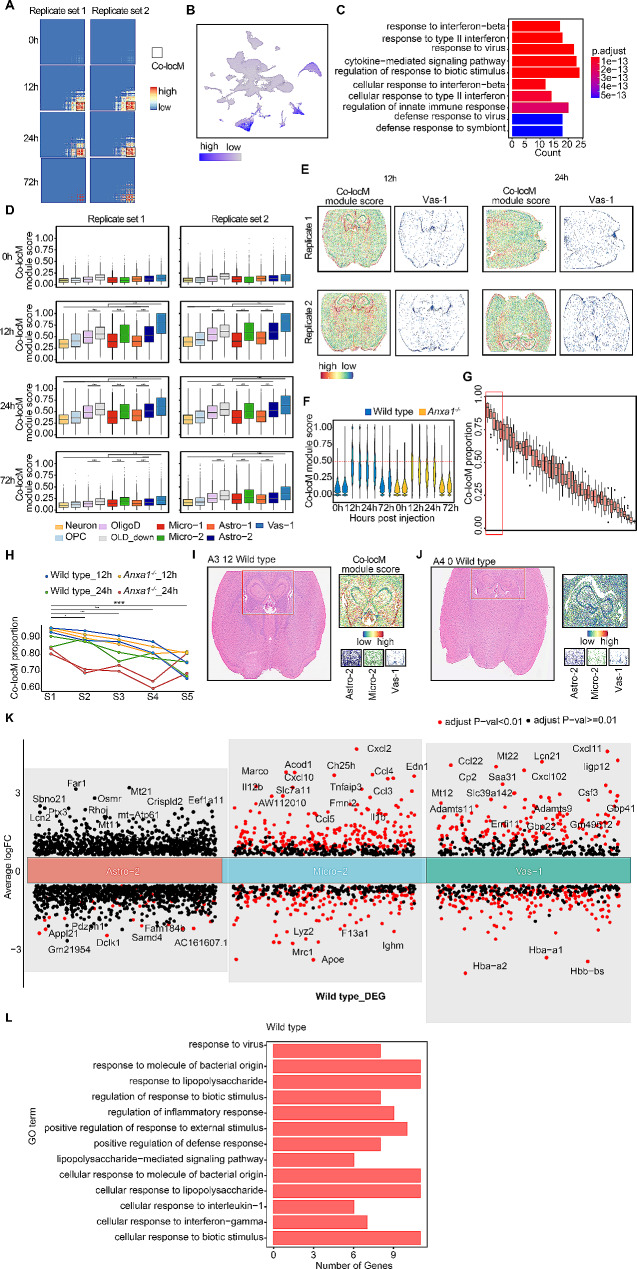
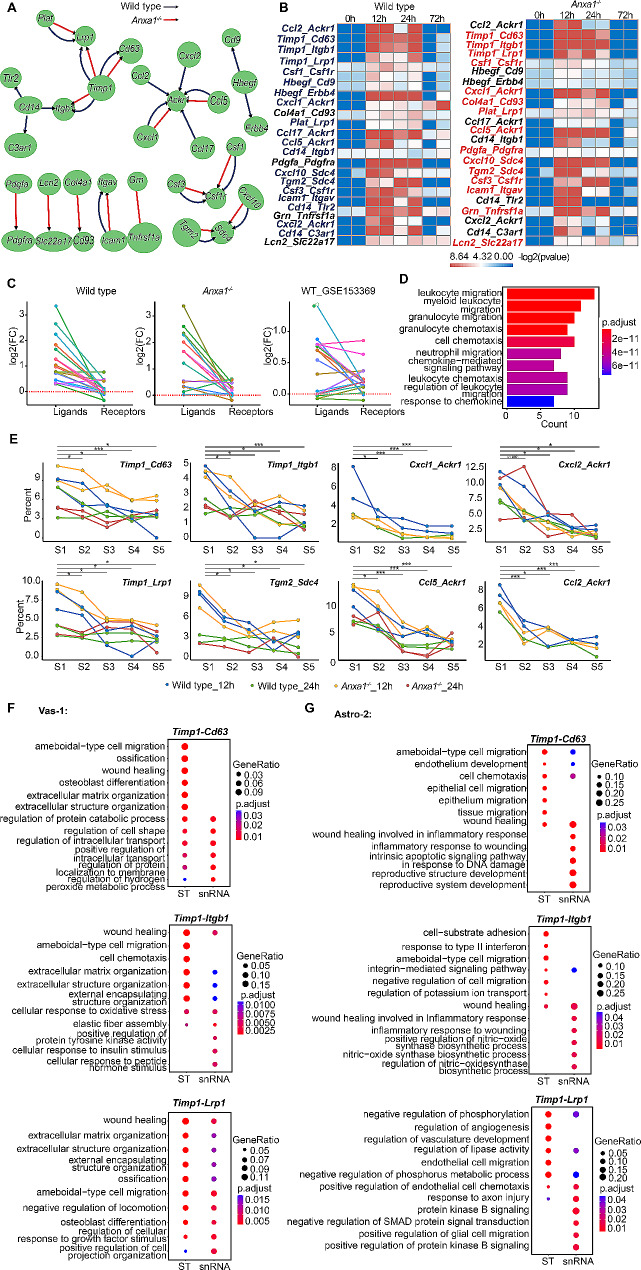
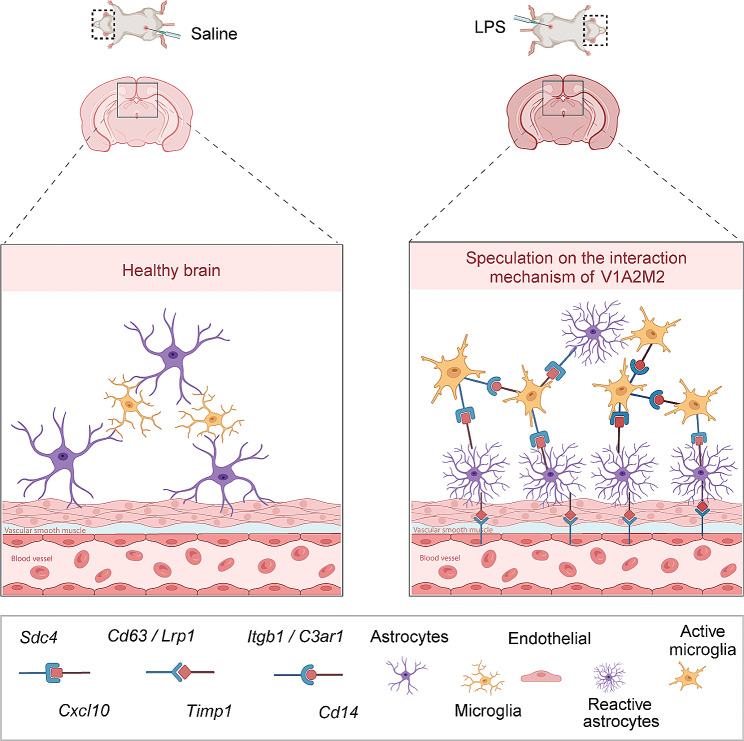
Results: Our study uncovered notable temporal differences in the response to LPS challenge between Anxa1-/- (annexin A1 knockout) and wild type mice, specifically at the 12-hour and 24-hour time points following injection. We observed a significant increase in the proportion of Astro-2 and Micro-2 cells in these mice. These cells exhibited a colocalization pattern with the vascular subtype Vas-1, forming a distinct region known as V1A2M2, where Astro-2 and Micro-2 cells surrounded Vas-1. Moreover, through further analysis, we discovered significant upregulation of ligands and receptors such as Timp1-Cd63, Timp1-Itgb1, Timp1-Lrp1, as well as Ccl2-Ackr1 and Cxcl2-Ackr1 within this region. In addition, we observed a notable increase in the expression of Cd14-Itgb1, Cd14-Tlr2, and Cd14-C3ar1 in regions enriched with Micro-2 cells. Additionally, Cxcl10-Sdc4 showed broad upregulation in brain regions containing both Micro-2 and Astro-2 cells. Notably, upon LPS challenge, there was an observed increase in Anxa1 expression in the mouse brain. Furthermore, our study revealed a noteworthy increase in mortality rates following Anxa1 knockdown. However, we did not observe substantial differences in the types, numbers, or distribution of other brain cells between Anxa1-/- and wildtype mice over time. Nevertheless, when comparing the 24-hour post LPS injection time point, we observed a significant decrease in the proportion and distribution of Micro-2 and Astro-2 cells in the vicinity of blood vessels in Anxa1-/- mice. Additionally, we noted reduced expression levels of several ligand-receptor pairs including Cd14-Tlr2, Cd14-C3ar1, Cd14-Itgb1, Cxcl10-Sdc4, Ccl2-Ackr1, and Cxcl2-Ackr1.

Conclusions: By combining snRNA-seq and Stereo-seq techniques, our study successfully identified a distinctive cellular colocalization, referred to as a special pathological niche, comprising Astro-2, Micro-2, and Vas-1 cells. Furthermore, we observed an upregulation of ligand-receptor pairs within this niche. These findings suggest a potential association between this cellular arrangement and the underlying mechanisms contributing to SAE or the increased mortality observed in Anxa1 knockdown mice.

Keywords: Anxa1; Cellular colocalization; Glial cell response; SAE; Sepsis; Single-nucleus RNA sequencing; Spatial transcriptomics.


Conflict of interest statement

The authors declare no competing interests.

Figures

Fig. 1
Fig. 1
Single-nucleus transcriptomic profiling of the mouse brain following peripheral LPS stimulation. (A) Schematic diagram illustrating the acquisition and analysis workflow of the spatial transcriptomics (ST) maps. Brain tissue samples from 8 wide type and 8 Anxa1 knockout C57BL6 mice were subjected to Stereo-seq, resulting in a total of 1,943,116 spots. Paired brain tissue samples of the wild type and Anxa1−/− mice were also subjected to snRNA-seq, and 376,909 qualified nuclei were identified. The processed data was subjected to dimensionality reduction using Uniform Manifold Approximation and Projection (UMAP) and spatial cell types mapping for visualization, respectively. Finally, a combined analysis of the single-nucleus sequencing results and the spatial transcriptome sequencing results was performed. (B) UMAP plot of the snRNA-seq data. Each cluster in the plot corresponds to a specific cell type and is color-coded accordingly. The cell types included in the plot are Oligodendrocytes (OligoD), Vascular cells (Vas), Microglial cells (Microglia), Astrocytes (Astro), and Oligodendrocyte precursor cells (OPC). (C) Expression of canonical markers in each cell type cluster. (D) The UMAP plot displays cells from both the wild type and Anxa1−/− mice, with each cell color-coded based on the genotype of the respective mouse. (E) The UMAP plots demonstrate the changes in cell dynamics after administering LPS to both wild type and Anxa1−/− mice. (F-G) The relative proportions of Astro-1 and Astro-2 cells (F), as well as Micro-1 and Micro-2 cells (G), were compared at different time intervals following LPS treatment in both wild type and Anxa1−/− mice. (H) Volcano plots were generated to visualize the differentially expressed genes (DEGs) between Astro-2 and Astro-1 cells, as well as between Micro-2 and Micro-1 cells. The X-axis and Y-axis represent the log2 fold-change differences between the compared cell types and the statistical significance as the negative log10 of DEG P-values, respectively. Significantly up-regulated and down-regulated genes are indicated by orange and green dots, respectively, while non-significant genes are represented as black dots. (I) Heatmap displaying the DEGs between two groups of Oligodendrocytes. The first group consists of Oligodendrocytes from wild type and Anxa1−/− mice at 12- or 24-hour, while the second group comprises Oligodendrocytes from wild type and Anxa1−/− mice at 0- or 72-hour. Only the up-regulated genes with a log2 fold-change value greater than 1 and an adjusted p-value smaller than 0.05 are shown. Oligodendrocytes from wild type mice are colored in yellow, while those from Anxa1−/− mice are colored in red
Fig. 2
Fig. 2
Spatially-resolved transcriptomic analysis following peripheral LPS stimulation. (A) Hematoxylin and eosin (H&E) staining, single-stranded DNA (ssDNA) picture, and cell type mapping of the ST slide from a wild type mouse at 72-hour. The spatial expression signal in the slide was detected using Stereo-seq technology, and the raw spatial expression matrix was transformed into spots based on the ssDNA picture. The cell types within the spots were then identified using the robust cell type decomposition (RCTD) method. In the right panel, the H&E staining and cell type labels around the third ventricle are emphasized. (B) The number of spots in the spatial transcriptome (ST) data with the eight assigned cell type labels. Spots that are not categorized into any of the eight cell type labels, namely Astro-1, Astro-2, Micro-1, Micro-2, Neuron, OligoD, OPC, and Vas-1, are labeled as “other”. (C-D) The relative proportions of Astro-1 and Astro-2 spots (C), as well as Micro-1 and Micro-2 spots (D), were compared at different time intervals following LPS treatment in both wild type and Anxa1−/− mice. (E-F) Spatial map of Astro-1 or Astro-2 spots (E), as well as Micro-1 or Micro-2 spots (F) at different time intervals following LPS treatment in both wild type and Anxa1−/− mice. (G) Proportions of Cdkn1a+ Serpina3n+ OligoD spots relative to all Oligodendrocyte spots across the ST data. (H) Spatial map of Cdkn1a+ Serpina3n+ OligoD spots across the ST data. (I) The enriched GO BP-terms for the DEGs between Astro-2 and Astro-1, Micro-2 and Micro-1, as well as Cdkn1a+ Serpina3n+ OligoD and OligoD in the ST data. The top six GO BP-terms for the up-regulated genes in each category-Astro-2, Micro-2, and Cdkn1a+ Serpina3n+ OligoD are presented
Fig. 3
Fig. 3
Diversity and spatial distribution of microglia, astrocytes, and Oligodendrocytes following peripheral LPS stimulation. (A) Heatmap illustrating the gene co-localization module (Co-locM) in the ST data of wild type mice from different time periods after LPS treatment. (B) Visualization of Co-locM module score in the UMAP plot of the snRNA-seq data. (C) The enriched GO BP-terms in the genes of the Co-locM module. The top ten GO BP-terms are shown. (D) Distribution of the Co-locM module score in spots assigned with different cell type labels in the ST data of wild type mice from different time periods. The boxplot for each spot type is color-coded based on its label type. T tests (unpaired samples, two-tailed) were conducted between different spot types, and the P-value or the maximum P-value of a test set was reported. Significance levels are indicated as follows: *** P < 0.001. (E) Spatial distribution of the Co-locM module score and the spatial map of Vas-1 in the ST data obtained from wild type mice at 12- and 24-hour time points. (F) Distribution of the Co-locM module score in all spots within the ST data. The ST data is color-coded based on the mice genotype. Spots with a score above 0.5 were assigned the Co-locM label. (G) Distribution of Co-locM spot proportion across 46 spot groups. The spots were selected based on the presence of any of the nine labels (Astro-1, Astro-2, Micro-1, Micro-2, Neuron, OligoD, OPC, Vas-1, and Cdkn1a+ Serpina3n+ OligoD) and grouped according to the combination of labels present in each ST dataset. The Co-locM spot proportion in each spot group was calculated and plotted across eight ST datasets from mice at 12- and 24-hour time points. The top five spot types with the highest Co-locM spot proportion are highlighted. (H) Distribution of Co-locM spot proportion in the top five spot groups. Spot Group 1 (S1) consists of spots labeled with Micro-2, Astro-2, and Vas-1; Spot Group 2 (S2) comprises spots labeled with OligoD, Micro-2, Astro-2, and Cdkn1a+ Serpina3n+ OligoD; Spot Group 3 (S3) includes spots labeled with Astro-2 and Vas-1; Spot Group 4 (S4) consists of spots labeled with OligoD, Astro-2, and Cdkn1a+ Serpina3n+ OligoD; Spot Group 5 (S5) encompasses spots labeled with Micro-2 and Vas-1. The Co-locM proportion between S1 and S2, S3, S4, and S5 is compared using a T-test (paired samples, one-tailed). Significance levels are indicated as follows: *P < 0.05, ***P < 0.001. (I-J) Spatial maps of Astro.2, Micro-2, and Vas-1 spots in twFo different regions from wild type mice. The first region, as a Co-locM hot spot (I), is from a 12-hour mouse and represents a region where all three cell types are co-localized. The second region is a paired region from a 0-hour mouse (J). The maps illustrate the distribution and co-localization of these three cell types in each region. (K) DEG analysis showing up- and down-regulated genes across Astro-2, Micro-2 and Vas-1 clusters in snRNA-seq data of wild type mice. An adjusted P value < 0.01 is indicated in red, while an adjusted P value ≥ 0.01 is indicated in black. DEG, differentially expressed genes. (L) The GO terms obtained by performing GO enrichment analysis on the top 30 genes of Astro-2, Micro-2 and Vas-1 clusters based on the log2 FC value in the snRNA-seq data of wild type mice
Fig. 4
Fig. 4
Crosstalk among microglia, astrocytes, and vascular components within the pathological microstructure. (A) Network diagram of ligand-receptor pairs that are specifically activated in wild type or Anxa1−/− mice at 12- and 24-hour time points (referred to as responsive-LRs). Each node in the diagram represents either a ligand or receptor, with the node from which the arrow originates representing the ligand and the node to which the arrow points representing the receptor. (B) Heatmap displaying the -log2 (p-value) of the activity of responsive ligand-receptor (LR) pairs in wild type and knockout (Anxa1−/−) mice at different time points. LR pairs were identified as responsive if they showed significant changes in activity compared to baseline levels. The heatmap uses a color-coding scheme to indicate whether a responsive LR is specific to wild type (blue) or Anxa1−/− (red) mice. The heatmap provides a visual representation of the changes in activity of specific LR pairs in wild type and Anxa1−/− mice over time. (C) Fold change values of genes composed of responsive ligand-receptor (LR) pairs. Fold change values were calculated in wild type and Anxa1−/− mice at 12- and 24-hour time points compared to 0- and 72-hour time points. Additionally, fold change values were calculated in a publicly available bulk RNA-seq dataset comparing LPS-treated wild type mice to PBS-treated wild type mice. The genes included in the analysis are those that are composed of the responsive LR pairs identified in the previous analysis. The figure provides a visual representation of the changes in gene expression in response to LPS treatment in wild type and Anxa1−/− mice, as well as in a separate dataset. (D) The enriched GO BP-terms in the genes composed of responsive-LRs in wild type mice. Top ten GO BP-terms are shown. (E) Distribution of ligand-receptor (LR) co-localization spot percent in different spot groups. The spots were selected based on the presence of any of the nine labels (Astro-1, Astro-2, Micro-1, Micro-2, Neuron, OligoD, OPC, Vas-1, and Cdkn1a+ Serpina3n+ OligoD) and grouped according to the combination of labels present in each ST dataset. LR co-localization spot percent in each spot group was calculated and plotted across eight ST datasets from mice at 12- and 24-hour time points. The top five spot types with the highest percentages are shown in the figure and labeled as S1, S2, S3, S4, and S5. The LR co-localization spot percent between S1 and S2, S3, S4, and S5 is compared by T-test (paired samples, one-tailed); statistical significance is indicated by asterisks (*P < 0.05; ***P < 0.001). In each subgraph, S1 represents the spot group composed of Micro-2, Astro-2, and Vas-1 labels. The figure provides insights into the co-localization patterns of LR pairs within specific cell types and across different ST datasets. (F-G) The GO BP-terms that are enriched in the up-regulated genes between Vas-1 cells (spots) with and without the ligand-receptor pair(LR) (F) and between Astro-2 cells (spots) with and without the LR (G). A cell or a spot with a LR pair means that the two genes composed the LR are co-expressed in the cell or spot. The analysis was performed to identify the biological processes that are associated with the up-regulated genes between cells with and without LR pairs. The top six enriched GO BP-terms are shown for both ST data and snRNA-seq data. The figure provides insights into the biological processes that are affected by the presence or absence of LR pairs in Vas-1 and Astro-2 cells
Fig. 5
Fig. 5
Role of Anxa1 in the pathogenesis of pathological microstructure formation. (A) Survival Analysis of murine model through intraperitoneal administration of lipopolysaccharide (LPS) in wild type and Anxa1−/− group. Graphical representation is as follows: wild type control mice receiving saline (purple dashed line), wild type mice administered lipopolysaccharide (LPS) (blue solid line), Anxa1−/− control mice receiving saline (green dashed line), and Anxa1−/− mice administered LPS (red solid line). On the survival plot, the x-axis signifies the duration of post-injection observation in hours, while the y-axis denotes the survival percentage. A statistical significance, indicated by three asterisks, corresponds to a P value of less than 0.001. (B-C) The ratio between cells (spots) of different cell subtypes across time periods. Specifically, it shows the ratio of Astro-2 cells (spots) with Astro-1 cells (spots) (B and the ratio of Micro-2 cells (spots) with Micro-1 cells (spots) (C). Each dot in the figure represents the ratio calculated from a mouse, and the color of the dot indicates the genotype of the mouse. The ratio calculation was performed on two different types of data: “snRNA” represents the ratio calculated in the snRNA-seq data, while “ST” indicates that the ratio was calculated in the ST data. (D) UMAP plot showing Astro-2 and Astro-1 cells from 12- and 24-hour mice in the snRNA-seq data. The Astro-2 and Astro-1 cells are indicated by different colors in the plot. (E) Spatial map showing the distribution of Astro-2 and Astro-1 labeled spots in the ST datasets from 12- and 24-hour mice. The Astro-2 and Astro-1 labeled spots are represented by different colors on the map, indicating their respective locations. (F) Percents of Vas-1, Astro-2, and Micro-2 labeled spots in the ST data from different time periods. Each dot in the figure represents a mouse, and the color of the dot represents the mouse genotype. The percentages of Vas-1, Astro-2, and Micro-2 labeled spots were calculated for each mouse and are displayed in the figure. (G) Spatial map of Vas-1, Astro-2, and Micro-2 labeled spots in the ST datasets from 12- and 24-hours mice. (H) Fold change values of genes composed of responsive ligand-receptor pairs between 24-hour wild type mice and 24-hour Anxa1−/− mice. The genes that showed a fold change of two times or more, either up-regulated (red) or down-regulated (green), were identified. The corresponding ligand-receptor pairs associated with these genes were highlighted. (I-J) Percentages of Micro-2 cells (spots) with the LR in 24-hour wild type mice and 24-hour Anxa1−/− mice (I), as well as the percentages of Astro-2 cells (spots) with Cxcl10-Sdc4 in 24-hour wild type mice and 24-hour Anxa1−/− mice. (K) Percentages of Vas-1, Astro-2, and Micro-2 labeled spots with the ligand-receptor pair in 24-hour wild type mice and 24-hour Anxa1−/− mice. Each dot in the figure represents a mouse, and the color of the dot indicates the mouse genotype. A spot with a ligand-receptor pairs indicates that the two genes composing the LR are co-localized in that particular spot
Fig. 6
Fig. 6
Hypothesized model of astroglial and microglial perivascular network interactions. Glial cell activation and interaction following intraperitoneal injection of lipopolysaccharide (LPS) were compared to the control group. After intraperitoneal injection, microglia and astrocytes were observed to be activated, proliferate, and enlarge in the peritoneal cavity. These activated glial cells were found to aggregate around blood vessels, forming a structure referred to as V1A2M2. The activated glial cells present in the V1A2M2 structure may act by activating specific receptor ligands. Activated astrocytes in the structure may interact through Timp1-Cd63 and Timp1-Lrp1, while activated microglia may engage in self-regulation through Cd14-Itgb1 and Cd14-C3ar1. This response signifies the reaction to intracranial inflammation initiated by peripheral inflammation

Similar articles

Cited by

References

    1. Rudd KE, et al. The global burden of sepsis: barriers and potential solutions. Crit Care. 2018;22(1):232. doi: 10.1186/s13054-018-2157-z. - DOI - PMC - PubMed
    1. Global burden of disease and sepsis Arch Dis Child. 2020;105(3):210. doi: 10.1136/archdischild-2020-318893. - DOI - PubMed
    1. Ren C, et al. Sepsis-associated encephalopathy: a vicious cycle of immunosuppression. J Neuroinflammation. 2020;17(1):14. doi: 10.1186/s12974-020-1701-3. - DOI - PMC - PubMed
    1. Sonneville R, et al. The spectrum of sepsis-associated encephalopathy: a clinical perspective. Crit Care. 2023;27(1):386. doi: 10.1186/s13054-023-04655-8. - DOI - PMC - PubMed
    1. Mazeraud A, et al. Septic-Associated Encephalopathy: a Comprehensive Review. Neurotherapeutics. 2020;17(2):392–403. doi: 10.1007/s13311-020-00862-1. - DOI - PMC - PubMed

Substances