. 2024 Jul;14(7):e1747.
doi: 10.1002/ctm2.1747.

N-acetyltransferase 10 facilitates tumorigenesis of diffuse large B-cell lymphoma by regulating AMPK/mTOR signalling through N4-acetylcytidine modification of SLC30A9

Affiliations

N-acetyltransferase 10 facilitates tumorigenesis of diffuse large B-cell lymphoma by regulating AMPK/mTOR signalling through N4-acetylcytidine modification of SLC30A9

Mengfei Ding et al. Clin Transl Med. 2024 Jul.

Abstract

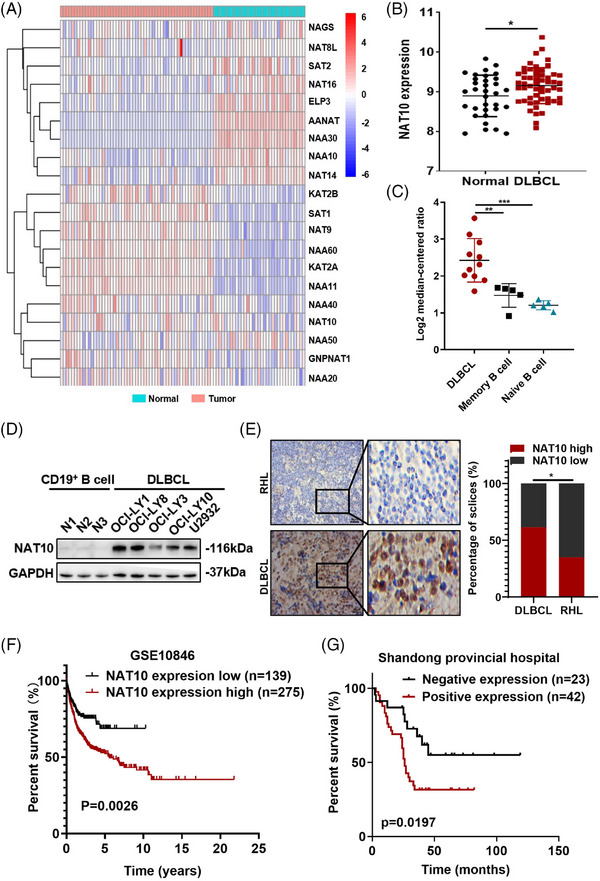
Background: Accumulating studies suggested that posttranscriptional modifications exert a vital role in the tumorigenesis of diffuse large B-cell lymphoma (DLBCL). N4-acetylcytidine (ac4C) modification, catalyzed by the N-acetyltransferase 10 (NAT10), was a novel type of chemical modification that improves translation efficiency and mRNA stability.

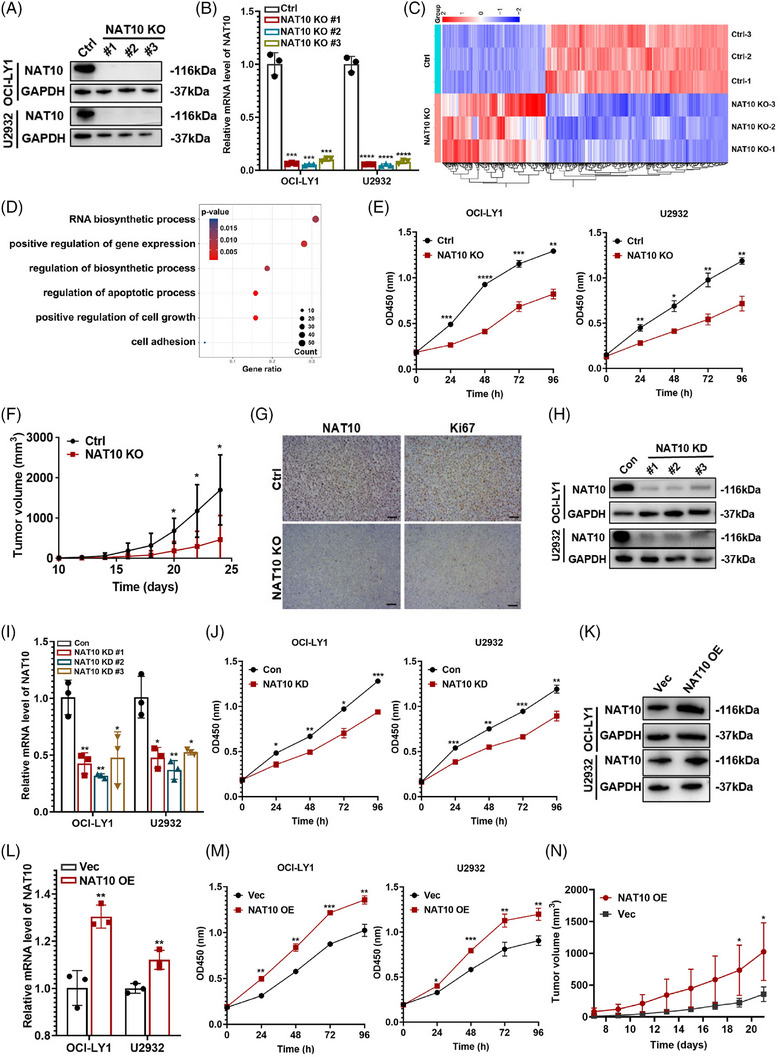
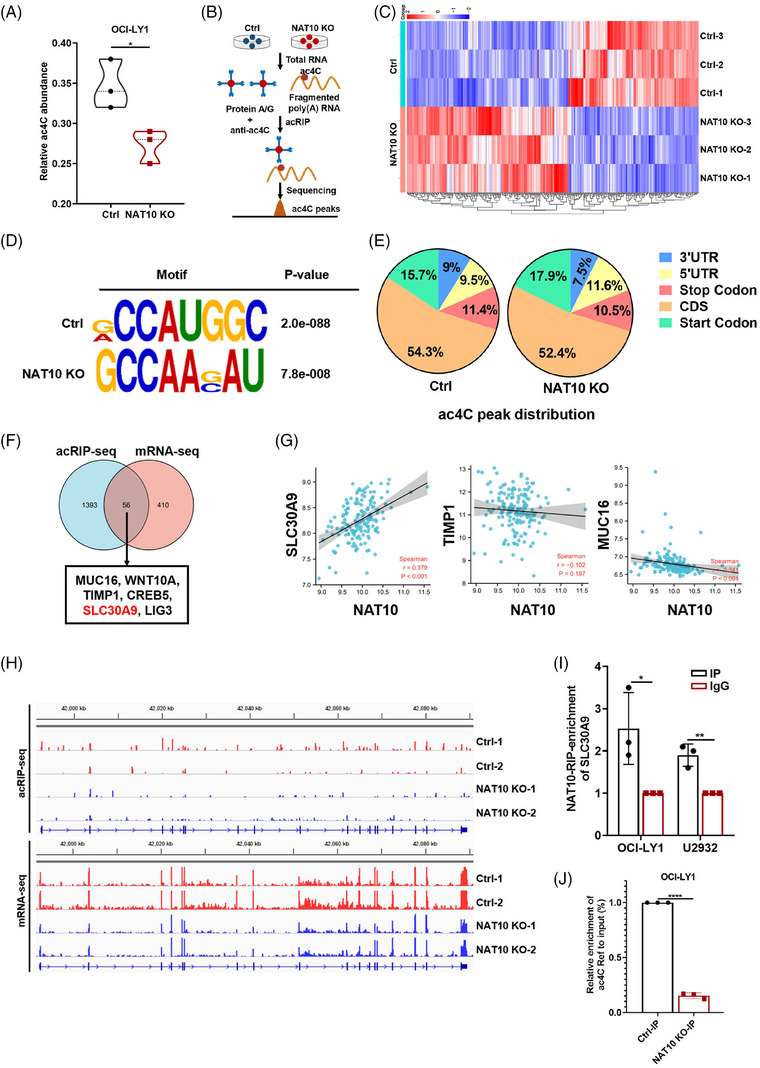
Methods: GEO databases and clinical samples were used to explore the expression and clinical value of NAT10 in DLBCL. CRISPER/Cas9-mediated knockout of NAT10 was performed to determine the biological functions of NAT10 in DLBCL. RNA sequencing, acetylated RNA immunoprecipitation sequencing (acRIP-seq), LC-MS/MS, RNA immunoprecipitation (RIP)-qPCR and RNA stability assays were performed to explore the mechanism by which NAT10 contributed to DLBCL progression.

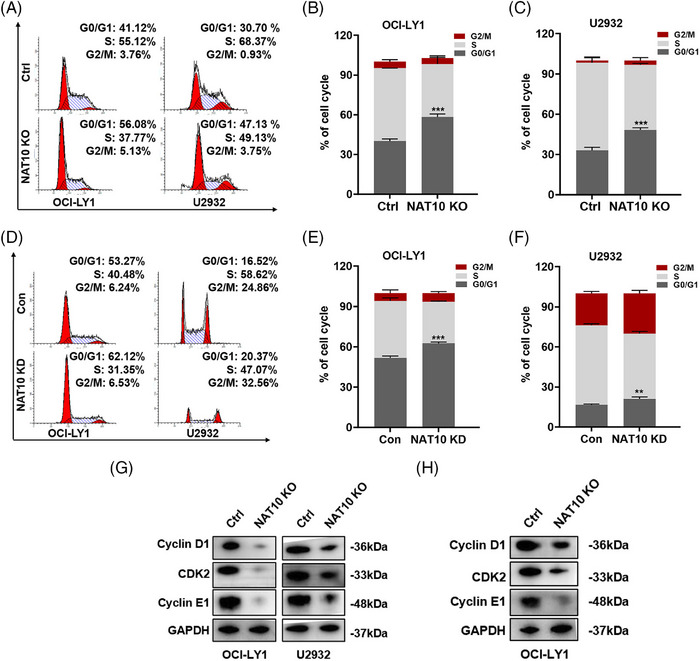
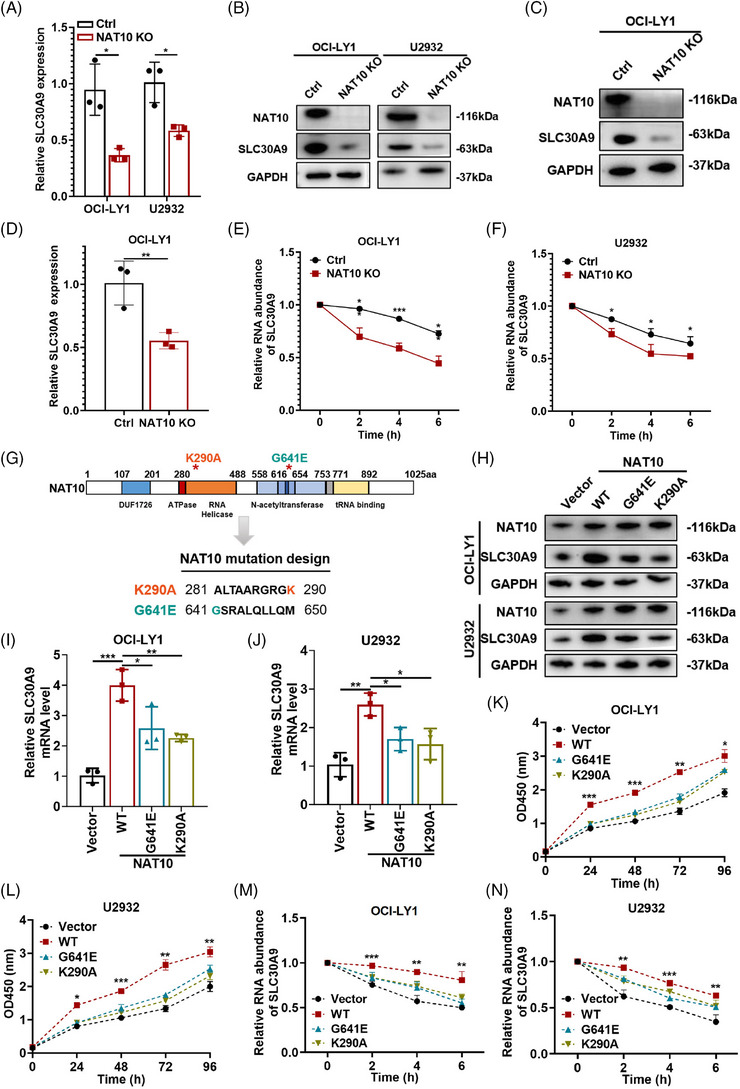
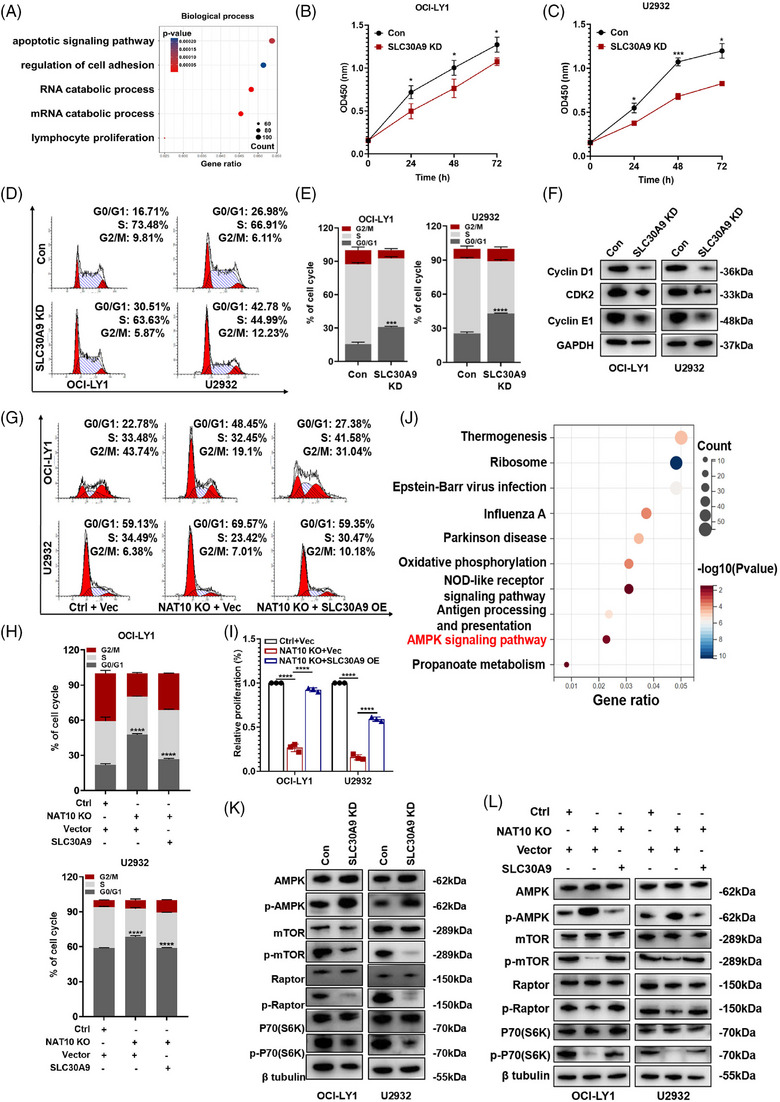
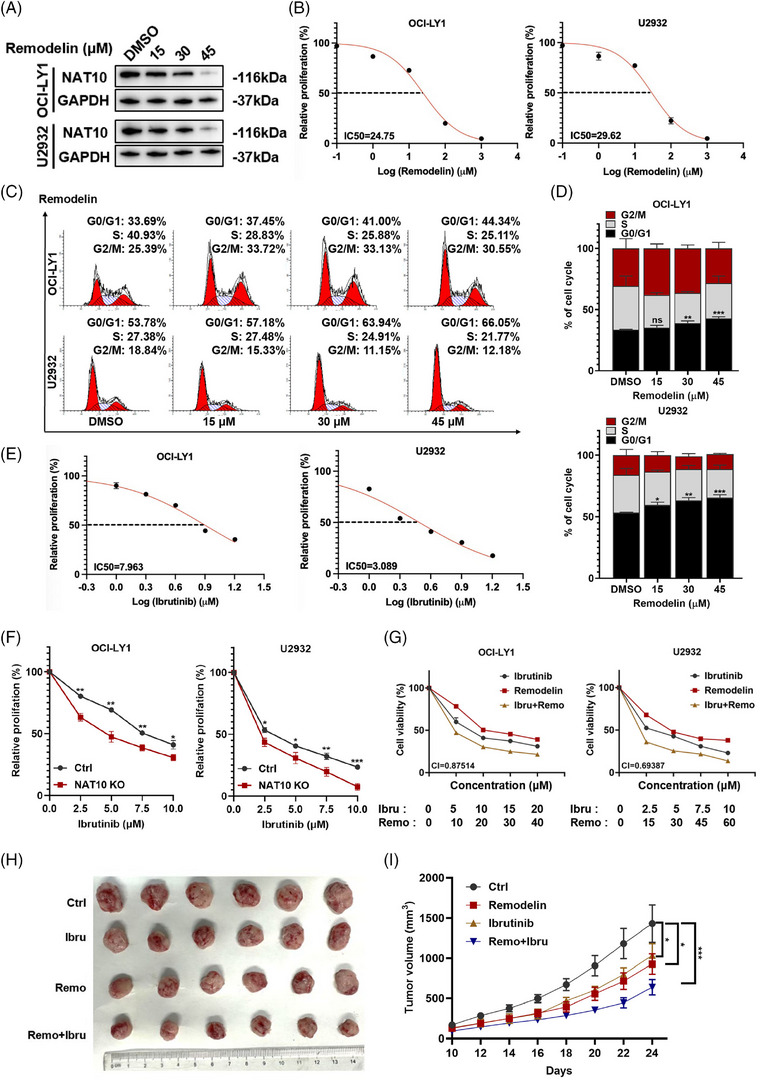
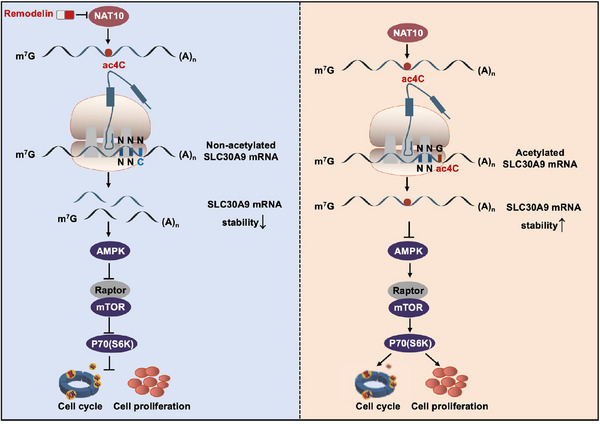
Results: Here, we demonstrated that NAT10-mediated ac4C modification regulated the occurrence and progression of DLBCL. Dysregulated N-acetyltransferases expression was found in DLBCL samples. High expression of NAT10 was associated with poor prognosis of DLBCL patients. Deletion of NAT10 expression inhibited cell proliferation and induced G0/G1 phase arrest. Furthermore, knockout of NAT10 increased the sensitivity of DLBCL cells to ibrutinib. AcRIP-seq identified solute carrier family 30 member 9 (SLC30A9) as a downstream target of NAT10 in DLBCL. NAT10 regulated the mRNA stability of SLC30A9 in an ac4C-dependent manner. Genetic silencing of SLC30A9 suppressed DLBCL cell growth via regulating the activation of AMP-activated protein kinase (AMPK) pathway.

Conclusion: Collectively, these findings highlighted the essential role of ac4C RNA modification mediated by NAT10 in DLBCL, and provided insights into novel epigenetic-based therapeutic strategies.

Keywords: Diffuse large B‐cell lymphoma; N4‐acetyclytidine; N‐acetyltransferase 10; Solute carrier family 30 member 9.


Conflict of interest statement

The authors declare that they have no conflicts of interest.

Figures

FIGURE 1
FIGURE 1
Dysregulated expression of N‐acetyltransferases and association with poor prognosis of DLBCL patients. (A) Heatmap of N‐acetyltransferases expression in normal (healthy tonsil tissues, n = 33) and DLBCL tissues (n  =  55) from the GEO database (GSE56315), with high and low expression levels shown in red and blue, respectively. (B) NAT10 was upregulated in DLBCL tissues (n  =  55) compared to normal samples (healthy tonsil tissues, n  =  33) based on the GSE56315 dataset. *p < .05. p‐Values came from unpaired two‐tailed t‐test. (C) The expression of NAT10 in the Oncomine dataset. **p < .01, ***p < .001. p‐Values came from unpaired two‐tailed t‐test. (D) Western blot analysis of the NAT10 protein expression level in different DLBCL cell lines. (E) Representative images of immunohistochemical staining for the NAT10 protein (left). Compared to samples of reactive hyperplasia lymphoid (RHL), expression level of NAT10 was significantly increased in DLBCL tissues. NAT10 is mainly localized in the nucleus. Bar  =  50 µm. Statistical analysis of NAT10‐positive staining in patients with DLBCL (n = 104) and RHL (n = 20) (right). *p < .05. p‐Value came from the chi‐square test. (F) Kaplan–Meier survival curve analysis indicated that high NAT10 expression in DLBCL appeared to be correlated with a shorter overall survival (OS) based on analysis of the GSE10846 dataset (p  =  .0026). The median OS was assessed by the log‐rank test. (G) Kaplan–Meier survival curve analysis indicated that high NAT10 expression in DLBCL appeared to be correlated with shorter OS based on analysis of our IHC data (n  = 65, p  =  .0197). The median OS was assessed by the log‐rank test.
FIGURE 2
FIGURE 2
NAT10 promoted cellular proliferation of DLBCL cells both in vitro and in vivo. (A) Western blot analysis confirmed CRISPR/Cas9‐mediated NAT10 deletion in OCI‐LY1 and U2932 cells. Ctrl: negative control (non‐target gRNAs), NAT10 KO: CRISPR/Cas9 gene editing system targeting deletion of NAT10 (NAT10 knockout). (B) qRT‐PCR assay confirmed CRISPR/Cas9‐mediated NAT10 deletion in OCI‐LY1 and U2932 cells. Ctrl: negative control (non‐target gRNAs), NAT10 KO: CRISPR/Cas9 gene editing system targeting deletion of NAT10 (NAT10 knockout). At least three independent experiments were conducted to obtain the data presented as mean  ±  SD. ***p < .001. ****p  <  .0001. p‐Values from unpaired two‐tailed t‐test. (C) Differentially expressed genes from RNA‐seq of OCI‐LY1 cells with or without NAT10 knockout, (n = 3). Ctrl: negative control (non‐target gRNAs), NAT10 KO: CRISPR/Cas9 gene editing system targeting deletion of NAT10 (NAT10 knockout). (D) Functional enrichment analyses of differentially expressed genes according to RNA‐seq of OCI‐LY1 cells with or without NAT10 knockout, n = 3. Ctrl: negative control (non‐target gRNAs), NAT10 KO: CRISPR/Cas9 gene editing system targeting deletion of NAT10 (NAT10 knockout). (E) Relative proliferation levels of OCI‐LY1 and U2932 cells transfected with Ctrl or NAT10 KO detected by CCK‐8 assay. Ctrl: negative control (non‐target gRNAs), NAT10 KO: CRISPR/Cas9 gene editing system targeting deletion of NAT10 (NAT10 knockout). At least three independent experiments were conducted to obtain the data presented as mean  ±  SD. *p < .05, **p < .01, ***p < .001. ****p  <  .0001. p‐Values from two‐way ANOVA with Sidak correction. (F) SCID beige mice were subcutaneously injected with OCI‐LY1 cells with or without NAT10 knockout (n  =  6). Ctrl: negative control (non‐target gRNAs), NAT10 KO: CRISPR/Cas9 gene editing system targeting deletion of NAT10 (NAT10 knockout). *p < .05. p‐Values from two‐way ANOVA with Sidak correction. (G) IHC staining with NAT10 and Ki67 expression levels were performed from NAT10 knockout xenograft tumour tissues (n = 3). Bar  =  50 µm. Ctrl: negative control (non‐target gRNAs), NAT10 KO: CRISPR/Cas9 gene editing system targeting deletion of NAT10 (NAT10 knockout). (H) OCI‐LY1 and U2932 cells were stably transfected with NAT10 knockdown lentivirus (shNAT10, NAT10 KD) and control (Con). The lentivirus‐mediated NAT10 repression was confirmed by Western blotting. (I) OCI‐LY1 and U2932 cells were stably transfected with NAT10 knockdown lentivirus (shNAT10, NAT10 KD) and control (Con). The lentivirus‐mediated NAT10 repression was confirmed by qRT‐PCR. At least three independent experiments were conducted to obtain the data presented as mean  ±  SD. ***p < .001. ****p <  .0001. p‐Values from unpaired two‐tailed t‐test. (J) NAT10 knockdown decreased cellular proliferative activity in DLBCL. Con: control, NAT10 KD: lentivirus‐mediated NAT10 knockdown. At least three independent experiments were conducted to obtain the data presented as mean  ±  SD. *p < .05, **p < .01, ***p < .001. p‐Values from two‐way ANOVA with Sidak correction. (K) OCI‐LY1 and U2932 cells were stably transfected with NAT10 overexpression lentivirus (NAT10 OE) and empty vector (Vec). The overexpression efficiency of NAT10 was confirmed by western blot. (L) OCI‐LY1 and U2932 cells were stably transfected with NAT10 overexpression lentivirus (NAT10 OE) and empty vector (Vec). The overexpression efficiency of NAT10 was confirmed by qRT‐PCR. At least three independent experiments were conducted to obtain the data presented as mean  ±  SD. **p < .01. p‐Values from unpaired two‐tailed t‐test. (M) NAT10 overexpression increased cellular proliferative activity in DLBCL. Vec: empty vector, NAT10 OE: lentivirus‐mediated NAT10 overexpression. At least three independent experiments were conducted to obtain the data presented as mean  ±  SD. *p < .05, **p < .01, ***p < .001. p‐Values from two‐way ANOVA with Sidak correction. (N) SCID beige mice were subcutaneously injected with OCI‐LY1 cells with or without NAT10 overexpression (n  =  5). Vec: empty vector, NAT10 OE: lentivirus‐mediated NAT10 overexpression. *p < .05. p‐Values from two‐way ANOVA with Sidak correction.
FIGURE 3
FIGURE 3
Suppression of NAT10 induced cell cycle arrest in DLBCL cells. (A–C) Knocking out NAT10 induced cell cycle arrest in OCI‐LY1 and U2932 cells, which were arrested in the G0/G1 phase. Cell cycle distribution was measured by flow cytometry. Ctrl: negative control (non‐target gRNAs), NAT10 KO: CRISPR/Cas9 gene editing system targeting deletion of NAT10 (NAT10 knockout). At least three independent experiments were conducted to obtain the data presented as mean  ±  SD. ***p < .001. p‐Values from unpaired two‐tailed t‐test. (D–F) NAT10 knockdown induced cell cycle arrest at the G0/G1 phase in OCI‐LY1 and U2932 cells. Con: control, NAT10 KD: lentivirus‐mediated NAT10 knockdown. At least three independent experiments were conducted to obtain the data presented as mean  ±  SD. **p < .01, ***p < .001. p‐Values from unpaired two‐tailed t‐test. (G) Decreased expression levels of cyclin D1, CDK2 and cyclin E1 were observed in NAT10 knockout‐treated DLBCL cells. Ctrl: negative control (non‐target gRNAs), NAT10 KO: CRISPR/Cas9 gene editing system targeting deletion of NAT10 (NAT10 knockout). (H) Decreased expression levels of cyclin D1, CDK2 and cyclin E1 were observed in tumour tissues from DLBCL xenograft model with NAT10 knockout cells. Ctrl: negative control (non‐target gRNAs), NAT10 KO: CRISPR/Cas9 gene editing system targeting deletion of NAT10 (NAT10 knockout).
FIGURE 4
FIGURE 4
NAT10 regulated the acetylation of SLC30A9 mRNA in DLBCL cells. (A) Global ac4C abundance in OCI‐LY1 cells with negative control or NAT10 knockout, n = 3. Ctrl: negative control (non‐target gRNAs), NAT10 KO: CRISPR/Cas9 gene editing system targeting deletion of NAT10 (NAT10 knockout). *p < .05. p‐Values from unpaired two‐tailed t‐test. (B) The process of acRIP‐seq. (C) Differentially expressed genes between negative control and NAT10 knockout OCI‐LY1 cells from mRNA‐seq, n = 3. Ctrl: negative control (non‐target gRNAs), NAT10 KO: CRISPR/Cas9 gene editing system targeting deletion of NAT10 (NAT10 knockout). (D) Top consensus motif with acRIP‐seq peaks in OCI‐LY1 cells with or without NAT10 knockout. Ctrl: negative control (non‐target gRNAs), NAT10 KO: CRISPR/Cas9 gene editing system targeting deletion of NAT10 (NAT10 knockout). (E) Representative pie chart of peak distribution exhibiting the proportion of total ac4C peaks in the indicated regions. Ctrl: negative control (non‐target gRNAs), NAT10 KO: CRISPR/Cas9 gene editing system targeting deletion of NAT10 (NAT10 knockout). (F) Venn diagram showing SLC30A9 as the potential target of NAT10. (G) Scatter plots show the correlation between NAT10 and SLC30A9, CREB5, TIMP1 and MUC16. (H) Integrative Genomics Viewer (IGV) tracks displaying acRIP‐seq and mRNA‐seq reads distribution in SLC30A9 mRNA. (I) The bound and interacted relationship between NAT10 and SLC30A9 mRNA in OCI‐LY1 and U2932 cells confirmed using the RIP qRT‐PCR assay. Results are presented as mean  ±  SD from three independent experiments. *p < .05, **p  <  .01. p‐Values from unpaired two‐tailed t‐test. (J) acRIP‐qPCR displaying ac4C enrichment in SLC30A9 mRNA in negative control and NAT10 knockout cells. Ctrl: negative control (non‐target gRNAs), NAT10 KO: CRISPR/Cas9 gene editing system targeting deletion of NAT10 (NAT10 knockout). ****p < .0001. p‐Values from unpaired two‐tailed t‐test.
FIGURE 5
FIGURE 5
NAT10 acetylated SLC30A9 at K290A and G641E sites in ac4C‐dependent manner. (A) qRT‐PCR of SLC30A9 expression in negative control or NAT10 knockout DLBCL cells. Ctrl: negative control (non‐target gRNAs), NAT10 KO: CRISPR/Cas9 gene editing system targeting deletion of NAT10 (NAT10 knockout). Results are presented as mean  ±  SD from three independent experiments. *p  <  .05. p‐Values from unpaired two‐tailed t‐test. (B) Western blot of SLC30A9 expression in negative control or NAT10 knockout DLBCL cells. Ctrl: negative control (non‐target gRNAs), NAT10 KO: CRISPR/Cas9 gene editing system targeting deletion of NAT10 (NAT10 knockout). (C) Western blot analyses of SLC30A9 expression in tumour tissues obtained from the NAT10 knockout subcutaneous tumour. Ctrl: negative control (non‐target gRNAs), NAT10 KO: CRISPR/Cas9 gene editing system targeting deletion of NAT10 (NAT10 knockout). (D) qRT‐PCR analyses of SLC30A9 expression in tumour tissues obtained from the NAT10 knockout subcutaneous tumour. Ctrl: negative control (non‐target gRNAs), NAT10 KO: CRISPR/Cas9 gene editing system targeting deletion of NAT10 (NAT10 knockout). Results are presented as mean  ±  SD from three independent experiments. **p  <  .01. p‐Values from unpaired two‐tailed t‐test. (E and F) The impression of NAT10 on SLC30A9 mRNA stability confirmed by the RNA stability assay. Data are shown as the mean ± SD of at least three independent experiments. *p < .05, ***p < .001. p‐Values from unpaired two‐tailed t‐test. (G) Representation of NAT10 with its known domains and schematic diagram of the design of NAT10 mutant. The G641E mutation and K290A mutation are asterisked and respectively indicated in orange and green. (H) The expression of SLC30A9 is examined after transfection of plasmids containing NAT10 sequence by western blot. (I and J) The expression of SLC30A9 is examined after transfection of plasmids containing NAT10 sequence by qRT‐PCR. Data are shown as the mean ± SD of at least three independent experiments. *p < .05, **p  <  .01, ***p < .001. p‐Values from unpaired two‐tailed t‐test. (K and L) CCK‐8 kit is utilized to determine the proliferation level in OCI‐LY1 and U2932 cells transfected by empty vector, NAT10 wild‐type plasmid (WT) and NAT10 mutant plasmid (G641E and K290A), respectively. Data are shown as the mean ± SD of at least three independent experiments. *p < .05, **p  <  .01, ***p < .001. p‐Values from two‐way ANOVA with Sidak correction. (M and N) The mRNA half‐life of SLC30A9 in OCI‐LY1 and U2932 cells transfected with empty vector or wild‐type NAT10 (WT) or NAT10 mutant (G641E and K290A). Data are shown as the mean ± SD of at least three independent experiments. **p < .01, ***p < .001. p‐Values from unpaired two‐tailed t‐test.
FIGURE 6
FIGURE 6
NAT10 facilitated DLBCL progression by regulating SLC30A9‐mediated activation of AMPK signalling. (A) GO analysis of the differentially expressed genes in SLC30A9‐deficient OCI‐LY1 cells from RNA‐seq. (B and C) SLC30A9 knockdown decreased cellular proliferative activity in OCI‐LY1 and U2932 cells. Con: control, SLC30A9 KD: lentivirus‐mediated SLC30A9 knockdown. At least three independent experiments were conducted to obtain the data presented as mean  ±  SD. *p < .05, ***p < .001. p‐Values from two‐way ANOVA with Sidak correction. (D and E) SLC30A9 depletion induced cell cycle arrest at the G0/G1 phase in OCI‐LY1 and U2932 cells. Cell cycle distribution was detected using flow cytometry. Con: control, SLC30A9 KD: lentivirus‐mediated SLC30A9 knockdown. At least three independent experiments were conducted to obtain the data presented as mean  ±  SD. ***p < .001, ****p < .0001. p‐Values from unpaired two‐tailed t‐test. (F) Decreased expression level of cyclin D1, CDK2 and cyclin E1 was observed in SLC30A9 knockdown‐treated DLBCL cells. Con: control, SLC30A9 KD: lentivirus‐mediated SLC30A9 knockdown. (G and H) OCI‐LY1 and U2932 cells were transfected with negative control or NAT10 knockout sgRNA, together with an empty vector or SLC30A9‐encoding lentivirus as indicated. After drug selection, those co‐transfected cells were seeded into six‐well plates for cell cycle assays. Ctrl: negative control (non‐target gRNAs), NAT10 KO: CRISPR/Cas9 gene editing system targeting deletion of NAT10 (NAT10 knockout), Vec: empty vector, SLC30A9 OE: SLC30A9 overexpression. Data are shown as the mean ± SD of at least three independent experiments. ****p < .0001. p‐Values from unpaired two‐tailed t‐test. (I) OCI‐LY1 and U2932 cells were transfected with negative control or NAT10 knockout sgRNA, together with an empty vector or SLC30A9‐encoding lentivirus as indicated. After drug selection, those co‐transfected cells were seeded into 96‐well plates for cell proliferation assays. Ctrl: negative control (non‐target gRNAs), NAT10 KO: CRISPR/Cas9 gene editing system targeting deletion of NAT10 (NAT10 knockout), Vec: empty vector, SLC30A9 OE: SLC30A9 overexpression. Data are shown as the mean ± SD of at least three independent experiments. ****p < .0001. p‐Values from unpaired two‐tailed t‐test. (J) KEGG analysis of SLC30A9 associated signalling pathway based on the RNA‐seq data. (K) The levels of AMPK, p‐AMPK, mTOR, p‐mTOR, Raptor, p‐Raptor, p70(S6K) and p‐p70(S6K) were detected by western blot after SLC30A9 knockdown. Con: control, SLC30A9 KD: lentivirus‐mediated SLC30A9 knockdown. (L) The inhibition of the AMPK‐mTOR‐p70(S6K) signalling pathway by NAT10 was reversed with SLC30A9 overexpression. Ctrl: negative control (non‐target gRNAs), NAT10 KO: CRISPR/Cas9 gene editing system targeting deletion of NAT10 (NAT10 knockout), Vec: empty vector, SLC30A9 OE: SLC30A9 overexpression.
FIGURE 7
FIGURE 7
NAT10 inhibitor remodelin exerted anti‐tumour effects and enhanced the efficacy of ibrutinib in DLBCL. (A) The effect of remodelininhibited NAT10 was evaluated by western blot analysis. (B) The IC50 of remodelin in DLBCL cells. (C and D) Treatment with different concentrations of remodelin for 48 h induced G0/G1 phase arrest in DLBCL cells. Data are shown as the mean ± SD of at least three independent experiments. *p < .05, **p < .01, ***p < .001, ns: no significance. p‐Values from unpaired two‐tailed t‐test. (E) The IC50 of ibrutinib in DLBCL cells. (F) OCI‐LY1 and U2932 cells transfected with a negative control or NAT10 knockout were treated with ibrutinib at the indicated concentrations for 48 h before being subjected to CCK‐8 assay. Ctrl: negative control (non‐target gRNAs), NAT10 KO: CRISPR/Cas9 gene editing system targeting deletion of NAT10 (NAT10 knockout). Data are shown as the mean ± SD of at least three independent experiments. *p < .05, **p < .01, ****p  <  .0001. p‐Values from unpaired two‐tailed t‐test. (G) The use of remodelin increases the chemosensitivity of DLBCL cell lines to ibrutinib. CI: combination index. (H and I) A mice xenograft model was constructed to investigate the efficacy of the drug combination in vivo (n = 6). *p < .05, ***p < .001. p‐Values from two‐way ANOVA with Sidak correction.
FIGURE 8
FIGURE 8
Mechanism diagram summarizing that NAT10 facilitates progression of DLBCL by regulating ac4C modification of SLC30A9.

Similar articles

Cited by

References

    1. Schmitz R, Wright GW, Huang DW, et al. Genetics and pathogenesis of diffuse large B‐cell lymphoma. N Engl J Med. 2018;378:1396‐1407. doi:10.1056/NEJMoa1801445 - DOI - PMC - PubMed
    1. Liu Y, Barta SK. Diffuse large B‐cell lymphoma: 2019 update on diagnosis, risk stratification, and treatment. Am J Hematol. 2019;94:604‐616. doi:10.1002/ajh.25460 - DOI - PubMed
    1. Cai Y, Chen X, Lu T, et al. Activation of STING by SAMHD1 deficiency promotes PANoptosis and enhances efficacy of PD‐L1 blockade in diffuse large B‐cell lymphoma. Int J Biol Sci. 2023;19:4627‐4643. doi:10.7150/ijbs.85236 - DOI - PMC - PubMed
    1. Carpio C, Bouabdallah R, Ysebaert L, et al. Avadomide monotherapy in relapsed/refractory DLBCL: safety, efficacy, and a predictive gene classifier. Blood. 2020;135:996‐1007. doi:10.1182/blood.2019002395 - DOI - PMC - PubMed
    1. Hu S, Ren S, Cai Y, et al. Glycoprotein PTGDS promotes tumorigenesis of diffuse large B‐cell lymphoma by MYH9‐mediated regulation of Wnt‐β‐catenin‐STAT3 signaling. Cell Death Differ. 2022;29:642‐656. doi:10.1038/s41418-021-00880-2 - DOI - PMC - PubMed

MeSH terms

LinkOut - more resources