. 2024 Aug;12(4):e1234.
doi: 10.1002/prp2.1234.

Estrogen deprivation and estrogen receptor α antagonism decrease DSS colitis in female mice

Affiliations

Estrogen deprivation and estrogen receptor α antagonism decrease DSS colitis in female mice

Anja Hjelt et al. Pharmacol Res Perspect. 2024 Aug.

Abstract

The association of hormonal contraception with increased risk of inflammatory bowel disease (IBD) observed in females suggests involvement of ovarian hormones, such as estradiol, and the estrogen receptors in the progression of intestinal inflammation. Here, we investigated the effects of prophylactic SERM2 and estradiol supplementation in dextran sulfate sodium-induced colitis using mice with intact ovaries and ovariectomized (OVX) female mice. We found that graded colitis score was threefold reduced in the OVX mice, compared to mice with intact ovaries. Estradiol supplementation, however, aggravated the colitis in OVX mice, increasing the colitis score to a similar level than what was observed in the intact mice. Further, we observed that immune infiltration and gene expression of inflammatory interleukins Il1b, Il6, and Il17a were up to 200-fold increased in estradiol supplemented OVX colitis mice, while a mild but consistent decrease was observed by SERM2 treatment in intact animals. Additionally, cyclo-oxygenase 2 induction was increased in the colon of colitis mice, in correlation with increased serum estradiol levels. Measured antagonist properties of SERM2, together with the other results presented here, indicates an exaggerating role of ERα signaling in colitis. Our results contribute to the knowledge of ovarian hormone effects in colitis and encourage further research on the potential use of ER antagonists in the colon, in order to alleviate inflammation.

Keywords: colitis; dextran sulfate; estradiol; estrogen; estrogen receptor modulators; inflammatory bowel diseases; receptors.


Conflict of interest statement

The authors declare no conflict of interest.

Figures
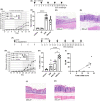
FIGURE 1
FIGURE 1
E2 and SERM2 effects on DSS colitis activity. Schematic diagram of intact mice colitis experiment, where shaded area represents 7‐day DSS challenge (A). In the intact mice, DAI AUC was increased by DSS (n = 8) compared to vehicle control (n = 4), and the DSS + SERM2 (“S2”, n = 8) was statistically significantly lower compared to DSS control (B). The total colitis score (endpoint DAI combined with the histological scoring) showed a similar pattern (C). Representative HE staining of intact DSS colon with severe erosion and immune infiltration (D) and DSS + SERM2 colon, where architecture is intact and immune infiltration is evident (E). Schematic diagram of OVX mice colitis experiment, where again, shaded area represents 7‐day DSS challenge (F). In the OVX animals DSS (n = 7) induced an increase of the DAI score AUC compared to vehicle control (n = 4). Compared to DSS‐group, DSS + SERM2 (n = 7) mice exhibited slightly decreased disease activity, but in the DSS + E2 (n = 7) mice, AUC was significantly increased (G). Total colitis score of OVX mice showed no difference between DSS control and DSS + SERM2, while in the DSS + E2 mice score was statistically significantly increased (H). E2 serum levels correlated with the total colitis score (I). Representative HE staining of OVX DSS colon with minor signs of inflammation (J). Representative HE staining of OVX DSS + E2 colon with edema, hyperproliferation, extensive immune infiltration and crypt loss (K). Data presented as the mean ± SD, statistical significance of AUC's and scoring data was calculated with ordinary one‐way ANOVA, Brown‐Forsythe and Welch ANOVA or Kruskal‐Wallis nonparametrical test according to distribution and variance. Statistical significance was defined as *p ≤ .05, **p ≤ .01, ***p ≤ .001, ****p ≤ .0001.
FIGURE 2
FIGURE 2
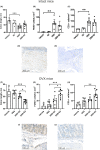
Colon shortening and immune infiltration analysis. Colon length was decreased by DSS (n = 8) in intact mice and SERM2 (n = 5, DSS + SERM2 n = 7) did not significantly alter the length (A). F4/80+ (B) and CD3ε + (C) cells increased with DSS in intact mice. Representative images of anti‐F4/80 (D) and anti‐CD3ε (E) immunostaining in intact DSS mice. In OVX mice, DSS (n = 7) did not affect colon length compared to vehicle (n = 4), but E2 (n = 7) reduced colon length both compared to DSS + SERM2 (n = 7) and DSS (F). F4/80+ (G) and CD3ε + (H) cell counts increased by DSS + E2 (n = 7) and trended toward an increase in DSS + SERM2. Representative images of F4/80 (I) and CD3ε (J) in the colons of OVX DSS mice. In figures B and C, one data point in DSS + SERM2 group is missing due to loss of sample. Data presented as mean ± SD, statistical significance was calculated with ordinary one‐way ANOVA, Brown–Forsythe and Welch ANOVA or Kruskal–Wallis nonparametrical test according to distribution and variance. Statistical significance was defined as *p ≤ .05, **p ≤ .01, ***p ≤ .001, ****p ≤ .0001.
FIGURE 3
FIGURE 3
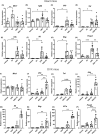
Immune activity‐associated gene expression in distal colon. Gene expression of Mrc1 was increased by SERM2 (“S2”, n = 5) in intact mice (A). Tgfb expression increased with DSS (n = 8) and decreased in the DSS + SERM2 (n = 8, B). Tnf (D) was not affected by DSS + SERM2, while Il10 (C), Il1b (E), Il6 (F), Ifng (G) expression increased by DSS and demonstrated consistent trends toward downregulation by DSS + SERM2, while only Foxp3 (H) the altered statistically significantly. In OVX mice, the treatment did not affect Mrc1 expression (I). Il10, Tnf, Il1b, Il6, Ifng, and Il17a (K–O) expressions were statistically significantly increased in the DSS + E2 group and trended toward an increase by DSS + SERM2, while FoxP3 increased only by DSS + E2 (P). Please note the two‐part y‐axis in figures (L, M, O). Statistical outliers were identified using ROUT with Q = 1% and one datapoint was removed in the DSS group of figure (F) and DSS + E2 group of figure (K). Data was normalized to DSS group as a part of the ΔΔCt analysis and presented as mean ± SD, statistical significance was calculated with ordinary one‐way ANOVA, Brown‐Forsythe and Welch ANOVA or Kruskal‐Wallis nonparametrical test according to distribution and variance. Statistical significance was defined as *p ≤ .05, **p ≤ .01, ***p ≤ .001, ****p ≤ .0001.
FIGURE 4
FIGURE 4
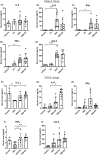
The serum cytokine response to DSS colitis. In intact animals, serum IL‐5 (A) was unaffected by treatment, while IL‐6, IFNγ, TNFα, and CCL2 increased by DSS (n = 8 vs vehicle n = 4, B–E). In OVX mice circulating IL‐5, IL‐6 and TNFα increased by both DSS + SERM2 (n = 7, “S2”) and DSS + E2 (n = 7), although SERM2 increase was statistically significant only in TNFα (F, G, I), The alterations in IFNγ and CCL2 (H, J) levels were not statistically significant. Statistical outliers were identified using ROUT with Q = 1% and one datapoint has been removed in each figure: A DSS + SERM2, D vehicle, F DSS and DSS + E2, G DSS. Data presented as mean ± SD, statistical significance was calculated with ordinary one‐way ANOVA, Brown–Forsythe and Welch ANOVA or Kruskal–Wallis nonparametrical test according to distribution and variance. Statistical significance was defined as *p ≤ .05, **p ≤ .01, ***p ≤ .001, ****p ≤ .0001.
FIGURE 5
FIGURE 5
COX2 and substance P expression in distal colon. DSS + SERM2 (“S2”, n = 7) trended toward a decrease in Ptsg2 expression compared to DSS (n = 7, A) while COX2 protein levels measured by Western blots showed a similar pattern, though statistically significant (B). Representative image of COX2 immunostaining of the colon in intact and OVX mice (C). The expression of Tacr1 was statistically significantly increased by DSS compared to vehicle (n = 4) and trended toward decrease by DSS + SERM2 (D). In OVX mice the transcription of Ptgs2 was highly elevated in the DSS + E2 group (n = 8, E) and COX2 protein levels were elevated by both DSS + SERM2 and DSS + E2 (F). COX2 gene (G) and protein (H) expression correlated with serum E2 levels. Tacr1 levels were increased by DSS + E2 (I), while neuropeptide substance P was not affected by treatments (J). Representative image of substance P immunostaining in the colon of intact and OVX mice (K). Gene expression data was normalized to DSS group as a part of the ΔΔCt analysis and substance P peak area was normalized to reference peptide. Statistical outliers were identified using ROUT with Q = 1% and one datapoint was removed in DSS and DSS + SERM2 group of figures (A) and DSS in figure (B). Data presented as mean ± SD, statistical significance was calculated with ordinary one‐way ANOVA, Brown‐Forsythe and Welch ANOVA or Kruskal‐Wallis nonparametrical test according to distribution and variance. Statistical significance was defined as *p ≤ .05, **p ≤ .01, ***p ≤ .001, ****p ≤ .0001. The correlation of E2 with Ptgs2 and COX2 was calculated using Spearman's Rank Correlation Coefficient analysis.
FIGURE 6
FIGURE 6
SERM2 IC50 values at ER and PGR and hormone receptor expression in the distal colon. In coactivator assays, SERM2 was observed to antagonize ERα, ERβ (A) and PGR (B). In both intact and OVX mice, Pgr was upregulated by both SERM2 (“S2”) and E2 compared to DSS (C, G). Esr1 was decreased by DSS compared to vehicle (D). Esr2 was downregulated in the DSS treated intact mice (E), and so was ΔEsr2Esr1 ratio (F). In OVX mice Esr1 was not affected by treatment (H). In the OVX mice DSS + E2 decreased both Esr2 expression, as well as the ΔEsr2Esr1 expression ratio (I, J). Treatment groups intact: Vehicle n = 4, SERM2 n = 5, DSS and DSS + SERM2 n = 8. Gene expression data was normalized as a part of the ΔΔCt analysis. Statistical outliers were identified using ROUT with Q = 1% and one datapoint has been removed in DSS‐SERM2 in figure (G). Data presented as mean ± SD, statistical significance of (C–J) was calculated with ordinary one‐way ANOVA, Brown‐Forsythe and Welch ANOVA or Kruskal–Wallis nonparametrical test according to distribution and variance. IC50 values were determined using a four‐parameter non‐linear regression analysis. Statistical significance was defined as *p ≤ .05, **p ≤ .01, ***p ≤ .001, ****p ≤ .0001.

Similar articles

Cited by

References

    1. Chang JT. Pathophysiology of inflammatory bowel diseases. N Engl J Med. 2020;383(27):2652‐2664. doi:10.1056/NEJMra2002697 - DOI - PubMed
    1. Kaplan GG, Windsor JW. The four epidemiological stages in the global evolution of inflammatory bowel disease. Nat Rev Gastroenterol Hepatol. 2021;18(1):56‐66. doi:10.1038/s41575-020-00360-x - DOI - PMC - PubMed
    1. Straub RH. The complex role of estrogens in inflammation. Endocr Rev. 2007;28(5):521‐574. doi:10.1210/er.2007-0001 - DOI - PubMed
    1. Wang R, Li Z, Liu S, Zhang D. Global, regional and national burden of inflammatory bowel disease in 204 countries and territories from 1990 to 2019: a systematic analysis based on the global burden of disease study 2019. BMJ Open. 2023;13(3):e065186. doi:10.1136/bmjopen-2022-065186 - DOI - PMC - PubMed
    1. Shah SC, Khalili H, Gower‐Rousseau C, et al. Sex‐based differences in incidence of inflammatory bowel diseases—pooled analysis of population‐based studies from Western countries. Gastroenterology. 2018;155(4):1079‐1089. doi:10.1053/J.GASTRO.2018.06.043 - DOI - PubMed

MeSH terms

LinkOut - more resources