. 2024 Jul 3;16(26):33696-33709.
doi: 10.1021/acsami.4c07404. Epub 2024 Jun 19.

Protecting TiS3 Photoanodes for Water Splitting in Alkaline Media by TiO2 Coatings

Affiliations

Protecting TiS3 Photoanodes for Water Splitting in Alkaline Media by TiO2 Coatings

Nuria Jiménez-Arévalo et al. ACS Appl Mater Interfaces. .

Abstract

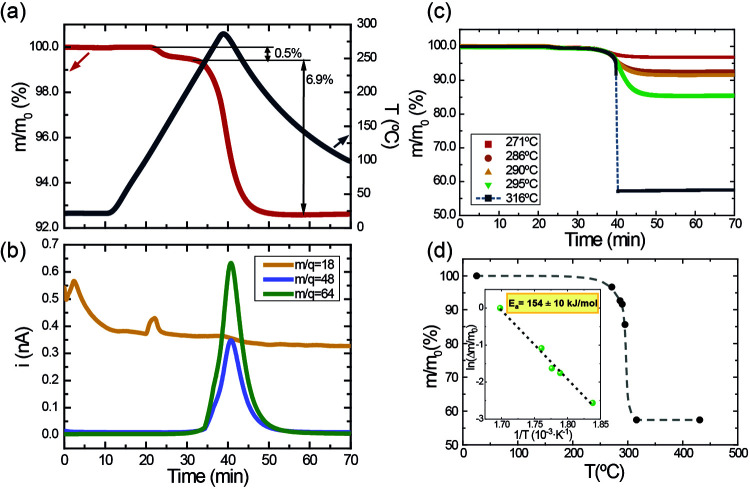
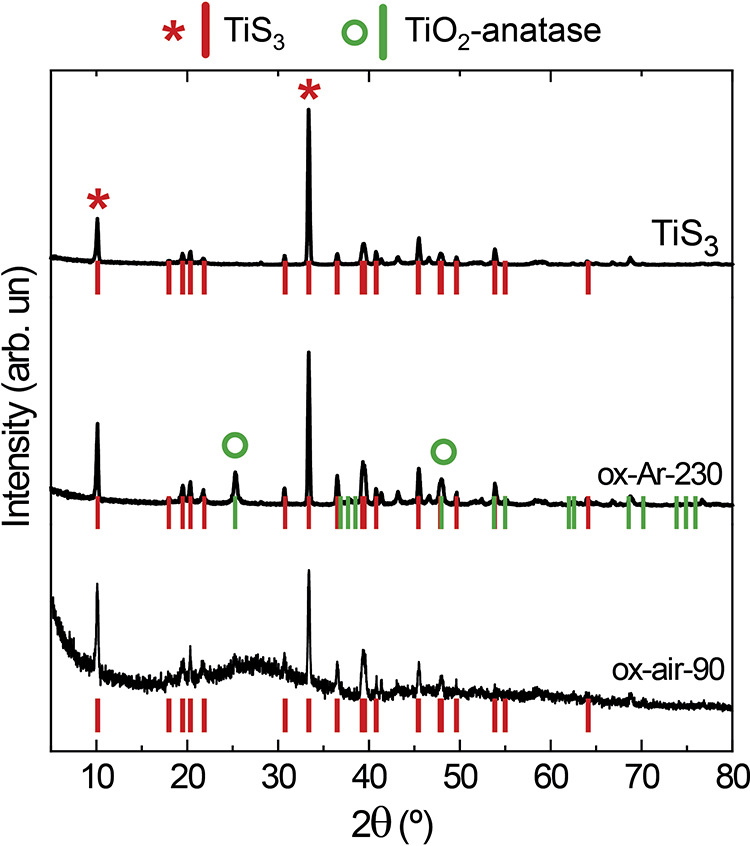
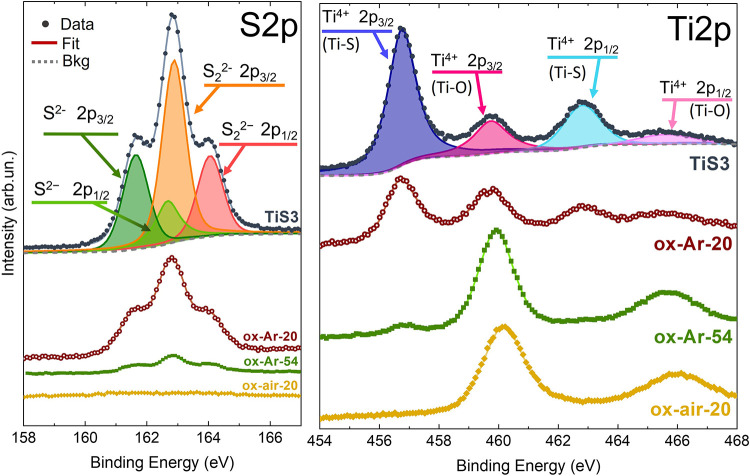
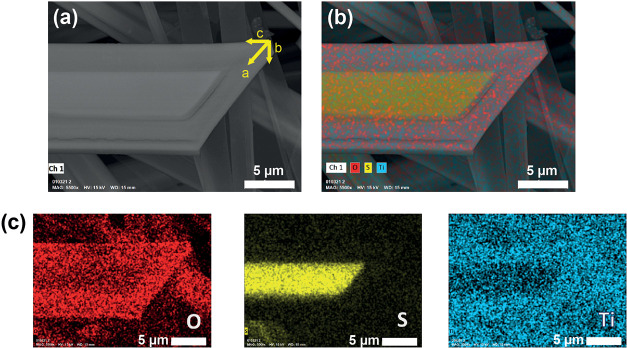
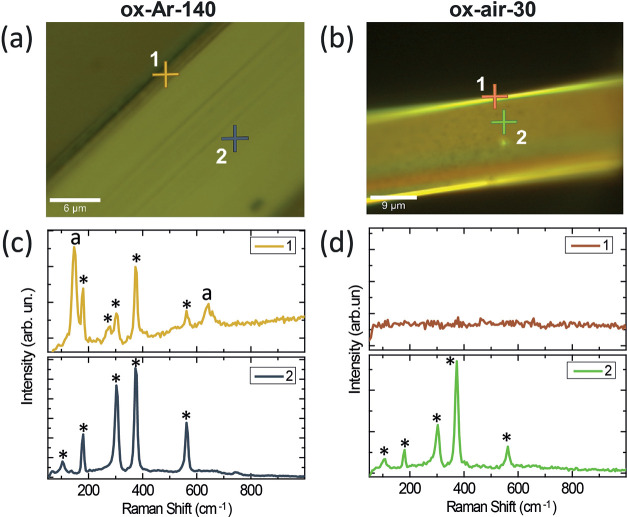
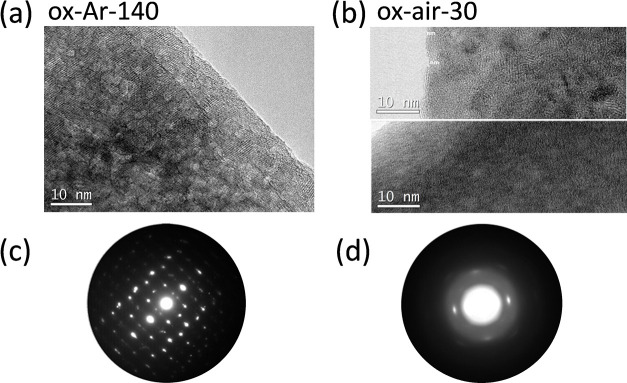
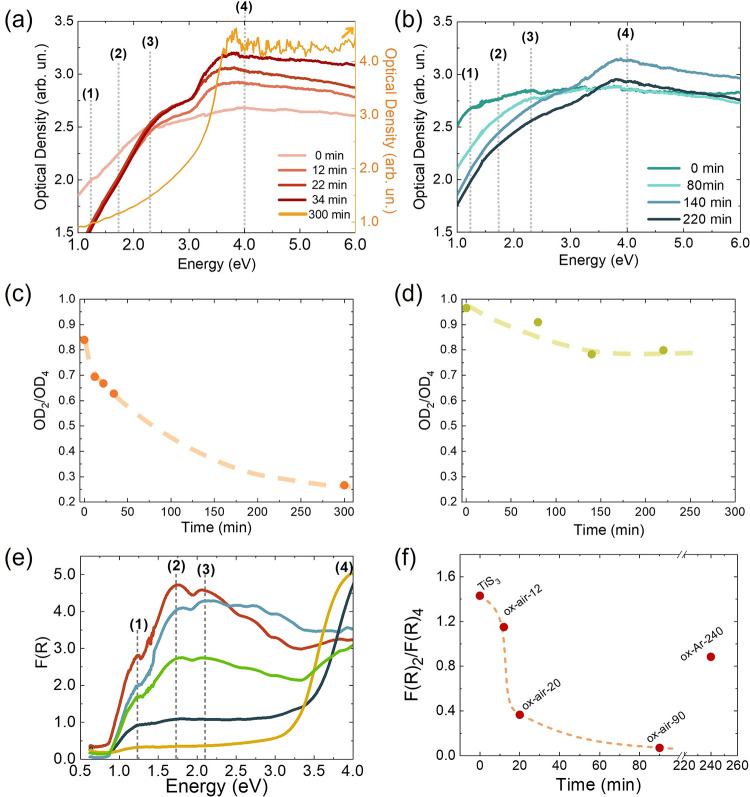
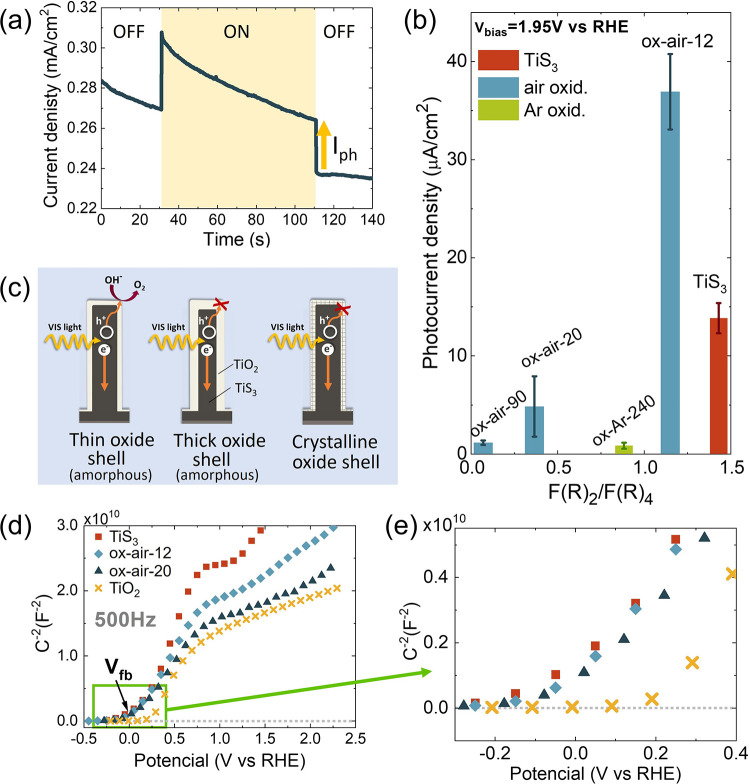
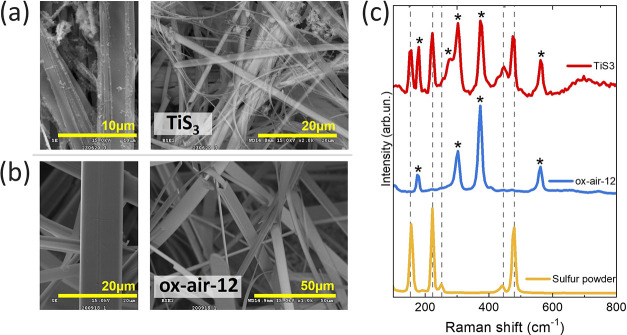
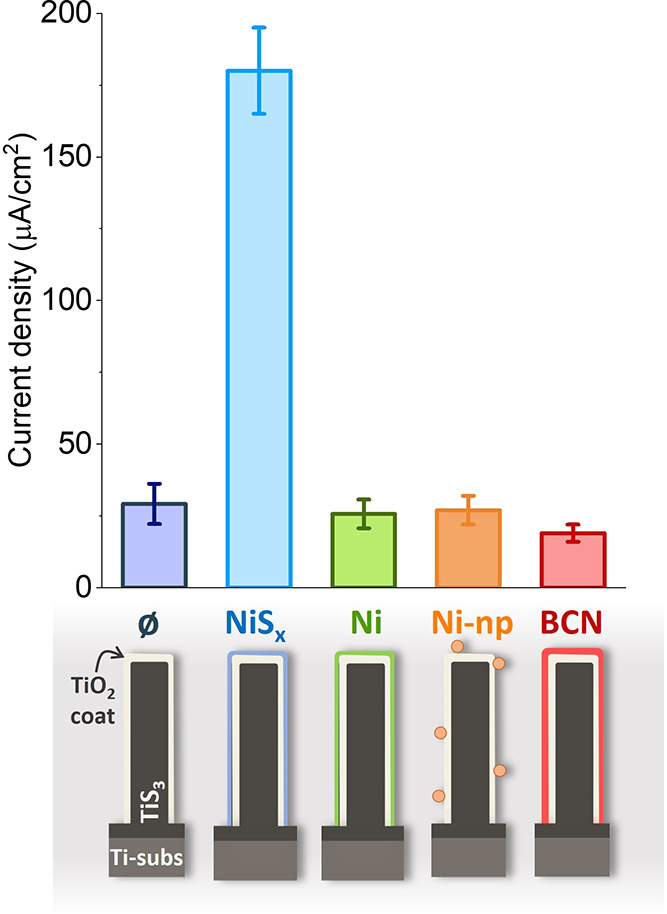
Titanium trisulfide (TiS3) nanoribbons, when coated with titanium dioxide (TiO2), can be used for water splitting in the KOH electrolyte. TiO2 shells can be prepared through thermal annealing to regulate the response of TiS3/TiO2 heterostructures by controlling the oxidation time and growth atmosphere. The thickness and structure of the TiO2 layers significantly influence the photoelectrocatalytic properties of the TiS3/TiO2 photoanodes, with amorphous layers showing better performance than crystalline ones. The oxide layers should be thin enough to transfer photogenerated charge through the electrode-electrolyte interface while protecting TiS3 from KOH corrosion. Finally, the performance of TiS3/TiO2 heterostructures has been improved by coating them with various electrocatalysts, NiSx being the most effective. This research presents new opportunities to create efficient semiconductor heterostructures to be used as photoanodes in corrosive alkaline aqueous solutions.

Keywords: KOH corrosion; TiO2 coatings; heterostructures; hydrogen production; photoelectrolysis; water-splitting.


Conflict of interest statement

The authors declare no competing financial interest.

Figures

Figure 1
Figure 1
(a) TGA curve of TiS3 showing the time evolution of the relative mass (left axis) and temperature (right axis). (b) Mass spectrometric ionic currents (recorded at m/q = 18, 48, and 64) as a function of time, measured during the TGA experiment. (c) Relative mass vs time at different applied temperatures. (d) Relative mass of TiS3 samples when heated at different temperatures between ambient temperature (25 °C) and 450 °C; inset: representation of the Arrhenius equation.
Figure 2
Figure 2
XRD diffractograms of three samples: TiS3, ox-Ar-230, and ox-air-90. TiS3 and TiO2-anatase peaks correspond to PDF 00–015–0783 and PDF 01–071–1167 files, respectively. The most intense peaks of TiS3 and TiO2-anatase are indicated with a red asterisk and a green circle, respectively.
Figure 3
Figure 3
S 2p (left) and Ti 2p (right) XPS spectra for TiS3, ox-Ar-20, ox-Ar-54, and ox-air-20 samples; the data are stacked along the vertical axis for clarity. Experimental data (dotted lines), single fitting curves (colored continuous lines), and total fitting (continuous black line). The single fitting curves and total fitting are shown only for the TiS3 case.
Figure 4
Figure 4
(a) SEM image of sample ox-air-90. (b) EDX mapping analysis superposed with the image in (a). (c) EDX mapping results for oxygen (red), sulfur (yellow), and titanium (blue).
Figure 5
Figure 5
Optical microscopy images of (a) ox-Ar-140 and (b) ox-air-30 samples. (c) Raman spectra in the edge and the center of one ribbon of the ox-Ar-140 sample (marked with 1 and 2 in (a), respectively). (d) Raman spectra for the ox-air-30 sample in the edge and the center of one ribbon (marked with 1 and 2 in (b), respectively). TiS3 peaks are indicated with *, and anatase TiO2 peaks are indicated with “a”.
Figure 6
Figure 6
(a, b) Collection of high-resolution TEM images recorded in ox-Ar-140 and ox-air-30, respectively, and (c, d) the corresponding electron diffraction patterns. They are oriented with respect to the images and the spacing for the most prominent reflections is included.
Figure 7
Figure 7
Optical density spectra obtained from transmittance measurements of TiS3 samples grown on fused silica and oxidized (a) in air (right axis in orange corresponds just to the OD of the sample oxidized for 300 min) and (b) under Ar flow for different times. Ratio between optical density values of the (2) and (4) bands (OD2/OD4) against the oxidation time for samples oxidized (c) in air and (d) under Ar flow whose OD curves are shown in (a, b). (e) Kubelka–Munk function obtained from diffuse reflectance measurements for samples TiS3 (red), ox-air-12 (light blue), ox-air-20 (dark blue), ox-air-90 (yellow), and ox-Ar-240 (green) as a function of the incident photon energy. (f) Relationship between F(R)2 over F(R)4 as a function of the oxidation time. Corresponding samples to the data are labeled in the figure. Dashed lines in c, d, and f are used as visual guides.
Figure 8
Figure 8
(a) Chronoamperometry measurement at 1.95 V vs RHE for ox-air-12 in the dark (OFF) and light (ON). (b) Photocurrent as a function of the oxidation degree estimated by the ratio F(R)2/F(R)4, described in the optical characterization section. (c) Schematic diagram of the formation of the electron–hole pair and the pathway of the hole to the surface of the heterostructure. (d) Mott–Schottky plots for TiS3, ox-air-12, and ox-air-20 at 500 Hz. TiO2 data has been included from ref (24). (e) Zoom to the region closer to C2– = 0 F–2.
Figure 9
Figure 9
SEM images of (a) TiS3 and (b) ox-air-12 at different magnifications after the PEC experiments. (c) Raman spectra of TiS3 and ox-air-12 after the PEC measurements. For comparison, it is also shown the spectra of the sulfur powder collected from the ampules in which the TiS3 samples are synthesized. TiS3 Raman bands are indicated with a *.
Figure 10
Figure 10
Top: Photocurrents obtained at 1.95 V vs RHE for samples oxidized in air for 12 min, without photoelectrocatalyst (ø), with NiSx, Ni thin film (4 nm thick), Ni nanoparticles (Ni-np), and BCN. Bottom: Schematic of the material.

Similar articles

References

    1. Lewis N. S.; Nocera D. G. Powering the planet: Chemical challenges in solar energy utilization. Proc. Natl. Acad. Sci. U.S.A. 2006, 103 (43), 15729–15735. 10.1073/pnas.0603395103. - DOI - PMC - PubMed
    1. Lewis N. S. Toward Cost-Effective Solar Energy Use. Science 2007, 315 (5813), 798–802. 10.1126/science.1137014. - DOI - PubMed
    1. Osterloh F. E.; Parkinson B. A. Recent developments in solar water-splitting photocatalysis. MRS Bull. 2011, 36 (1), 17–22. 10.1557/mrs.2010.5. - DOI
    1. Walter M. G.; Warren E. L.; McKone J. R.; et al. Solar water splitting cells. Chem. Rev. 2010, 110 (11), 6446–6473. 10.1021/cr1002326. - DOI - PubMed
    1. Chen X.; Shen S.; Guo L.; Mao S. S. Semiconductor-based photocatalytic hydrogen generation. Chem. Rev. 2010, 110 (11), 6503–6570. 10.1021/cr1001645. - DOI - PubMed

LinkOut - more resources