

Physiological network approach to prognosis in cirrhosis: A shifting paradigm
- PMID: 38961593
- PMCID: PMC11222171
- DOI: 10.14814/phy2.16133
Physiological network approach to prognosis in cirrhosis: A shifting paradigm
Abstract
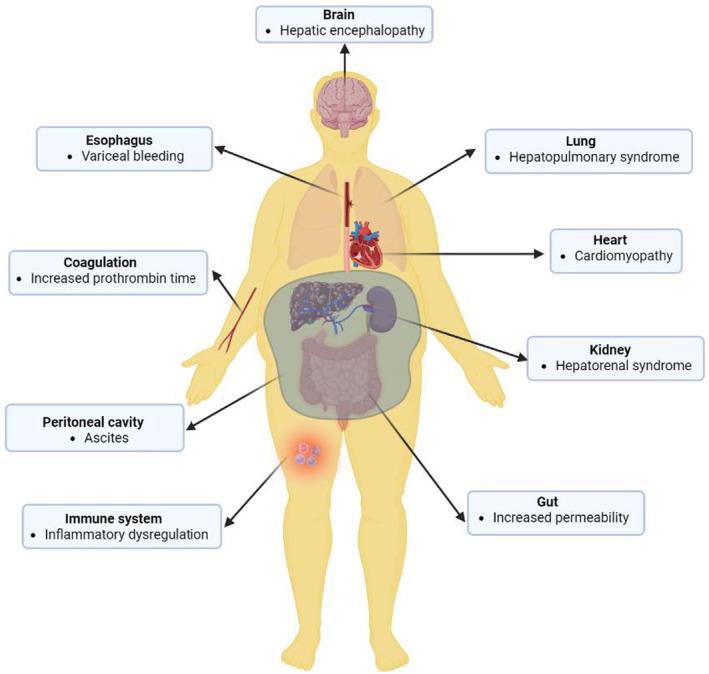
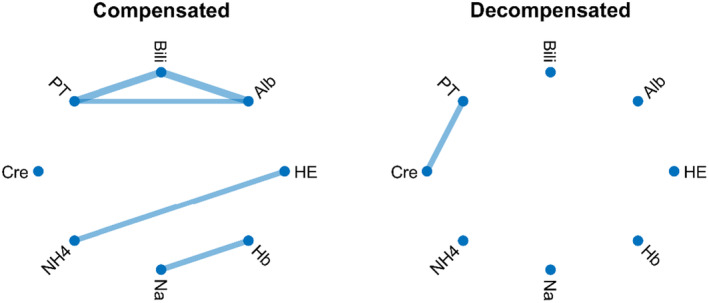
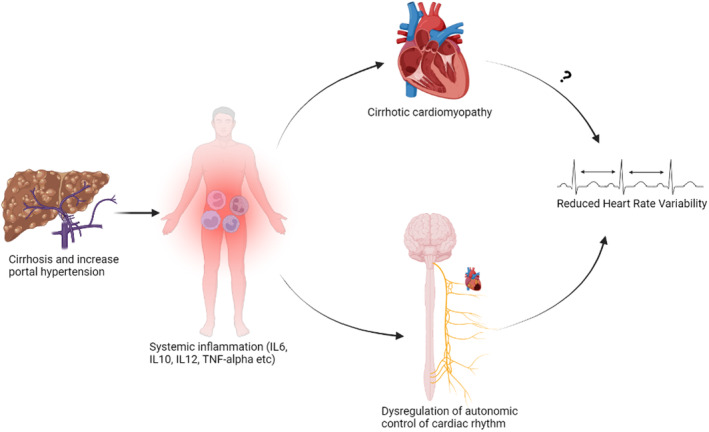
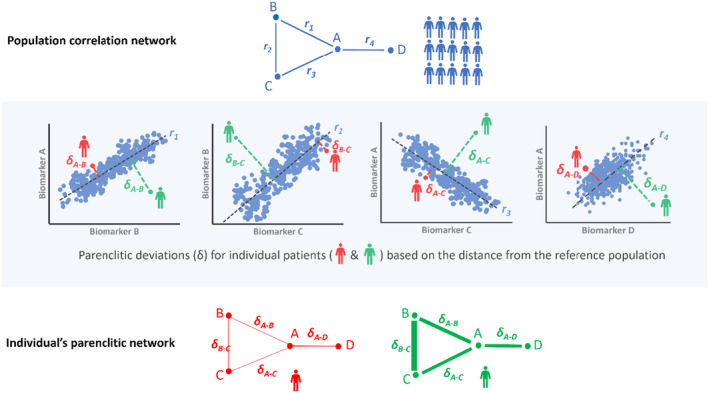
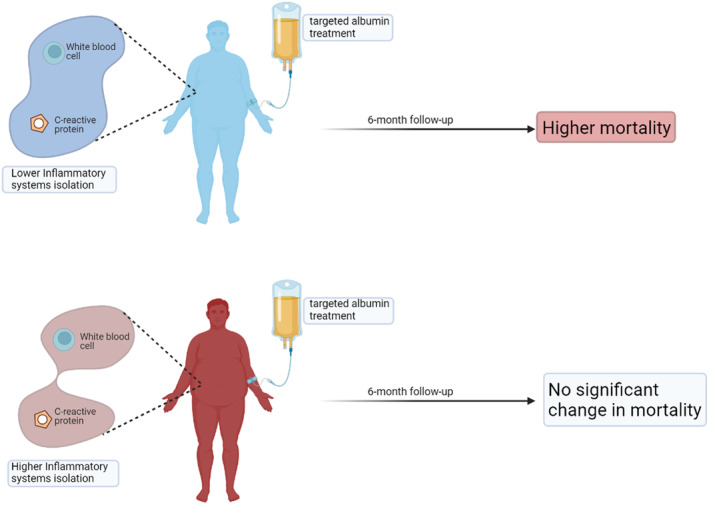
Decompensated liver disease is complicated by multi-organ failure and poor prognosis. The prognosis of patients with liver failure often dictates clinical management. Current prognostic models have focused on biomarkers considered as individual isolated units. Network physiology assesses the interactions among multiple physiological systems in health and disease irrespective of anatomical connectivity and defines the influence or dependence of one organ system on another. Indeed, recent applications of network mapping methods to patient data have shown improved prediction of response to therapy or prognosis in cirrhosis. Initially, different physical markers have been used to assess physiological coupling in cirrhosis including heart rate variability, heart rate turbulence, and skin temperature variability measures. Further, the parenclitic network analysis was recently applied showing that organ systems connectivity is impaired in patients with decompensated cirrhosis and can predict mortality in cirrhosis independent of current prognostic models while also providing valuable insights into the associated pathological pathways. Moreover, network mapping also predicts response to intravenous albumin in patients hospitalized with decompensated cirrhosis. Thus, this review highlights the importance of evaluating decompensated cirrhosis through the network physiologic prism. It emphasizes the limitations of current prognostic models and the values of network physiologic techniques in cirrhosis.
Keywords: cirrhosis; decompensation; liver failure; network physiology; prognosis; systems connectivity.
© 2024 The Author(s). Physiological Reports published by Wiley Periodicals LLC on behalf of The Physiological Society and the American Physiological Society.
Conflict of interest statement
None.
Figures
Similar articles
-
Prognosis and Survival Modelling in Cirrhosis Using Parenclitic Networks.Front Netw Physiol. 2022 Feb 21;2:833119. doi: 10.3389/fnetp.2022.833119. eCollection 2022. Front Netw Physiol. 2022. PMID: 36926100 Free PMC article.
-
Parenclitic Network Mapping Identifies Response to Targeted Albumin Therapy in Patients Hospitalized With Decompensated Cirrhosis.Clin Transl Gastroenterol. 2023 Jun 1;14(6):e00587. doi: 10.14309/ctg.0000000000000587. Clin Transl Gastroenterol. 2023. PMID: 37019645 Free PMC article. Clinical Trial.
-
Significant reduction in heart rate variability is a feature of acute decompensation of cirrhosis and predicts 90-day mortality.Aliment Pharmacol Ther. 2019 Sep;50(5):568-579. doi: 10.1111/apt.15365. Epub 2019 Jul 8. Aliment Pharmacol Ther. 2019. PMID: 31286545
-
The mechanistic and prognostic implications of heart rate variability analysis in patients with cirrhosis.Physiol Rep. 2022 Apr;10(8):e15261. doi: 10.14814/phy2.15261. Physiol Rep. 2022. PMID: 35439350 Free PMC article. Review.
-
Predictors of clinical outcomes in cirrhosis patients.Curr Opin Gastroenterol. 2018 Jul;34(4):266-271. doi: 10.1097/MOG.0000000000000450. Curr Opin Gastroenterol. 2018. PMID: 29846263 Review.
Cited by
-
Interaction between age and blood urea nitrogen to creatinine ratio on mortality in patients with severe cirrhosis: a retrospective cohort study from the MIMIC database.Front Endocrinol (Lausanne). 2025 Mar 5;16:1544223. doi: 10.3389/fendo.2025.1544223. eCollection 2025. Front Endocrinol (Lausanne). 2025. PMID: 40110543 Free PMC article.
-
The Impact of Heart Rate Reduction From Individual Baseline With Propranolol for Primary and Secondary Prophylaxis of Variceal Hemorrhage in Cirrhosis.Clin Transl Sci. 2025 Mar;18(3):e70192. doi: 10.1111/cts.70192. Clin Transl Sci. 2025. PMID: 40052723 Free PMC article.
References
-
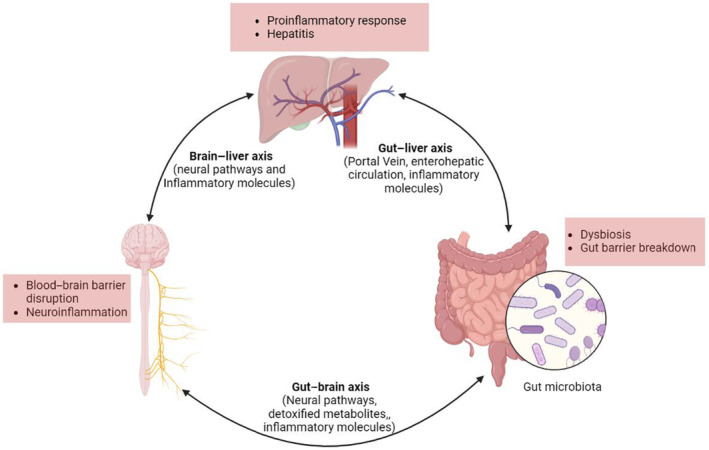
- Albillos, A. , de Gottardi, A. , & Rescigno, M. (2020). The gut–liver axis in liver disease: Pathophysiological basis for therapy. Journal of Hepatology, 72, 558–577. - PubMed
-
- Angeli, P. , Bernardi, M. , Villanueva, C. , Francoz, C. , Mookerjee, R. P. , Trebicka, J. , Krag, A. , Laleman, W. , & Gines, P. (2018). EASL clinical practice guidelines for the management of patients with decompensated cirrhosis. Journal of Hepatology, 69, 406–460. - PubMed
Publication types
MeSH terms
LinkOut - more resources
Full Text Sources
Medical
