. 2024 Oct;23(10):e14263.
doi: 10.1111/acel.14263. Epub 2024 Jul 3.

Transcriptomic and metabolomic changes might predict frailty in SAMP8 mice

Affiliations

Transcriptomic and metabolomic changes might predict frailty in SAMP8 mice

Letizia Dacomo et al. Aging Cell. 2024 Oct.

Abstract

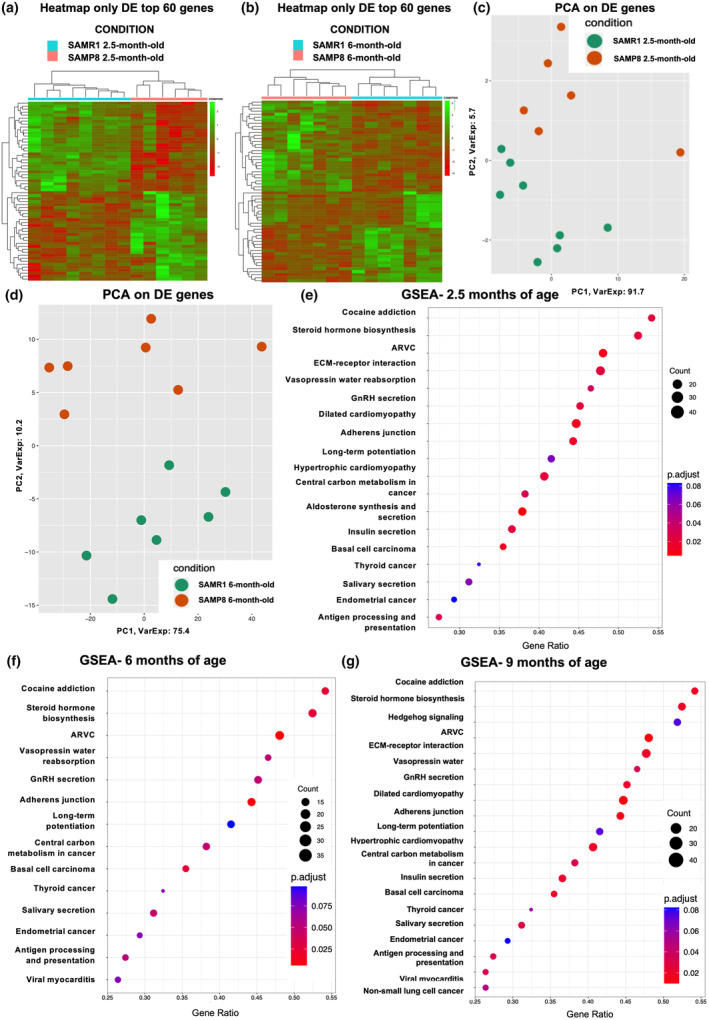
Frailty is a geriatric, multi-dimensional syndrome that reflects multisystem physiological change and is a transversal measure of reduced resilience to negative events. It is characterized by weakness, frequent falls, cognitive decline, increased hospitalization and dead and represents a risk factor for the development of Alzheimer's disease (AD). The fact that frailty is recognized as a reversible condition encourages the identification of earlier biomarkers to timely predict and prevent its occurrence. SAMP8 (Senescence-Accelerated Mouse Prone-8) mice represent the most appropriate preclinical model to this aim and were used in this study to carry transcriptional and metabolic analyses in the brain and plasma, respectively, upon a characterization at cognitive, motor, structural, and neuropathological level at 2.5, 6, and 9 months of age. At 2.5 months, SAMP8 mice started displaying memory deficits, muscle weakness, and motor impairment. Functional alterations were associated with a neurodevelopmental deficiency associated with reduced neuronal density and glial cell loss. Through transcriptomics, we identified specific genetic signatures well distinguishing SAMP8 mice at 6 months, whereas plasma metabolomics allowed to segregate SAMP8 mice from SAMR1 already at 2.5 months of age by detecting constitutively lower levels of acylcarnitines and lipids in SAMP8 at all ages investigated correlating with functional deficits and neuropathological signs. Our findings suggest that specific genetic alterations at central level, as well as metabolomic changes in plasma, might allow to early assess a frail condition leading to dementia development, which paves the foundation for future investigation in a clinical setting.

Keywords: aging; dementia; frailty; motor impairment; neuronal loss; predictive biomarkers; senescent SAMP8 mice.


Conflict of interest statement

We have no conflicts of interest to declare.

Figures

FIGURE 1
FIGURE 1
SAMP8 mice show significant memory deficits, decrease in balance and strength and weight loss throughout aging. Scatter plot with bar are mean ± standard error mean (SEM) of: (a) the discrimination index (DI) of SAMR1 and SAMP8 mice at 2.5, 6 and 9 months of age tested in the NORT (2.5 months: t 38 = 2504, p = 0.0167; 6 months t 26 = 2976 p = 0.0062); (b) latency (s) to cross the wooden beam (9 months: p = 0.0372 Mann–Whitney test) and (c) the number of foot slips for SAMR1 and SAMP8 tested in the beam walking test at 2.5, 6, and 9 months of age (6 months: *p = 0.0161; 9 months: **p = 0.0050 Mann–Whitney test); (d) mouse clinging latency on the grid in the paw grip test (2.5 months: ***p = 0.0009; 6 months: **p = 0.0187 Mann–Whitney's test). (e) Mean ± SEM of SAMR1 and SAMP8 mouse weight. Two‐way ANOVA found a significant interaction genotype × time F (4,152) = 7664, p < 0.0001; ***p < 0.001; ****p < 0.0001 Tukey's multiple comparisons test.
FIGURE 2
FIGURE 2
SAMP8 mouse brain shows growth defects throughout aging. Scatter plot with bar are mean ± SEM of cortical, hippocampal, striatum and whole brain volume of SAMR1 and SAMP8 at the three ages investigated. Statistical analysis carrying by comparing SAMP8 vs. SAMR1 at each single age revealed statistical significance for: Cortex (6 months) t 17 = 4043, p = 0.0008, (9 months) t 12 = 4497, p = 0.0007, Student's t‐test. Hippocampus (6 months) p = 0.0133, (9 months) p = 0.0020, Mann–Whitney's test. Striatum (9 months) t 12 = 2281, p = 0.0416 Student's t‐test. Whole brain (6 months) t 17 = 3583, p = 0.0023, (9 months) t 12 = 4248, p = 0.0011 Student's t‐test. Statistical analysis through a two‐way ANOVA for factors strain and time revealed a significant interaction: F (2,48) = 8.185, p = 0.0009 and a significant effect of age highlighting volume increase only for SAMR1 mice: F (2,48) = 13.08, p < 0.0001. *p < 0.05, **p < 0.001, ***p < 0.001, ****p < 0.001 (Student's t‐test; Šidàk's test).
FIGURE 3
FIGURE 3
SAMP8 mice display progressive reduction in neuronal density in smaller brain areas compared to SAMR1. Scatter plot with bar are mean ± SEM of neuronal density for: (a) whole cortex (p = 0.0152; Mann–Whitney, 2.5 months; t 8 = 2.865, p = 0.0210, 6 months; t 7 = 2.842, p = 0.0250, Student's t‐test; 9 months); (b) motor cortex (p = 0.1320 Mann–Whitney, 2.5 months; t 8 = 2.269, p = 0.0530 Student's t‐test, 6 months; p = 0.0121 Mann–Whitney, 9 months); (c) striatum (t 7 = 0.8097, p = 0.4448, 2.5 months; t 6 = 4228, p = 0.0055, 6 months; t 7 = 4703, p = 0.0022 Student's t‐test, 9 months); (d) neuronal‐marked area for hippocampal subregions (CA1: p = 0.1905 Mann–Whitney, 2.5 months; t 6 = 1.944, p = 0.0998, 6 months; t 8 = 6.029, p = 0.0003, 9 months; Student's t‐test. CA3: T 7 = 0.0068, p = 0.9948, 2.5 months; t 6 = 0.4061, p = 0.6988, 6 months; t 8 = 6.102, p = 0.0003, 9 months; Student's t‐test. DG: T 7 = 2985, p = 0.0204, 2.5 months; t 6 = 0.4486, p = 0.6694, 6 months; t 8 = 3120, p = 0.0142, 9 months; Student's t‐test). Representative images of NISSL‐stained sections of the cortex, striatum and hippocampal subregions compare SAMR1 with SAMP8 mice at 9 months of age. *p < 0.05, **p < 0.001, ***p < 0.001.
FIGURE 4
FIGURE 4
SAMP8 mice show changes in glial cell density throughout aging. Scatter plot with bar are mean ± SEM of Iba1‐marked area, immunolabelling microglial cells, in the (a) cortex (6 months: T 8 = 3213, p = 00124; 9 months: T 9 = 2947 p = 0.0163 Student's t‐test) and (b) hippocampus of SAMR1 and SAMP8 mice at 2.5, 6, and 9 months of age. (c, d) Representative images of cortical and hippocampal brain slices immunostained with the anti‐Iba1 antibody comparing cell density at the three ages investigated. (e) Scatter plot with bar are mean ± SEM of GFAP‐marked area, immunolabelling astroglial cells in the hippocampus (6 months: T 8 = 3335, p = 0.0103; 9 months: T 9 = 2287, p = 00480 Student's t‐test). (f) Representative images of hippocampal brain slices immunostained with the anti‐GFAP antibody comparing cell density at the three ages investigated in the two mouse groups; *p < 0.05.
FIGURE 5
FIGURE 5
SAMP8 mice are characterized by transcriptomic signatures. Heatmaps of top 60 DE genes in SAMP8 with respect to SAMR1 mice at 2.5 (a) and 6 months (b). In red are represented downregulated DE genes, while in green upregulated ones. PCA plots of DE genes in SAMP8 with respect to SAMR1 mice at 2.5 (c) and 6 months (d). KEGG GSEA for SAMP8 compared to SAMR1 mice at 2.5 (e), 6 (f), and 9 months (g). The y‐axis represents the name of the pathway, the x‐axis represents the gene ratio, dot size represents the number of different genes, and the color indicates the adjusted p‐value.
FIGURE 6
FIGURE 6
Plasma metabolomics changes in SAMP8 mice are observed already at 2.5 months of age. OPLS‐DA score plots representative of the metabolomics differences between SAMP8 and SAMR1 at 2.5, 6, and 9 months of age respectively (a). Volcano plots represent the metabolic statistically significant difference (Wilcoxon–Mann–Whitney) between SAMP8 and SAMR1 at 2.5, 6, and 9 months of age respectively. Red and green dots highlighted the increased and decreased statistically significant different metabolites in the comparison of interest (b). Hierarchical clustering heatmaps of the statistically significant different metabolites between SAMP8 and SAMR1 at 2.5, 6, and 9 months of age, respectively (c).
SCHEME 1
SCHEME 1
Experimental flowchart.

Similar articles

Cited by

References

    1. Balducci, C. , & Forloni, G. (2014). In vivo application of beta amyloid oligomers: A simple tool to evaluate mechanisms of action and new therapeutic approaches. Current Pharmaceutical Design, 20, 2491–2505. 10.2174/13816128113199990497 - DOI - PubMed
    1. Balducci, C. , Paladini, A. , Micotti, E. , Tolomeo, D. , La Vitola, P. , Grigoli, E. , Richardson, J. C. , & Forloni, G. (2015). The continuing failure of Bexarotene in Alzheimer's disease mice. Journal of Alzheimer's Disease, 46(2), 471–482. 10.3233/JAD-150029 - DOI - PubMed
    1. Baulieu, E. E. , Robel, P. , & Schumacher, M. (2001). Neurosteroids: Beginning of the story. International Review of Neurobiology, 46, 1–32. 10.1016/s0074-7742(01)46057-0 - DOI - PubMed
    1. Beauchet, O. , Allali, G. , Annweiler, C. , & Verghese, J. (2016). Association of Motoric Cognitive Risk Syndrome with Brain Volumes: Results from the GAIT study. The Journals of Gerontology. Series A, Biological Sciences and Medical Sciences, 71, 1081–1088. 10.1093/gerona/glw012 - DOI - PubMed
    1. Bettio, L. E. B. , Rajendran, L. , & Gil‐Mohapel, J. (2017). The effects of aging in the hippocampus and cognitive decline. Neuroscience and Biobehavioral Reviews, 79, 66–86. 10.1016/j.neubiorev.2017.04.030 - DOI - PubMed