

Temporal sex specific brain gene expression pattern during early rat embryonic development
- PMID: 38961864
- PMCID: PMC11219815
- DOI: 10.3389/fcell.2024.1343800
Temporal sex specific brain gene expression pattern during early rat embryonic development
Abstract
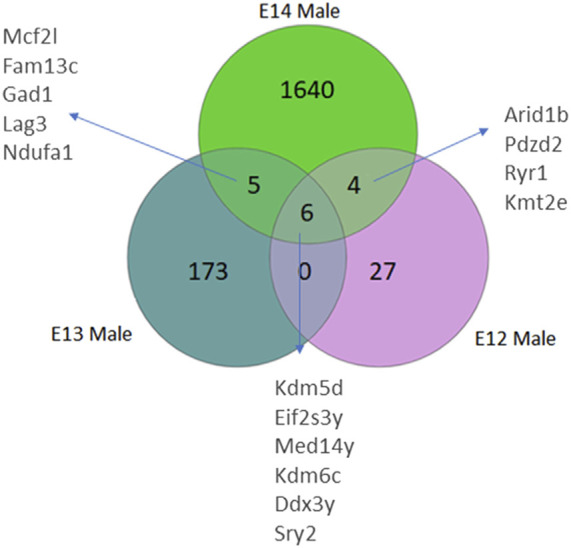
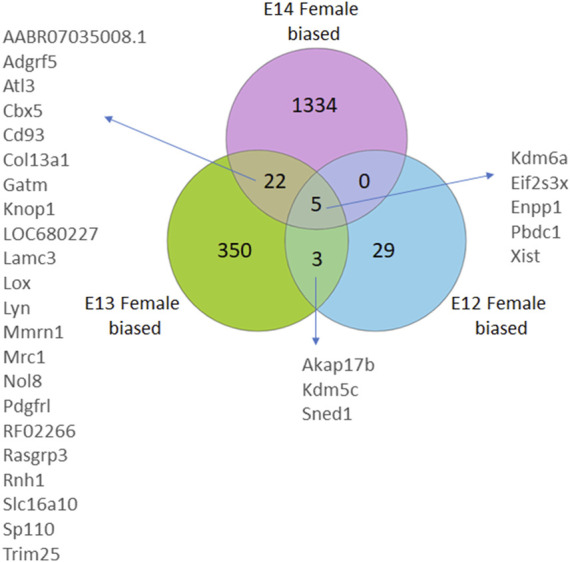
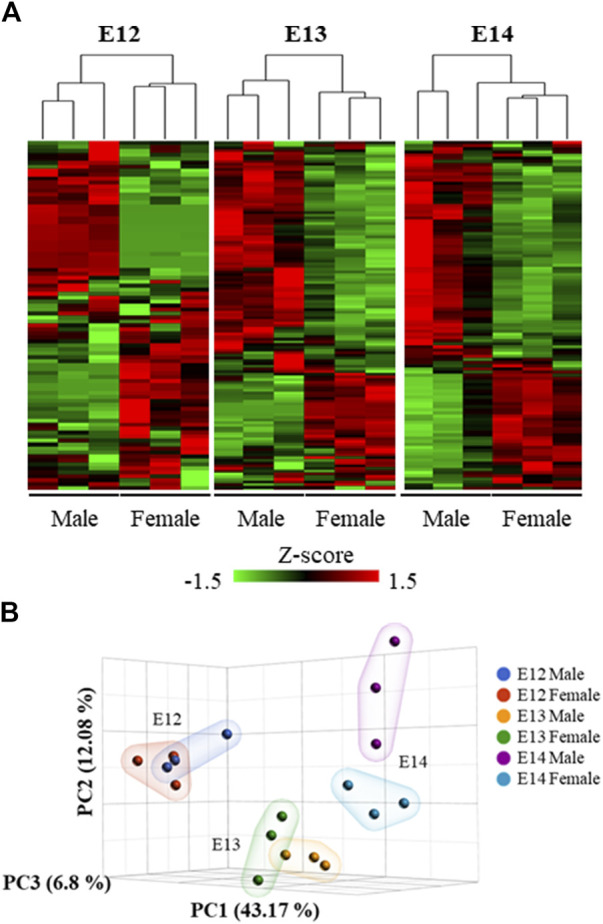
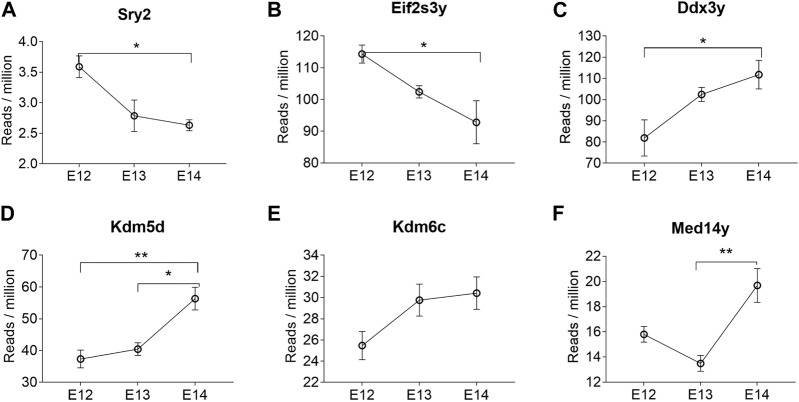
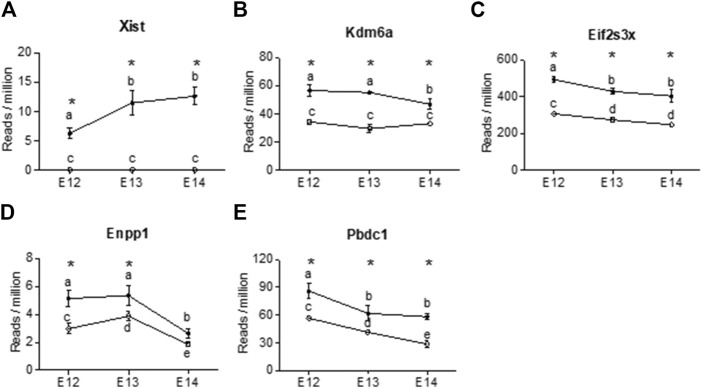
Background: The classical concept of brain sex differentiation suggests that steroid hormones released from the gonads program male and female brains differently. However, several studies indicate that steroid hormones are not the only determinant of brain sex differentiation and that genetic differences could also be involved. Methods: In this study, we have performed RNA sequencing of rat brains at embryonic days 12 (E12), E13, and E14. The aim was to identify differentially expressed genes between male and female rat brains during early development. Results: Analysis of genes expressed with the highest sex differences showed that Xist was highly expressed in females having XX genotype with an increasing expression over time. Analysis of genes expressed with the highest male expression identified three early genes, Sry2, Eif2s3y, and Ddx3y. Discussion: The observed sex-specific expression of genes at early development confirms that the rat brain is sexually dimorphic prior to gonadal action on the brain and identifies Sry2 and Eif2s3y as early genes contributing to male brain development.
Keywords: RNA sequencing; differentiation; neuronal; sex chromosome; sexual dimorphism.
Copyright © 2024 Paylar, Pramanik, Bezabhe and Olsson.
Conflict of interest statement
The authors declare that the research was conducted in the absence of any commercial or financial relationships that could be construed as a potential conflict of interest.
Figures
Similar articles
-
Sexually dimorphic gene expression in mouse brain precedes gonadal differentiation.Brain Res Mol Brain Res. 2003 Oct 21;118(1-2):82-90. doi: 10.1016/s0169-328x(03)00339-5. Brain Res Mol Brain Res. 2003. PMID: 14559357
-
Identification of sexually dimorphic genes in the neonatal mouse cortex and hippocampus.Brain Res. 2014 May 8;1562:23-38. doi: 10.1016/j.brainres.2014.03.017. Epub 2014 Mar 22. Brain Res. 2014. PMID: 24661915 Free PMC article.
-
New candidate genes identified for controlling mouse gonadal sex determination and the early stages of granulosa and Sertoli cell differentiation.Biol Reprod. 2010 Feb;82(2):380-9. doi: 10.1095/biolreprod.109.079822. Epub 2009 Oct 28. Biol Reprod. 2010. PMID: 19864314 Free PMC article.
-
The potential role of SRY in epigenetic gene regulation during brain sexual differentiation in mammals.Adv Genet. 2014;86:135-65. doi: 10.1016/B978-0-12-800222-3.00007-3. Adv Genet. 2014. PMID: 25172349 Review.
-
Sex determination and gonadal sex differentiation in the chicken model.Int J Dev Biol. 2018;62(1-2-3):153-166. doi: 10.1387/ijdb.170319cs. Int J Dev Biol. 2018. PMID: 29616724 Review.
Cited by
-
Effects of chronic insecticide exposure on neuronal network development in vitro in rat cortical cultures.Arch Toxicol. 2024 Nov;98(11):3837-3857. doi: 10.1007/s00204-024-03840-0. Epub 2024 Aug 20. Arch Toxicol. 2024. PMID: 39162819 Free PMC article.
-
Transcriptomic sex differences in early human fetal brain development.Commun Biol. 2025 Apr 25;8(1):664. doi: 10.1038/s42003-025-08070-3. Commun Biol. 2025. PMID: 40281071 Free PMC article.
-
A Transcriptomic Dataset of Embryonic Murine Telencephalon of Fmr1-Deficient Mice.Sci Data. 2025 Jun 2;12(1):927. doi: 10.1038/s41597-025-05104-7. Sci Data. 2025. PMID: 40456813 Free PMC article.
References
LinkOut - more resources
Full Text Sources