

Review
doi: 10.1097/CLD.0000000000000243.
eCollection 2024 Jan-Jun.
Liver fibrosis: Our evolving understanding
Affiliations
- PMID: 38961878
- PMCID: PMC11221862
- DOI: 10.1097/CLD.0000000000000243
Item in Clipboard
Review
Liver fibrosis: Our evolving understanding
Clin Liver Dis (Hoboken).
.
No abstract available
Conflict of interest statement
The author has no conflicts to report.
Figures
Frontispiece from Giovanni Battista Morgagni’s book, De sedibus et causis morborum per anatomen indagatis libri quinque. Venetiis: ex Thypographia Remondiniana; 1761. Available at the Open Library (https://openlibrary.org/ )
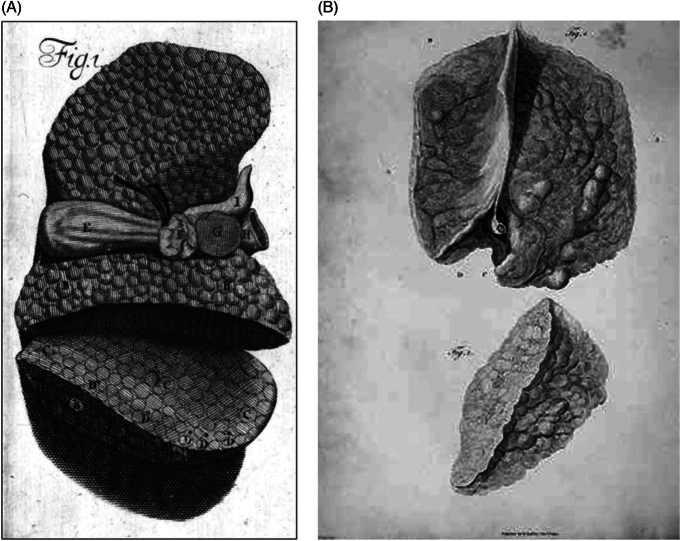
(A) John Browne’s illustration of a glandulous-appearing (ie, cirrhotic) liver. Key: Browne’s own upper case letters, A–G, are shown within the drawing of the cirrhotic liver itself): A, left lobe; B, concave part of the right lobe; C, cut surface of the right lobe; D, black spots, possibly representing divided vessels; E, gallbladder; F, portal vein together with the bile duct; G, liver tissue lying between the vena cava and the portal vein and bile duct; and H, vena cava. (B) Matthew Baillie’s illustration of a cirrhotic liver. From a series of engravings accompanied with explanations that are intended to illustrate the morbid anatomy of some of the most important parts of the human body, Fascicle 5, Plate II. A portion of the external surface (top) and cross-section (bottom) of the liver studded with tubercles. Line drawings by William Clift (John Hunter’s former assistant) and engraving by James Basire.
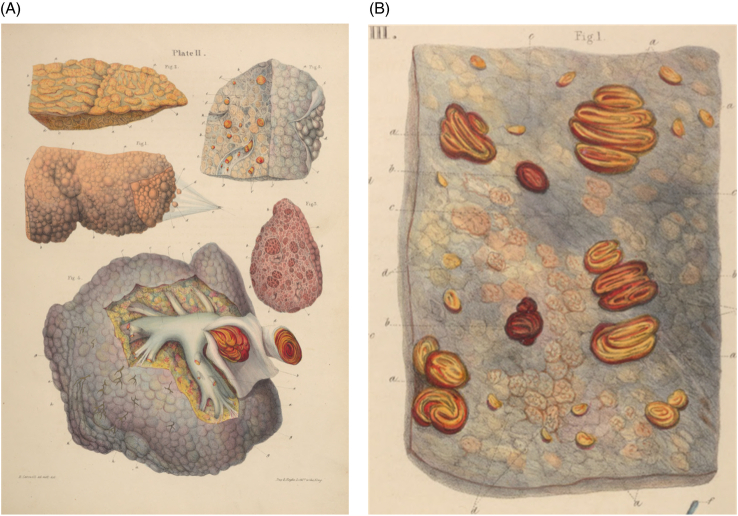
Plates from Carswell’s 1838 book Elementary Forms of Disease. (A) Plate shows various stages of cirrhosis in humans and (mid-right) a cow, with a human liver showing venous compression (bottom). The upper right shows the same liver, with lobules surrounded by fibrous tissue. (B) Section of the same human liver (above in A), showing atrophy and fibrous replacement.
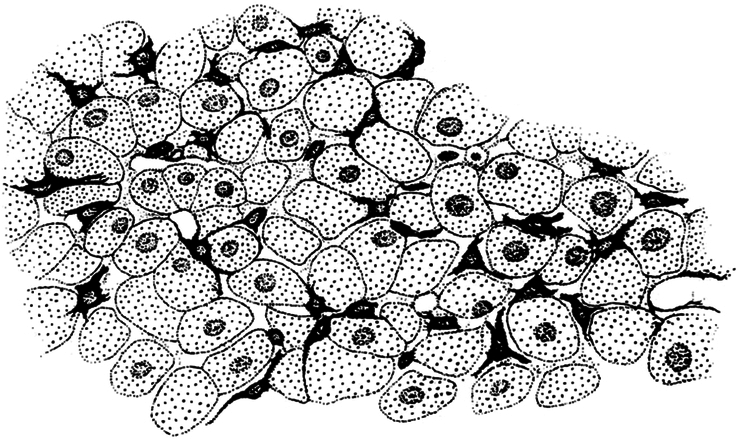
Kupffer’s drawing of Sternzellen in a dog liver, as stained by the gold chloride method.
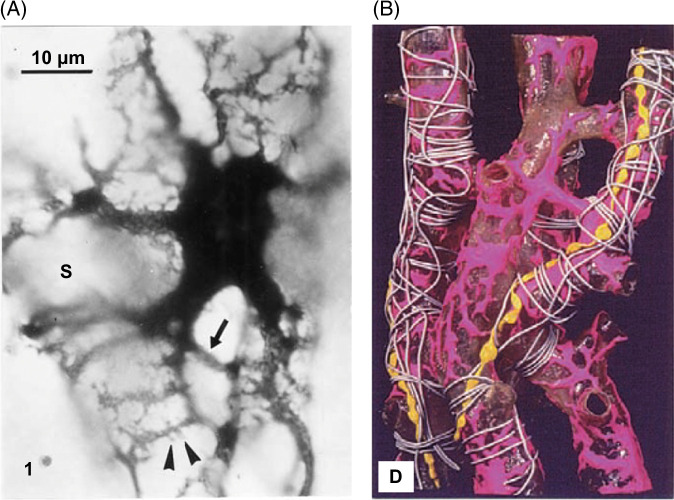
Images from Kenjiro Wake, showing: (A) The complexity of HSC processes and relationship to the sinusoid. (B) Rat HSC showing complex processes around sinusoids, Golgi silver method. Reprinted from Wake. (https://creativecommons.org/licenses/by-nc/4.0/ ).
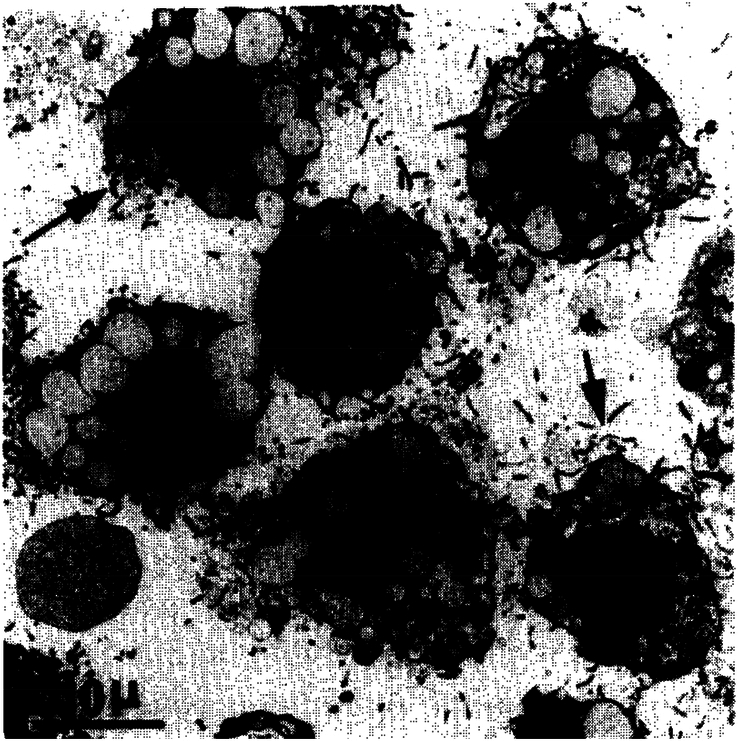
HSCs isolated from rat liver by density gradient centrifugation. Note the presence of lipid droplets that indent the nucleus and the irregular cellular outlines due to the long processes. Reprinted with permission from Knook et al.
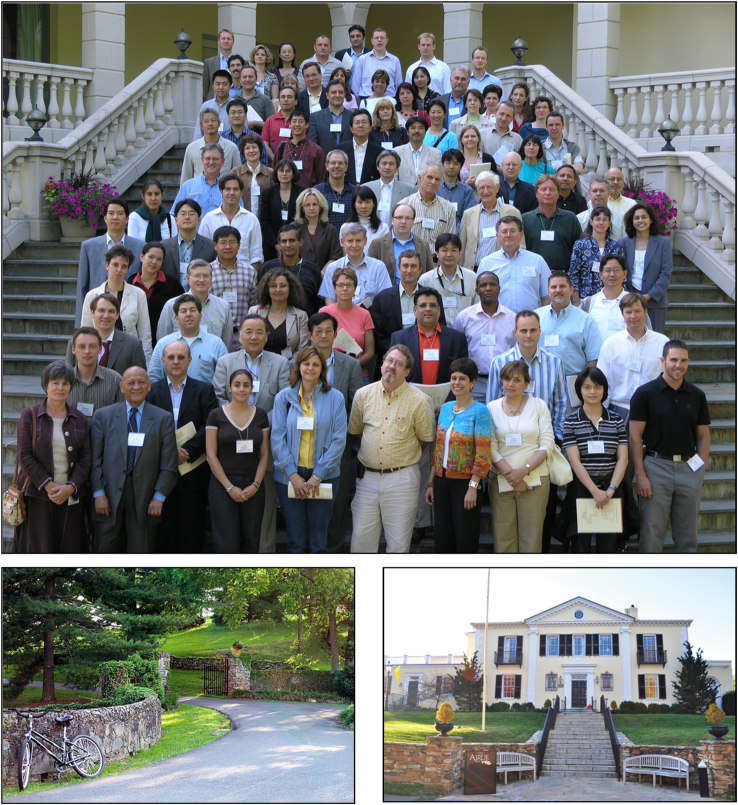
Attendees at the 2006 AASLD Hepatic Fibrosis Single Topic Conference in Airlie, Virginia. Lower panels show the conference center and grounds. Photo courtesy of Hitoshi Yoshiji.
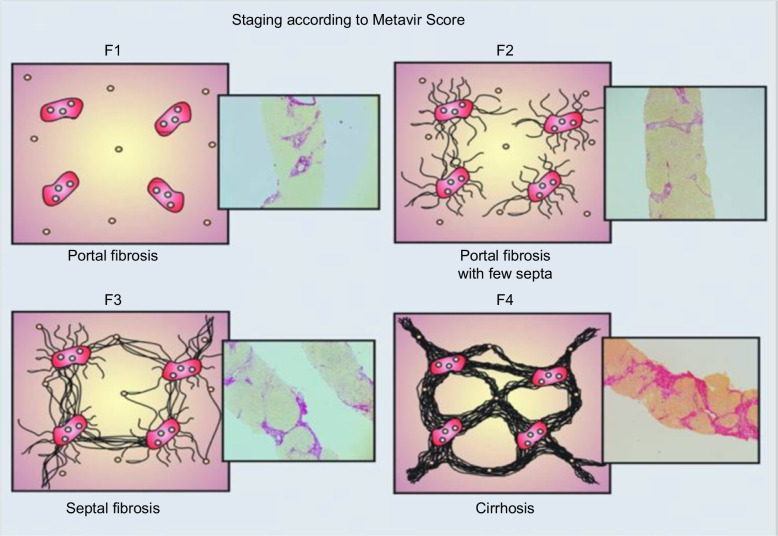
Schematic of Metavir scoring system for chronic hepatitis C. Reprinted with permission from Asselah et al.
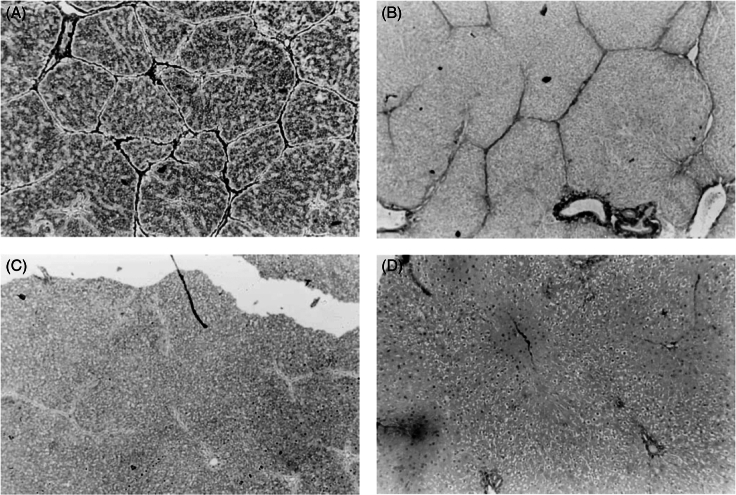
Regression of rat liver fibrosis, as shown in John Iredale et al’s landmark paper. Top panels show reticulin (A, left) and Sirius red (B, right) stained livers after 4 weeks of carbon tetrachloride injections. Bottom panels (reticulin [C, left], Sirius red [D, right]) show the liver after 28 days of recovery, with fibrous septae mostly gone. Reprinted with permission from Iredale et al.
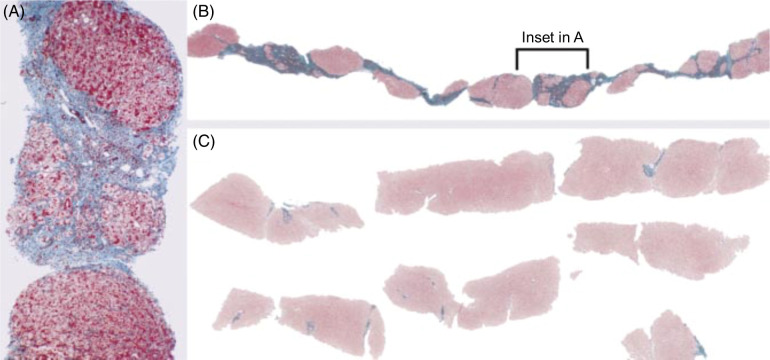
Three biopsies over 42 months in a patient with chronic hepatitis B infection, treated after the first biopsy with lamivudine. The first biopsy (A) shows cirrhosis with sinusoidal fibrosis, while (B) the second shows enlargement of cirrhotic nodules and the absence of sinusoidal fibrosis. In (C), the third biopsy, there is no cirrhosis. Reprinted from Wanless et al. © 2010 College of American Pathologists.
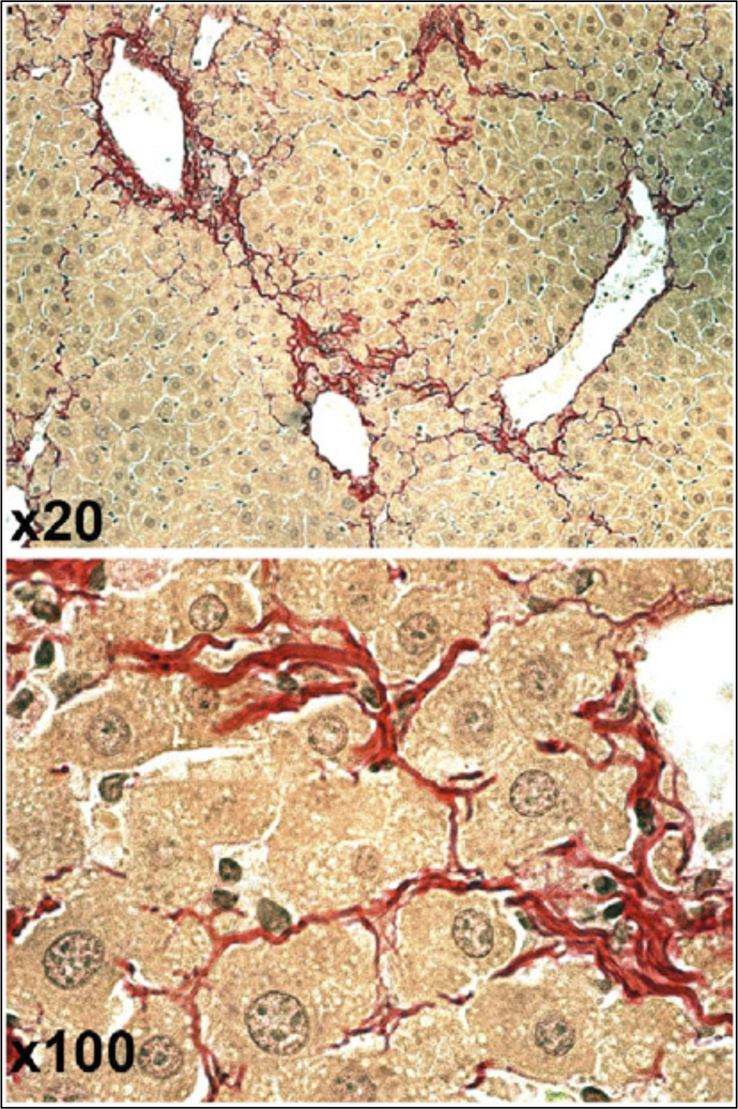
Collagen reorganization (fibril splitting) rather than proteolysis during fibrosis regression in a mouse model. The images, at 2 different magnifications, show hepatocytes “invading” fibrous septae at week 8 of recovery after 36 weeks of carbon tetrachloride treatment. Reprinted with permission from Popov et al.
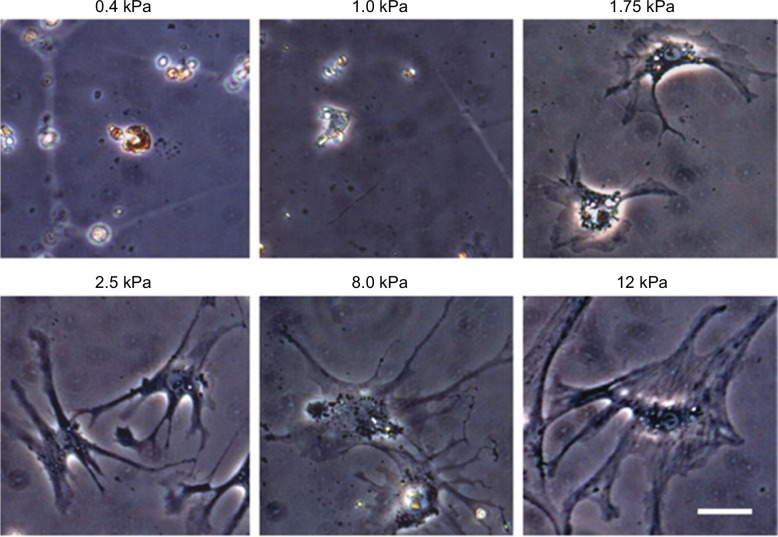
HSCs showing varying levels of myofibroblastic activation when cultured on polyacrylamide supports of varying stiffness ranging from soft (0.4 kPa) to stiff (12 kPa). The phenotypes are stable for at least 2 weeks but can change if stiffness is altered. Size bar, 50 μm. Reprinted from Olsen et al.
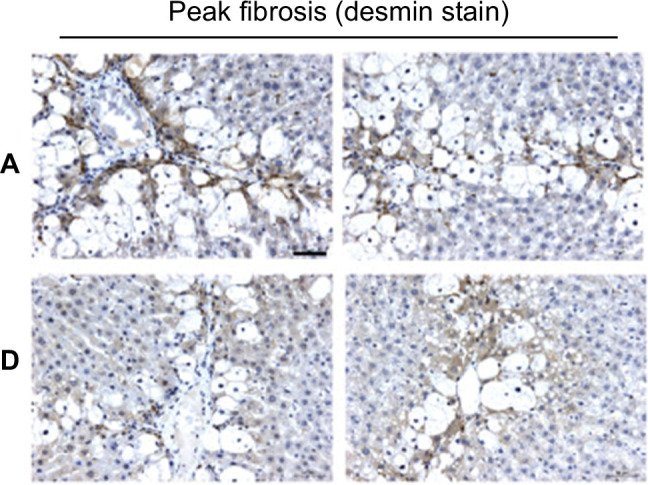
Desmin stain showing peak fibrosis in carbon-tetrachloride rats with 2 generations of male ancestors treated with vehicle (row A, 2 animals represented) or with carbon tetrachloride (row D, 2 animals), demonstrating that epigenetic adaptation over generations protects against fibrosis. Reprinted with permission from Zeybel et al.

Similar articles
-
Engineering and Monitoring 3D Cell Constructs with Time-Evolving Viscoelasticity for the Study of Liver Fibrosis In Vitro.Bioengineering (Basel). 2021 Jul 27;8(8):106. doi: 10.3390/bioengineering8080106. Bioengineering (Basel). 2021. PMID: 34436109 Free PMC article.
-
Evolving challenges in hepatic fibrosis.Nat Rev Gastroenterol Hepatol. 2010 Aug;7(8):425-36. doi: 10.1038/nrgastro.2010.97. Epub 2010 Jun 29. Nat Rev Gastroenterol Hepatol. 2010. PMID: 20585339 Review.
-
Evolving strategies for liver fibrosis staging: Non-invasive assessment.World J Gastroenterol. 2017 Jan 14;23(2):191-196. doi: 10.3748/wjg.v23.i2.191. World J Gastroenterol. 2017. PMID: 28127192 Free PMC article.
-
Evolving Insights on Metabolism, Autophagy, and Epigenetics in Liver Myofibroblasts.Front Physiol. 2016 Jun 1;7:191. doi: 10.3389/fphys.2016.00191. eCollection 2016. Front Physiol. 2016. PMID: 27313533 Free PMC article. Review.
-
Apoptosis and angiogenesis: an evolving mechanism for fibrosis.FASEB J. 2013 Oct;27(10):3893-901. doi: 10.1096/fj.12-214189. Epub 2013 Jun 19. FASEB J. 2013. PMID: 23783074 Free PMC article. Review.
References
-
- Franken FH. History of hepatology In: Csomos G, Thaler H, eds. Clinical Hepatology. Springer-Verlag; 1983:1–15.
-
- Porzionato A, Macchi V, Stecco C, Parenti A, De Caro R. The anatomical school of Padua. Anat Rec (Hoboken). 2012;295:902–916. - PubMed
-
- Zampieri F, Zanatta A, Thiene G. An etymological “autopsy” of Morgagni’s title: De sedibus et causis morborum per anatomen indagatis (1761). Hum Pathol. 2014;45:12–16. - PubMed
-
- Ferrus G. Foie In: Adelon, Andral, Beclard, eds. Dictionnaire de medecine. Bechet; 1824:210–212.
Publication types
LinkOut - more resources
Full Text Sources
