. 2024 May;1(5):10.1056/aioa2300009.
doi: 10.1056/aioa2300009. Epub 2024 Apr 25.

AI-MARRVEL - A Knowledge-Driven AI System for Diagnosing Mendelian Disorders

Affiliations

AI-MARRVEL - A Knowledge-Driven AI System for Diagnosing Mendelian Disorders

Dongxue Mao et al. NEJM AI. 2024 May.

Abstract

Background: Diagnosing genetic disorders requires extensive manual curation and interpretation of candidate variants, a labor-intensive task even for trained geneticists. Although artificial intelligence (AI) shows promise in aiding these diagnoses, existing AI tools have only achieved moderate success for primary diagnosis.

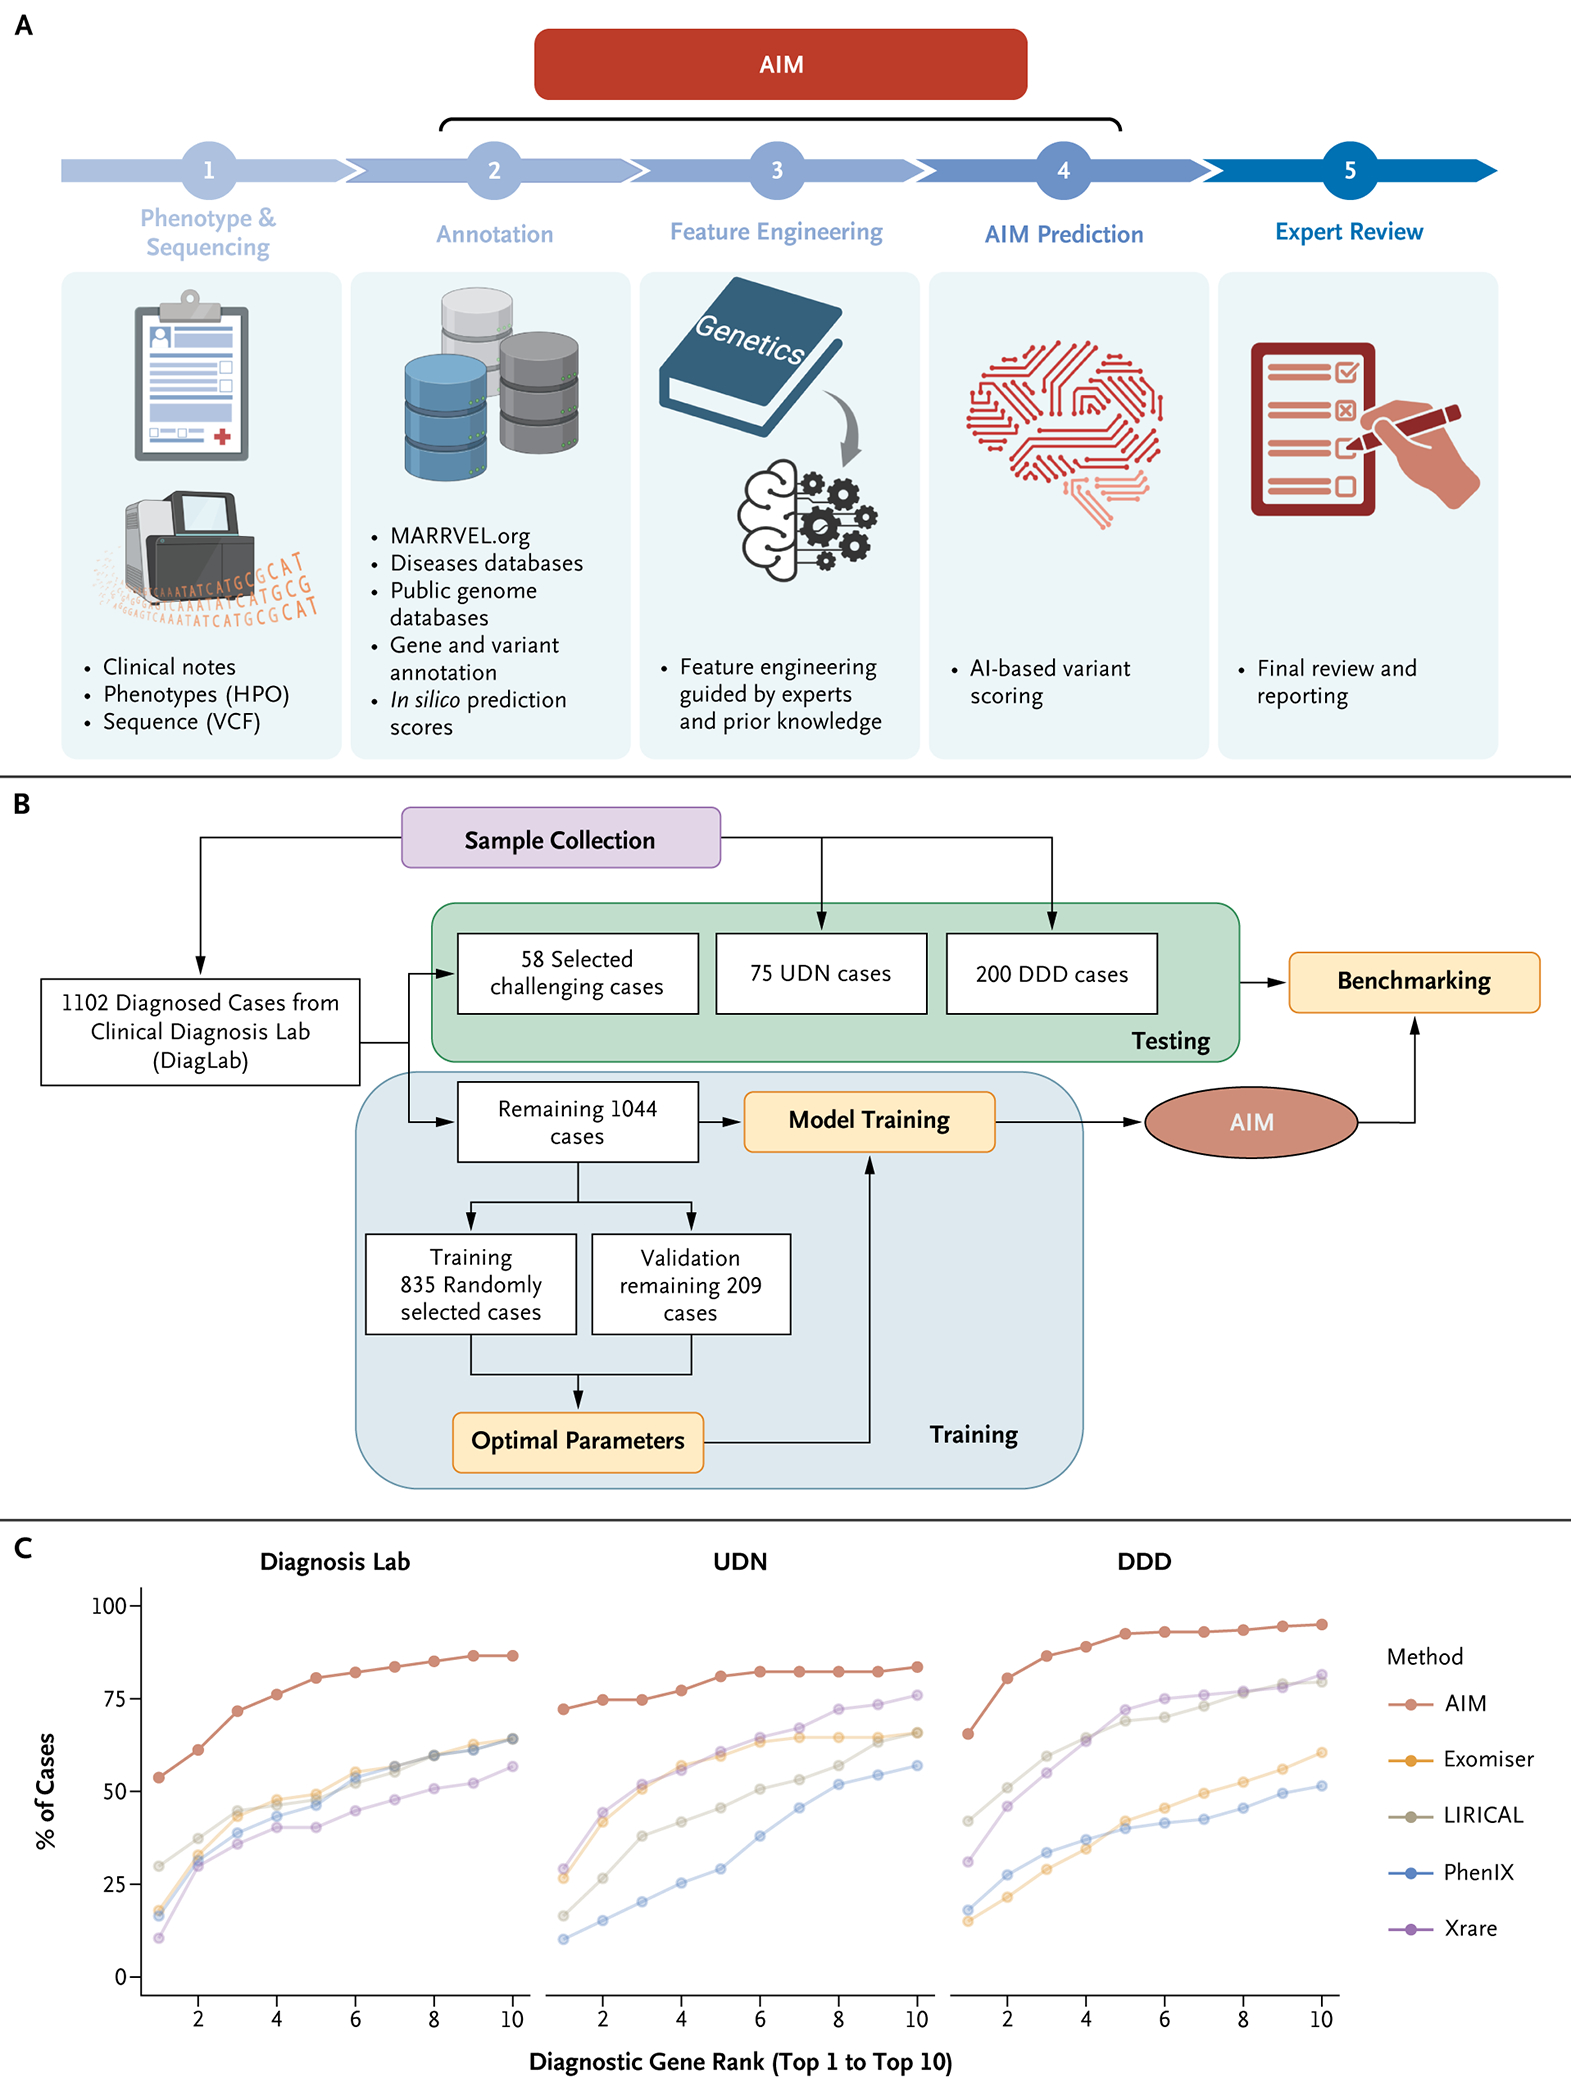
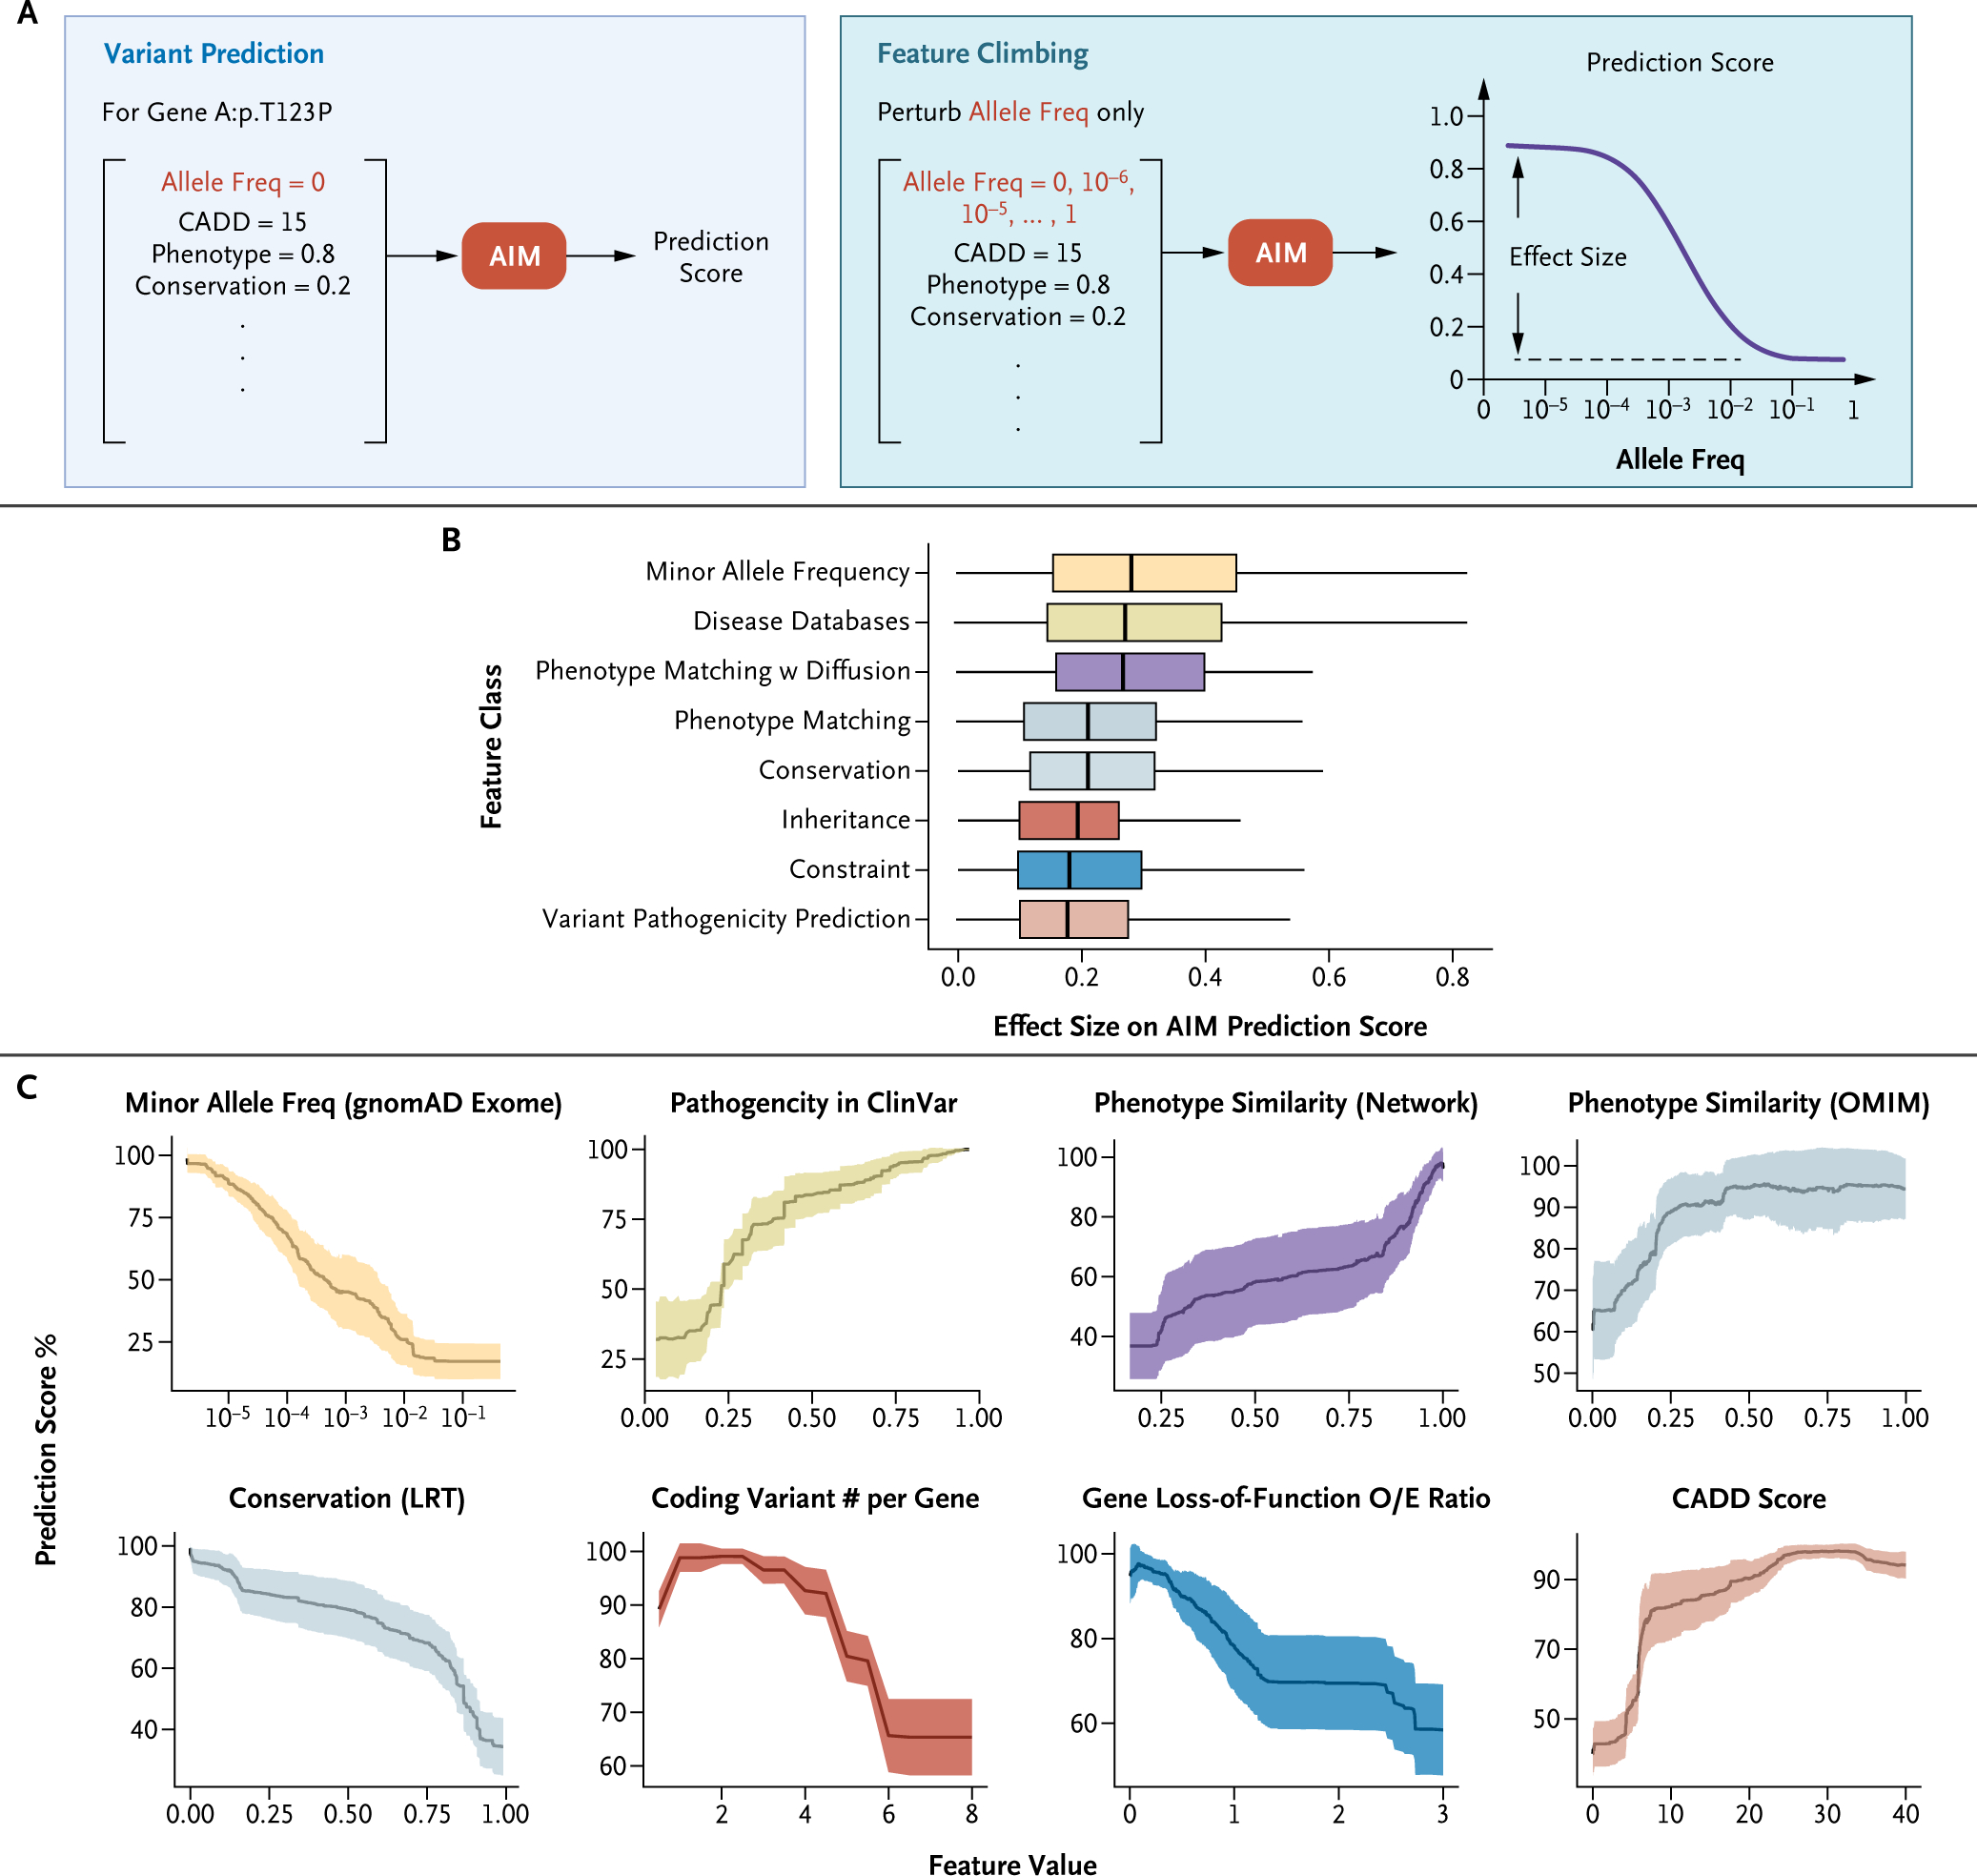
Methods: AI-MARRVEL (AIM) uses a random-forest machine-learning classifier trained on over 3.5 million variants from thousands of diagnosed cases. AIM additionally incorporates expert-engineered features into training to recapitulate the intricate decision-making processes in molecular diagnosis. The online version of AIM is available at https://ai.marrvel.org. To evaluate AIM, we benchmarked it with diagnosed patients from three independent cohorts.

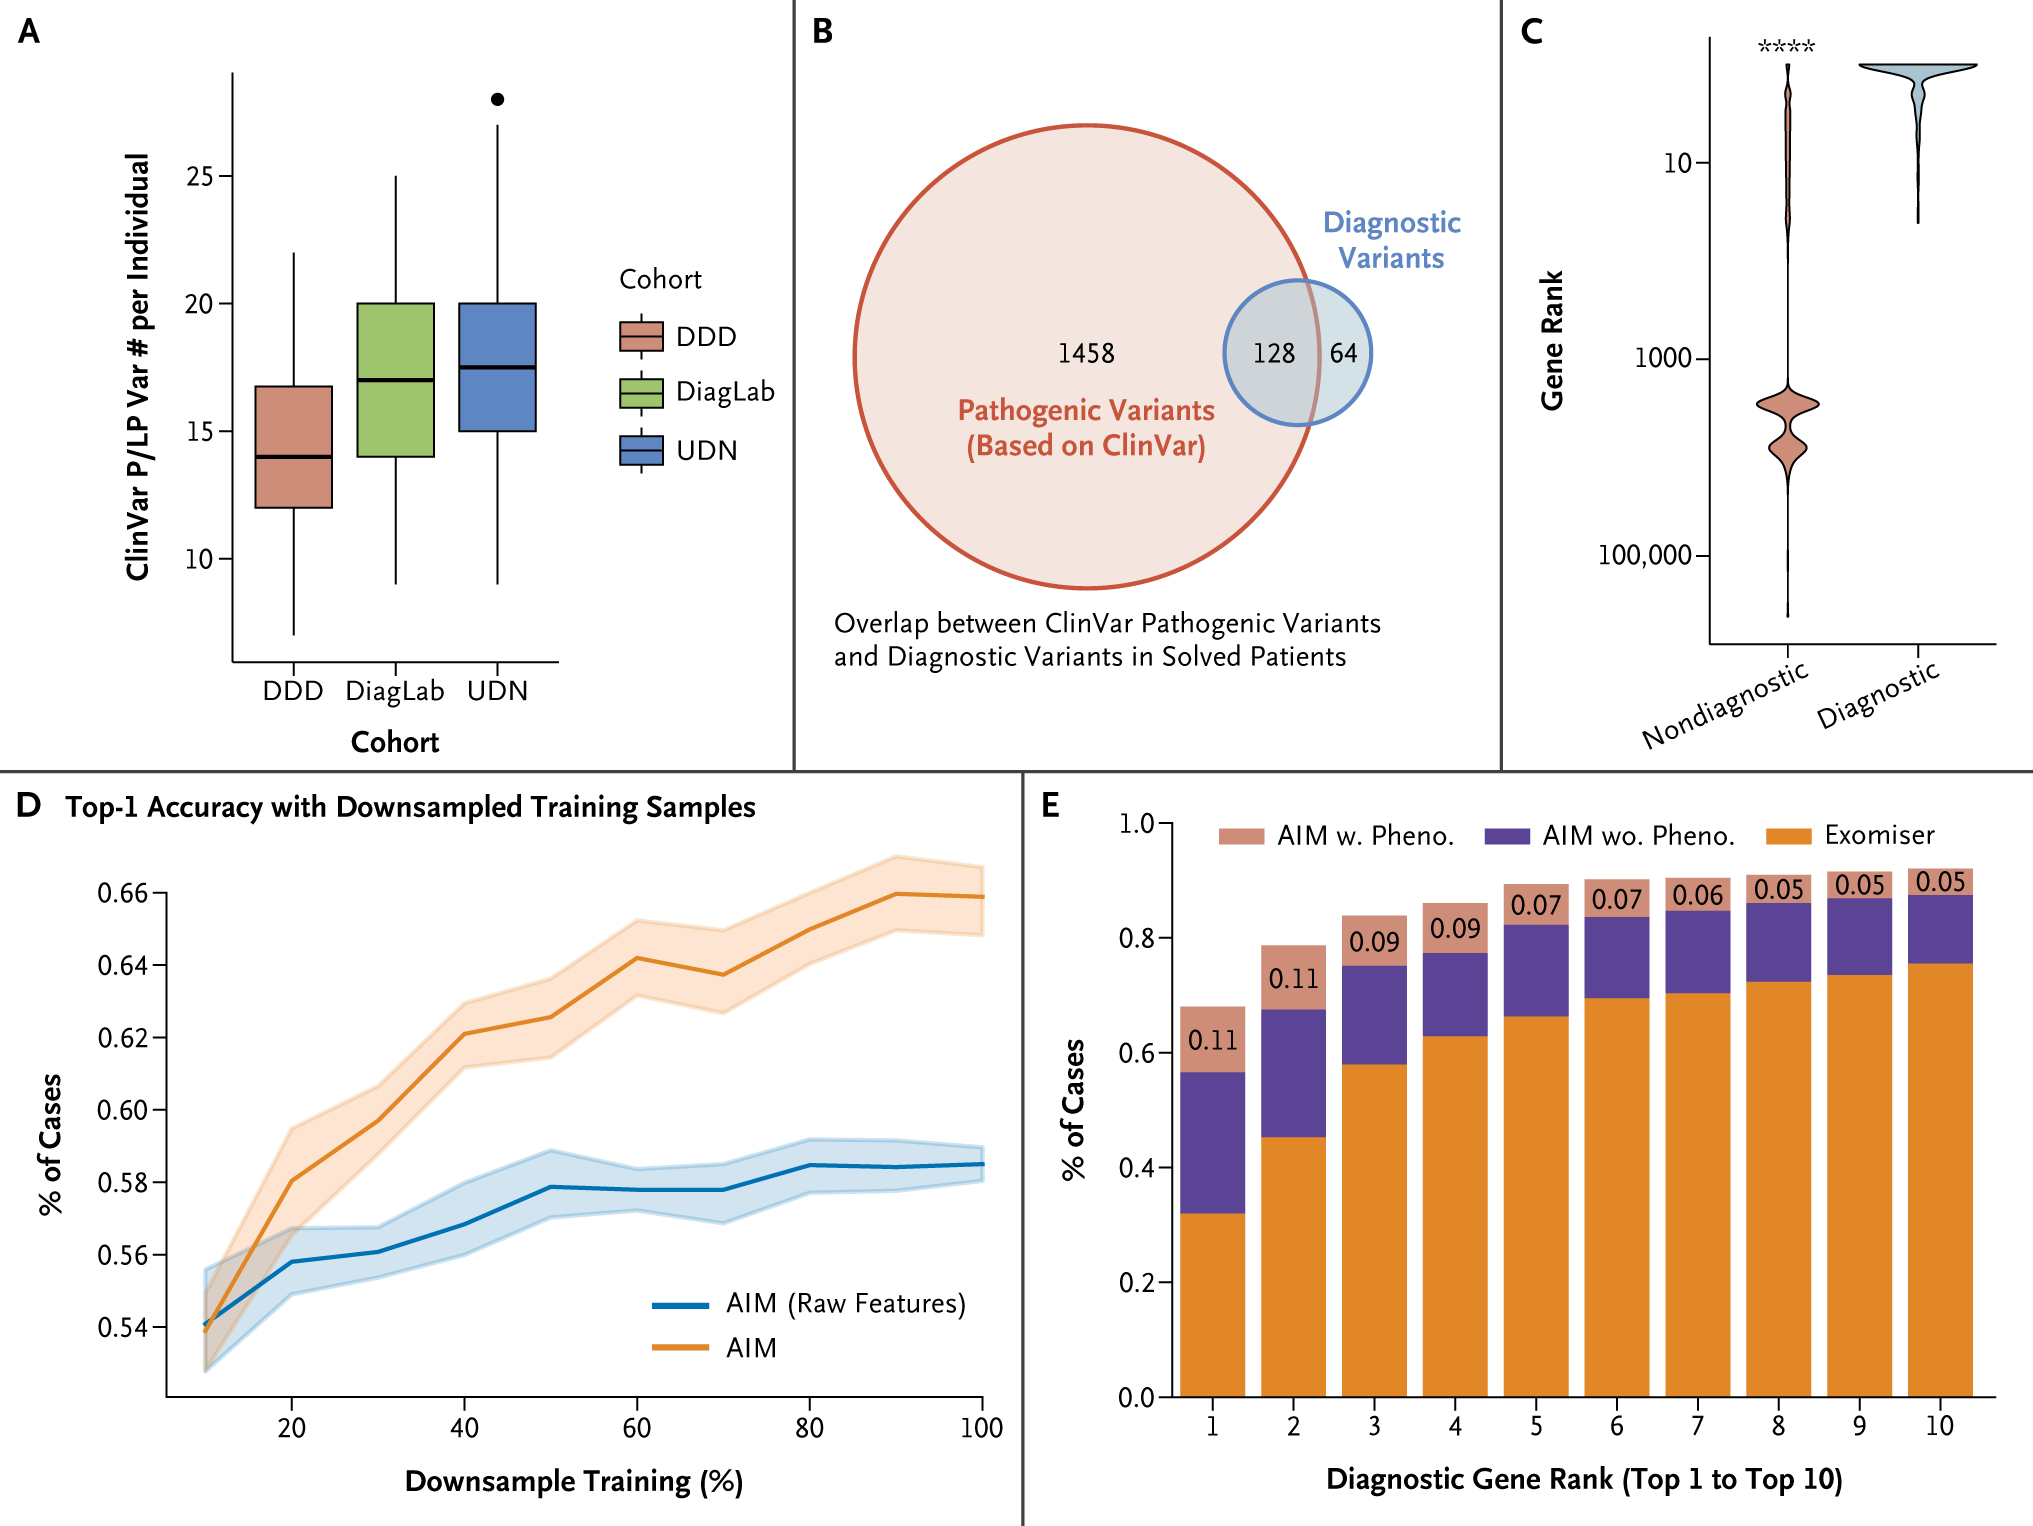
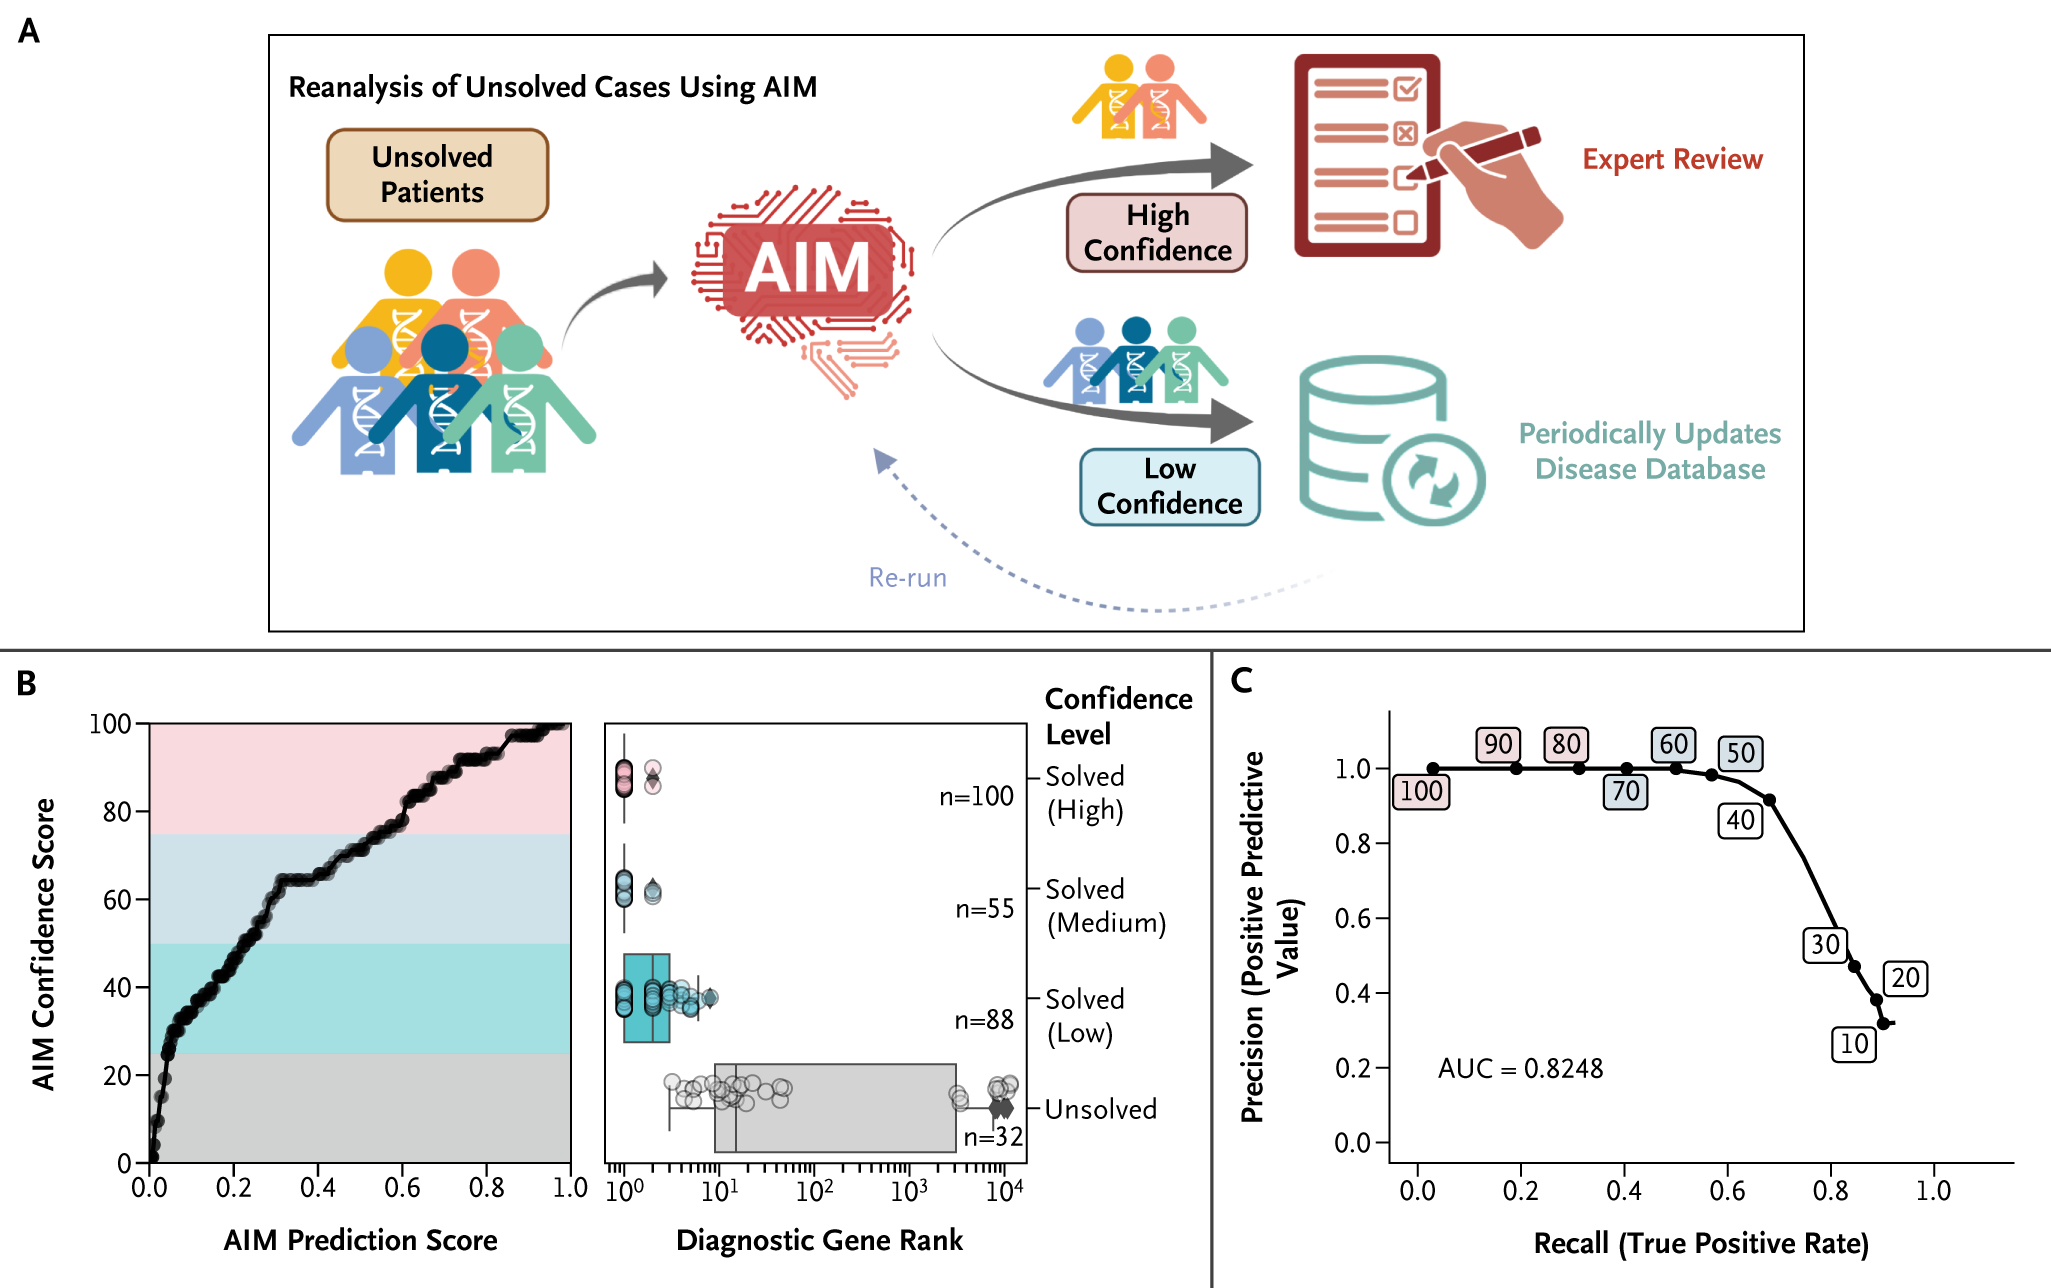
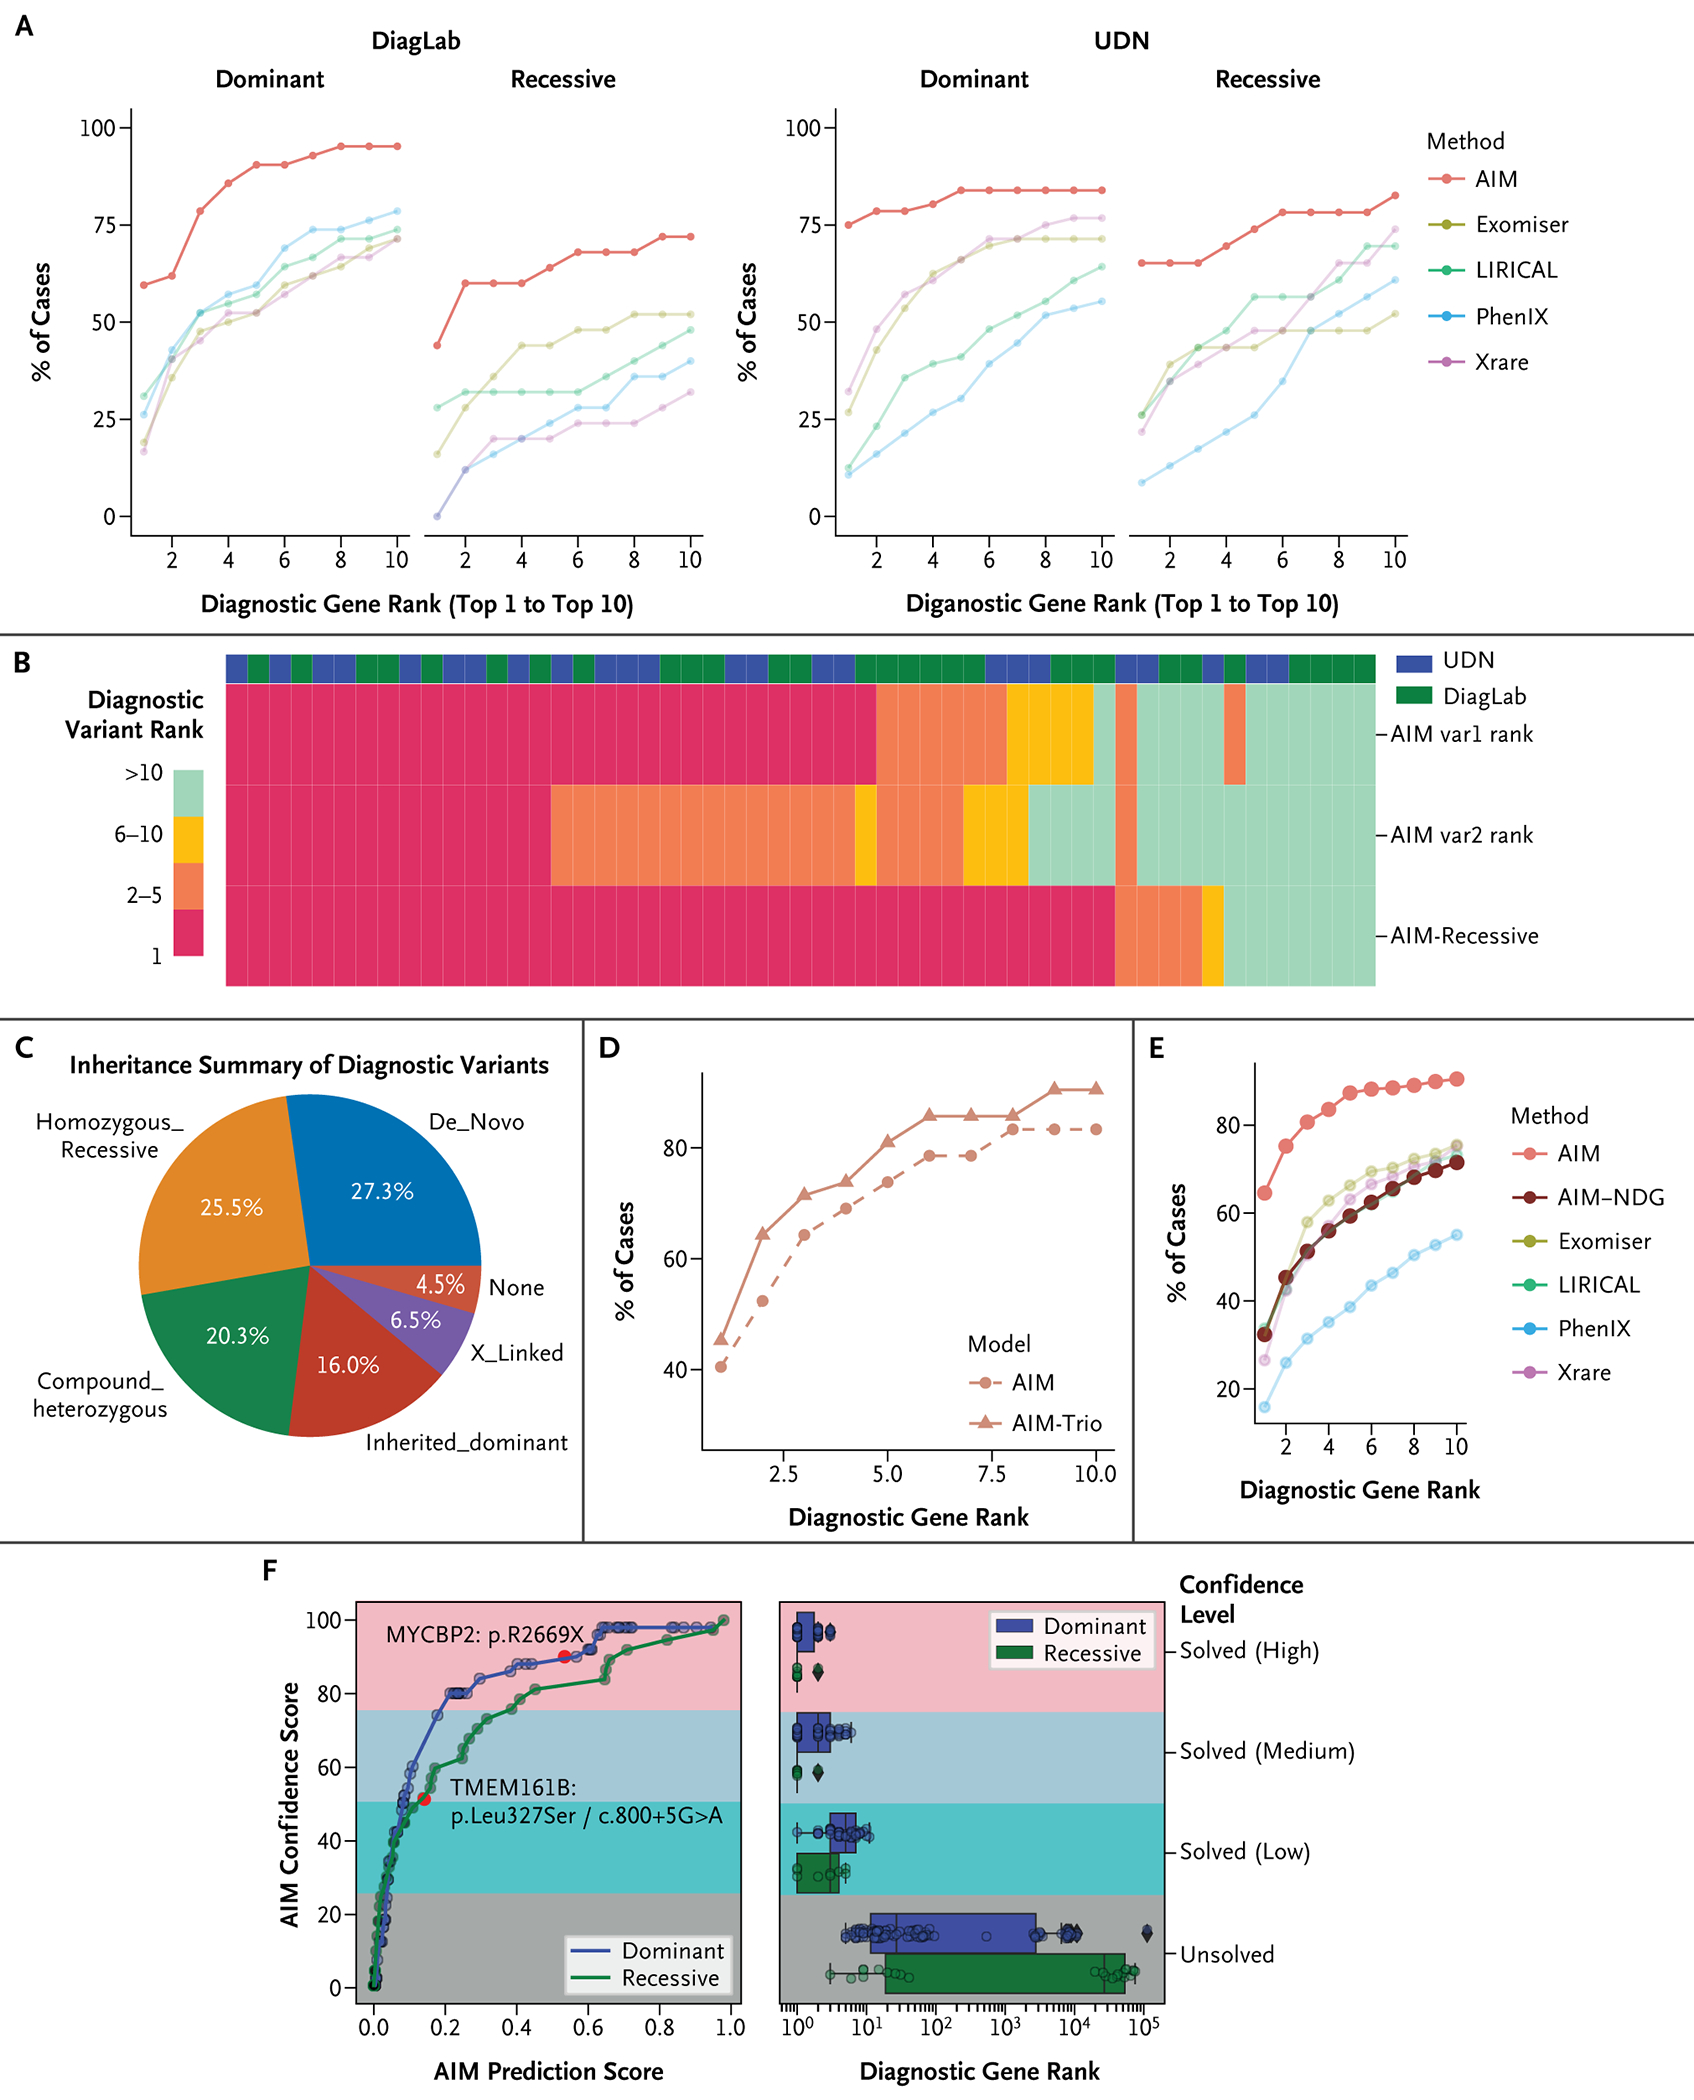
Results: AIM improved the rate of accurate genetic diagnosis, doubling the number of solved cases as compared with benchmarked methods, across three distinct real-world cohorts. To better identify diagnosable cases from the unsolved pools accumulated over time, we designed a confidence metric on which AIM achieved a precision rate of 98% and identified 57% of diagnosable cases out of a collection of 871 cases. Furthermore, AIM's performance improved after being fine-tuned for targeted settings including recessive disorders and trio analysis. Finally, AIM demonstrated potential for novel disease gene discovery by correctly predicting two newly reported disease genes from the Undiagnosed Diseases Network.

Conclusions: AIM achieved superior accuracy compared with existing methods for genetic diagnosis. We anticipate that this tool may aid in primary diagnosis, reanalysis of unsolved cases, and the discovery of novel disease genes. (Funded by the NIH Common Fund and others.).


Figures

Figure 1.
Figure 1.
AIM Outperforms State-of-the-Art Methods. (Panel A) The workflow of AI-MARRVEL (AIM). (Panel B) Summary of the sample collection; see the Supplementary Appendix for details. (Panel C) AIM outperforms four state-of-the-art methods, including Exomiser, LIRICAL, PhenIX, and Xrare in three independent datasets: Clinical Diagnosis Lab (DiagLab), Undiagnosed Diseases Network (UDN), and Deciphering Developmental Disorders project (DDD). The graph shows how the diagnostic genes rank within top-1 to top-10 positions among the four methods. AI denotes artificial intelligence; HPO, Human Phenotype Ontology; and VCF, variant call format.
Figure 2.
Figure 2.
Accurate AIM Diagnosis Requires High-Quality Labeling and Feature Engineering. (Panel A) Box plot showing the number of pathogenic or likely pathogenetic (P/LP) variants per individual based on ClinVar. There are around 15 P/LP variants per individual in the three testing datasets. (Panel B) Venn diagram showing the overlap between ClinVar pathogenic variants and diagnostic variants identified in solved patients from DiagLab and UDN. The red circle represents ClinVar (likely) pathogenic variants, and the blue circle represents diagnostic variants identified in patients. The diagram shows that only 8% of ClinVar (likely) pathogenic variants are disease-causing in patients, whereas one third of diagnostic variants are not annotated as pathogenic in ClinVar. (Panel C) Violin plot of the rankings of diagnostic and nondiagnostic ClinVar P/LP variants. AI-MARRVEL (AIM) separates these two groups. (Panel D) Line plot showing the percentage of cases in which AIM ranks the diagnostic variant as top-1 with down-sampling. The orange line represents AIM trained with both raw and engineered features, and the blue line represents AIM trained with raw features only. (Panel E) Comparing AIM’s performances between data using or ignoring phenotype information. DDD denotes Deciphering Developmental Disorders project; DiagLab, Clinical Diagnosis Lab; and UDN, Undiagnosed Diseases Network.
Figure 3.
Figure 3.
Enhancing Interpretability of AI Models in Clinical Genetic Diagnosis: Analyzing Feature Contributions through Feature Climbing to Demystify AIM’s Random-Forest Model. (Panel A) Schematic representation of the process of feature climbing. (Panel B) Box plot of features’ importance grouped by their types. All the features are grouped into different classes based on biological meaning (color-coded). Conservation: evolutionary conservation; Constraint: population genetic constraint metric; IMPACT: variant impact in gene function, Inheritance: mode of inheritance. (Panel C) Perturbation curves as line plots showing the percentage of prediction score after perturbing each feature. The x axis represents the feature values after perturbing and the y axis shows the percentage of prediction scores with the perturbed features. Line plots display the mean (black, solid lines) and standard deviation (colored, shaded lines) of the performances for diagnostic variants in two testing datasets: Diagnosis Lab and Undiagnosed Diseases Network. Representative features of each class are shown and colored accordingly. AI denotes artificial intelligence; AIM, AI-MARRVEL; CADD, Combined Annotation Dependent Depletion; Freq, frequency; LRT, likelihood ratio test; O/E, observed-to-expected; OMIM, Online Mendelian Inheritance in Man; and w, with.
Figure 4.
Figure 4.
Cross-Sample Confident Scoring for High-Throughput Reanalysis. (Panel A) Schematic diagram illustrating the reanalysis process. For undiagnosed patients, we employed AI-MARRVEL (AIM) to determine the likelihood of a diagnosis. Cases with a high level of confidence are referred for manual review by a trained clinical geneticist, and those with a low level of confidence are reanalyzed periodically after updates to the disease database. (Panel B, left) Line plot showing the relationship between confidence score vs. the AIM prediction score for diagnostic variants of UDN and DDD samples. (Panel B, right) Four levels of confidence are created based on the confidence score: high (75~100, n=108), medium (50~75, n=55), low (25~50, n=88), and unsolved (0~25, n=32). (Panel C) The precision and recall curve for reanalysis at different confident score thresholds (area under the curve [AUC] = 0.82).
Figure 5.
Figure 5.
AIM Model Extensions Tailored for Diverse Diagnostic Scenarios. (Panel A) Accuracy of AI-MARRVEL (AIM) and other methods based on different inheritance modes on two independent datasets. (Panel B) Comparing recessive-specific model (AIM-Recessive) and the default model (AIM) on all recessive cases from two datasets: Clinical Diagnosis Lab (DiagLab) and Undiagnosed Diseases Network (UDN). The Heatmap shows the ranking of the diagnostic variants using AIM (AIM var1 and var2) vs. AIM-Recessive model. (Panel C) Inheritance of all diagnostic variants in all trio samples from DiagLab. (Panel D) AIM-Trio model outperformed the singleton models. We trained and compared our trio model under the same settings as the previously mentioned default. With 31 test samples (42 variants), top-k accuracies (variant level) are shown on the plots. (Panel E) Benchmarking of AIM-NDG; the y axis presents the fraction of cases that different tools rank the diagnostic genes within top 1 to top 10. (Panel F) Similar to Figure 4B, the line plot shows the confidence score vs. AIM prediction score for the AIM-NDG model (blue line for cases with diagnostic gene of dominant inheritance and green line for recessive inheritance). We highlight two recently published novel disease genes in the plot (red dots): one dominant gene, MYCBP2 (red dot on blue line), and one recessive gene, TMEM161B (red dot on green line).

Similar articles

Cited by

References

    1. Ng SB, Buckingham KJ, Lee C, et al. Exome sequencing identifies the cause of a mendelian disorder. Nat Genet 2010;42:30–35. DOI: 10.1038/ng.499. - DOI - PMC - PubMed
    1. Church G Compelling reasons for repairing human germlines. N Engl J Med 2017;377:1909–1911. DOI: 10.1056/NEJMp1710370. - DOI - PubMed
    1. Posey JE, O’Donnell-Luria AH, Chong JX, et al. Insights into genetics, human biology and disease gleaned from family based genomic studies. Genet Med 2019;21:798–812. DOI: 10.1038/s41436-018-0408-7. - DOI - PMC - PubMed
    1. Yang Y, Muzny DM, Reid JG, et al. Clinical whole-exome sequencing for the diagnosis of mendelian disorders. N Engl J Med 2013; 369:1502–1511. DOI: 10.1056/NEJMoa1306555. - DOI - PMC - PubMed
    1. Posey JE, Rosenfeld JA, James RA, et al. Molecular diagnostic experience of whole-exome sequencing in adult patients. Genet Med 2016;18:678–685. DOI: 10.1038/gim.2015.142. - DOI - PMC - PubMed

LinkOut - more resources