

Transcriptome analysis reveals the molecular mechanism of differences in growth between photoautotrophy and heterotrophy in Chlamydomonas reinhardtii
- PMID: 38962244
- PMCID: PMC11219824
- DOI: 10.3389/fpls.2024.1407915
Transcriptome analysis reveals the molecular mechanism of differences in growth between photoautotrophy and heterotrophy in Chlamydomonas reinhardtii
Abstract
Background: The green alga Chlamydomonas reinhardtii can grow photoautotrophically utilizing light and CO2, and heterotrophically utilizing acetate. The physiological and biochemical responses of autotrophy and heterotrophy are different in C. reinhardtii. However, there is no complete understanding of the molecular physiology between autotrophy and heterotrophy. Therefore, we performed biochemical, molecular and transcriptome analysis of C. reinhardtii between autotrophy and heterotrophy.
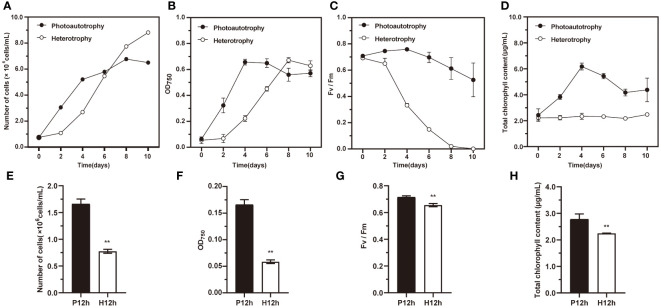
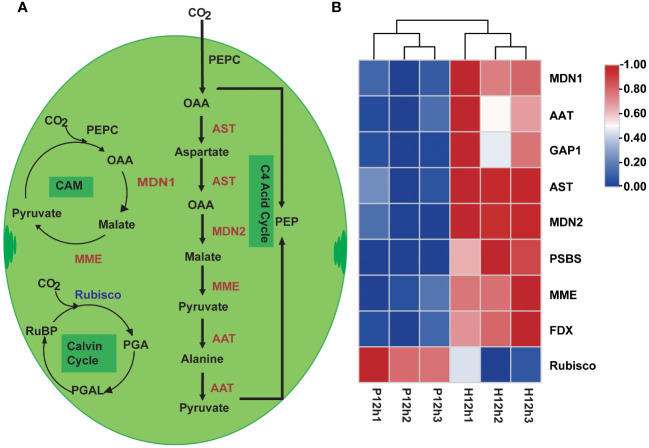
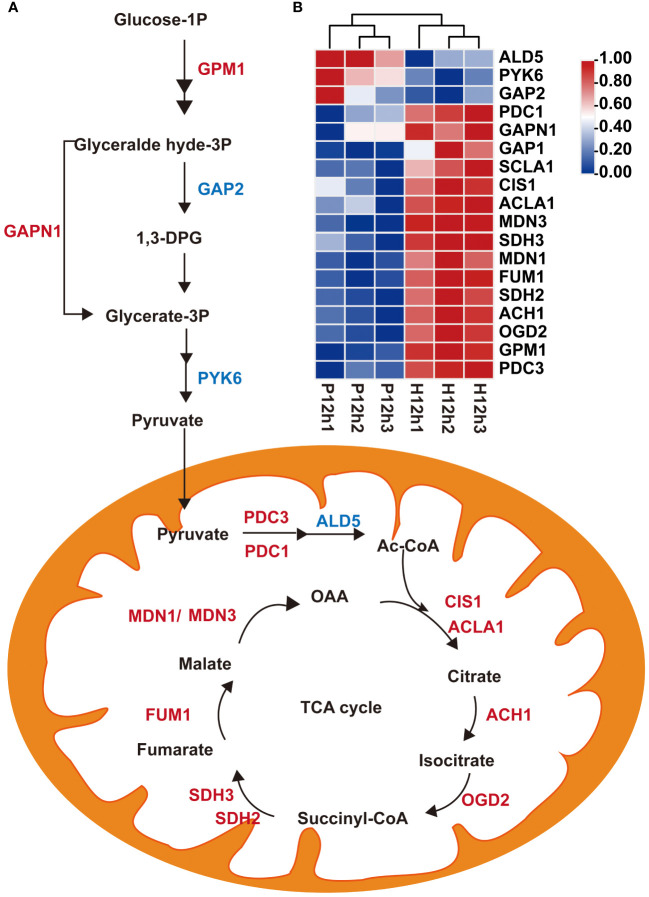
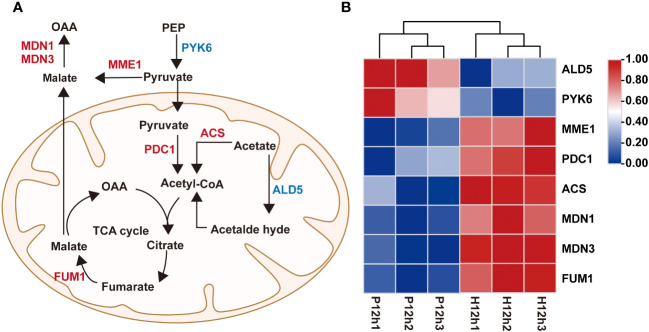
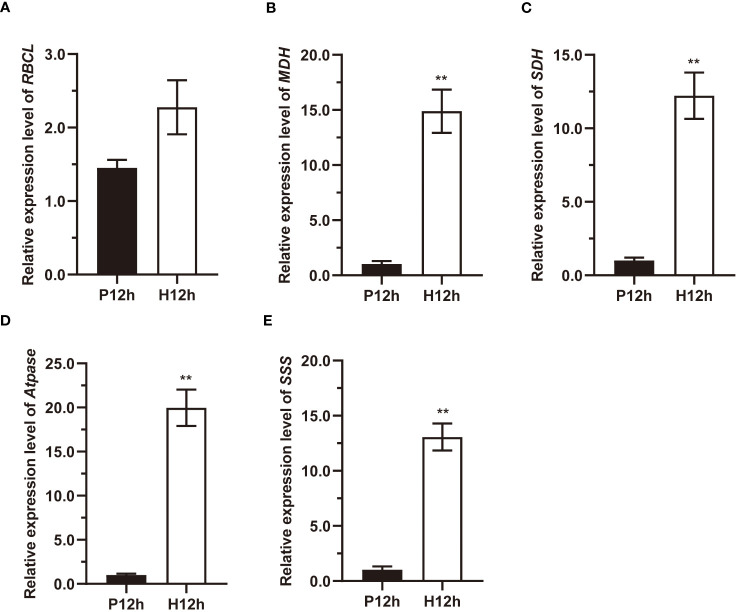
Results: The cell growth characterization demonstrated that heterotrophic cell had enhanced growth rates, and autotrophic cell accumulated more chlorophyll. The transcriptome data showed that a total of 2,970 differentially expressed genes (DEGs) were identified from photoautotrophy 12h (P12h) to heterotrophy 12h (H12h). The DEGs were involved in photosynthesis, the tricarboxylic acid cycle (TCA), pyruvate and oxidative phosphorylation metabolisms. Moreover, the results of qRT-PCR revealed that the relative expression levels of malate dehydrogenase (MDH), succinate dehydrogenase (SDH), ATP synthase (ATPase), and starch synthase (SSS) were increased significantly from P12h and H12h. The protein activity of NAD-malate dehydrogenase (NAD-MDH) and succinate dehydrogenase (SDH) were significantly higher in the H12h group.
Conclusion: The above results indicated that the high growth rate observed in heterotrophic cell may be the effects of environmental or genetic regulation of photosynthesis. Therefore, the identification of novel candidate genes in heterotrophy will contribute to the development of microalga strains with higher growth capacity and better performance for biomass production.
Keywords: C. reinhardtii; heterotrophy; metabolic pathways; photoautotrophy; transcriptome.
Copyright © 2024 Chen, Chen, He, Liang, Hong, Li and Du.
Conflict of interest statement
The authors declare that the research was conducted in the absence of any commercial or financial relationships that could be construed as a potential conflict of interest. The reviewer HC declared a past co-authorship with the author HD to the handling editor.
Figures


Similar articles
-
Acetate and bicarbonate assimilation and metabolite formation in Chlamydomonas reinhardtii: a 13C-NMR study.PLoS One. 2014 Sep 10;9(9):e106457. doi: 10.1371/journal.pone.0106457. eCollection 2014. PLoS One. 2014. PMID: 25207648 Free PMC article.
-
Heterotrophy Compared to Photoautotrophy for Growth Characteristics and Pigment Compositions in Batch Cultures of Four Green Microalgae.Plants (Basel). 2024 Apr 24;13(9):1182. doi: 10.3390/plants13091182. Plants (Basel). 2024. PMID: 38732397 Free PMC article.
-
Quantitative proteomic comparison of salt stress in Chlamydomonas reinhardtii and the snow alga Chlamydomonas nivalis reveals mechanisms for salt-triggered fatty acid accumulation via reallocation of carbon resources.Biotechnol Biofuels. 2021 May 22;14(1):121. doi: 10.1186/s13068-021-01970-6. Biotechnol Biofuels. 2021. PMID: 34022944 Free PMC article.
-
Hypothesis on the Synchronistic Evolution of Autotrophy and Heterotrophy.Trends Biochem Sci. 2018 Jun;43(6):402-411. doi: 10.1016/j.tibs.2018.03.008. Epub 2018 Apr 11. Trends Biochem Sci. 2018. PMID: 29655512 Review.
-
Trends on Chlamydomonas reinhardtii growth regimes and bioproducts.Biotechnol Appl Biochem. 2023 Dec;70(6):1830-1842. doi: 10.1002/bab.2486. Epub 2023 Jun 19. Biotechnol Appl Biochem. 2023. PMID: 37337370 Review.
References
-
- Anderson O. R. (2022. a). Recent advances in application of transcriptomics: research on heterotrophic and autotrophic protists. Acta Protozoologica 61, 47–75. doi: 10.4467/16890027AP - DOI
-
- Anderson O. R. (2022. b). Recent advances in application of transcriptomics: research on heterotrophic and autotrophic protists. Acta Protozoologica 61, 47–75. doi: 10.4467/16890027AP - DOI
LinkOut - more resources
Full Text Sources