. 2024 Jul 2;6(3):lqae076.
doi: 10.1093/nargab/lqae076. eCollection 2024 Sep.

ENT3C: an entropy-based similarity measure for Hi-C and micro-C derived contact matrices

Affiliations

ENT3C: an entropy-based similarity measure for Hi-C and micro-C derived contact matrices

Xenia Lainscsek et al. NAR Genom Bioinform. .

Abstract

Hi-C and micro-C sequencing have shed light on the profound importance of 3D genome organization in cellular function by probing 3D contact frequencies across the linear genome. The resulting contact matrices are extremely sparse and susceptible to technical- and sequence-based biases, making their comparison challenging. The development of reliable, robust and efficient methods for quantifying similarity between contact matrices is crucial for investigating variations in the 3D genome organization in different cell types or under different conditions, as well as evaluating experimental reproducibility. We present a novel method, ENT3C, which measures the change in pattern complexity in the vicinity of contact matrix diagonals to quantify their similarity. ENT3C provides a robust, user-friendly Hi-C or micro-C contact matrix similarity metric and a characteristic entropy signal that can be used to gain detailed biological insights into 3D genome organization.


Figures

Figure 1.
Figure 1.
ENT3C computes cell-line specific entropy signals S from the diagonal of a contact matrix and identifies low and high complexity regions. (A) Depiction of ENT3C derivation of the entropy signal S of a contact matrix A. The analysis is exemplified for the contact matrix of the HFFc6 cell line (BR 1) for chromosome 14 binned at 40 kb (Methods). ENT3C’s was run with submatrix dimension n = 300, window shift φ = 10, and maximum number of data points in S Φmax  = ∞, resulting in Φ = 146 submatrices along the diagonal of the contact matrix. For subsequent scaled Pearson-transformed submatrices, formula image, along the diagonal of log A, ENT3C computes the von Neumann entropies formula image. The resulting signal formula image is shown in blue under the matrix. The first two (formula image), middle (formula image), and last two submatrices (formula image) are shown. (B) Principal Component Analysis (PCA) plot of S of contact matrices of five cell lines for chromosome 14. Cell lines cluster strongly along PC1 (98% variance explained). The most outlying sample is biological replicate 2 of HFFc6. (C) ENT3C entropy signals S of pooled BR contact matrices A of five cell lines for chromosome 14 was computed using the same parameters as in (A). Minimum (1) and maximum (2) S values overlap in some cases. (D) Submatrices corresponding to minimum and maximum entropy values in (C) correspond to differences in pattern complexity.
Figure 2.
Figure 2.
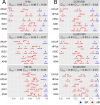
ENT3C is insensitive to binning resolution and sequencing depth. For each cell line i indicated on the y-axis, a blue dot represents the average ENT3C similarity score across all chromosomes and biological replicate pairs (formula image; Methods) and a red dot represents the average ENT3C similarity score with cell line j (indicated on the label) computed across all chromosomes and replicate pairs (formula image; Methods) for (A) intact contact matrices binned at 10, 50 and 100 kb resolutions, and (B) 40 kb contact matrices generated from pairs files downsampled to 5, 10 and 30 million interactions. Panel labels show the averages values across all cell lines or pairs of cell lines (formula image), and the average separating margins (formula image). ENT3C was run with parameters c = 7, φ = 1, and Φmax  = 1000.
Figure 3.
Figure 3.
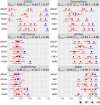
ENT3C competes well with other methods quantifying Hi-C or micro-C contact matrix similarity. Each panel represents a Method (ENT3C, GenomeDISCO, HiC-Spector, HiCRep, QuASAR and Selfish) and each dot represents the average similarity scores formula image and formula image as in Figure 2 (Methods). 40 kb binned contact matrices derived from downsampled pairs files (30 million interactions) were used to ensure comparability. Panel labels show the averages values across all cell lines or pairs of cell lines (formula image), and the average separating margins (formula image). ENT3C was run with parameters c = 7, φ = 1 and Φmax  = 1000.

References

    1. Dekker J., Rippe K., Dekker M., Kleckner N. Capturing chromosome conformation. Science. 2002; 295:1306–1311. - PubMed
    1. Lieberman-Aiden E., van Berkum N.L., Williams L., Imakaev M., Ragoczy T., Telling A., Amit I., Lajoie B.R., Sabo P.J., Dorschner M.O. et al. . Comprehensive mapping of long-range interactions reveals folding principles of the human genome. Science. 2009; 326:289–293. - PMC - PubMed
    1. Krietenstein N., Abraham S., Venev S.V., Abdennur N., Gibcus J., Hsieh T.-H.S., Parsi K.M., Yang L., Maehr R., Mirny L.A. et al. . Ultrastructural details of mammalian chromosome architecture. Mol. Cell. 2020; 78:554–565. - PMC - PubMed
    1. Akgol Oksuz B., Yang L., Abraham S., Venev S.V., Krietenstein N., Parsi K.M., Ozadam H., Oomen M.E., Nand A., Mao H. et al. . Systematic evaluation of chromosome conformation capture assays. Nat. Methods. 2021; 18:1046–1055. - PMC - PubMed
    1. Wang Z., Cao R., Taylor K., Briley A., Caldwell C., Cheng J. The properties of genome conformation and spatial gene interaction and regulation networks of normal and malignant human cell types. PLoS One. 2013; 8:e58793. - PMC - PubMed

LinkOut - more resources