

Improving skin cancer detection by Raman spectroscopy using convolutional neural networks and data augmentation
- PMID: 38962264
- PMCID: PMC11219827
- DOI: 10.3389/fonc.2024.1320220
Improving skin cancer detection by Raman spectroscopy using convolutional neural networks and data augmentation
Abstract
Background: Our previous studies have demonstrated that Raman spectroscopy could be used for skin cancer detection with good sensitivity and specificity. The objective of this study is to determine if skin cancer detection can be further improved by combining deep neural networks and Raman spectroscopy.
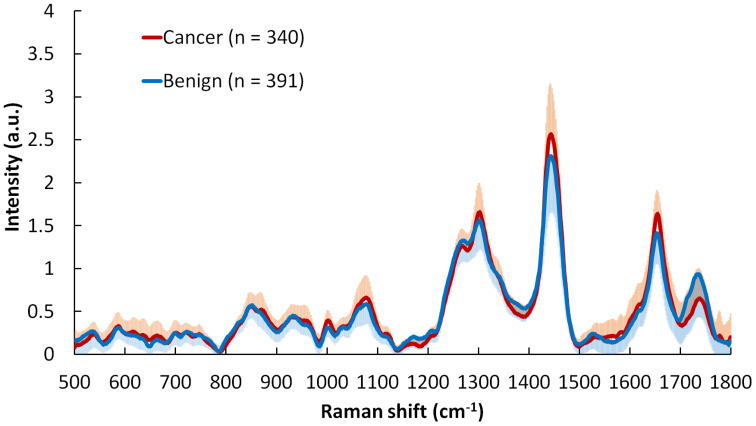
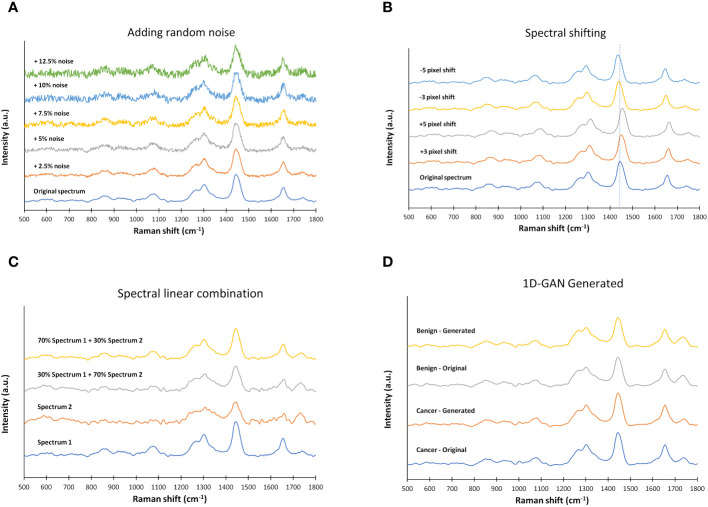
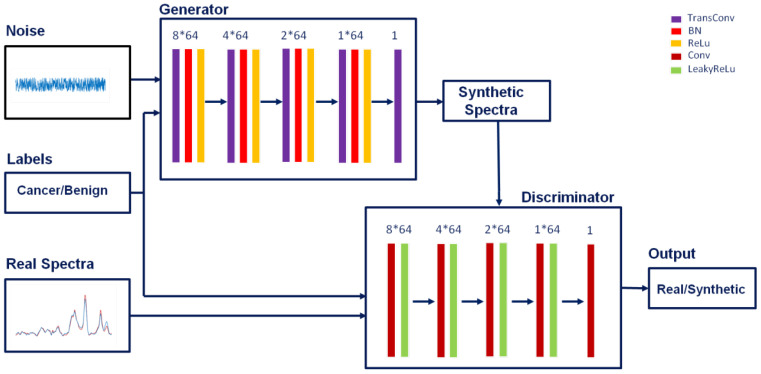
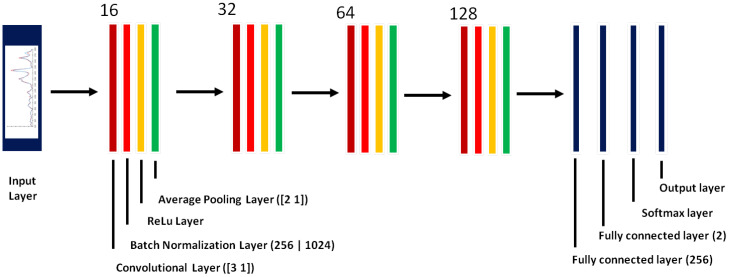
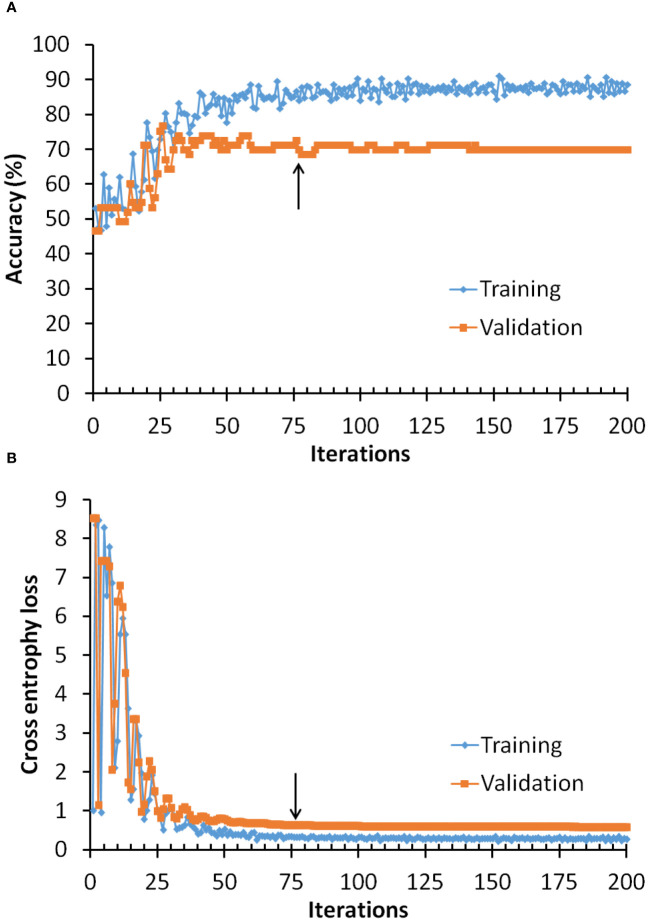
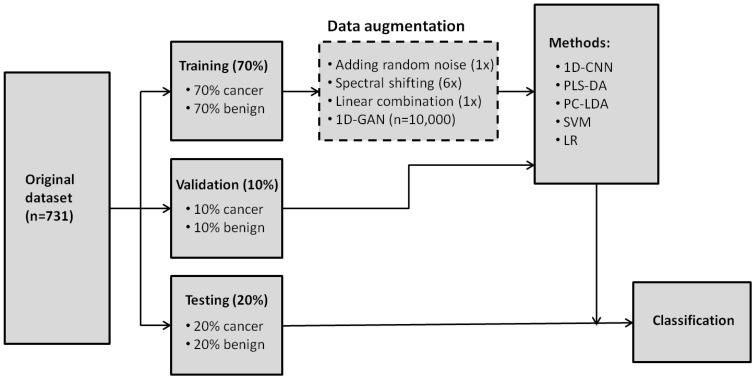
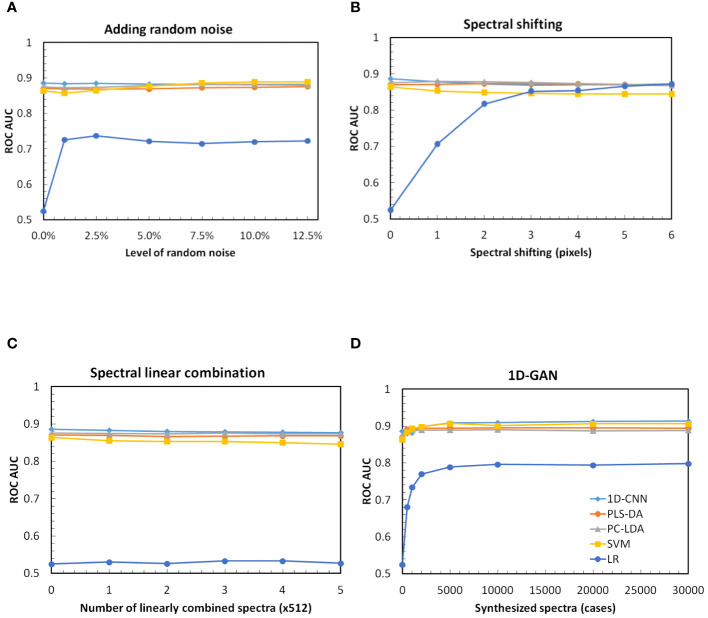
Patients and methods: Raman spectra of 731 skin lesions were included in this study, containing 340 cancerous and precancerous lesions (melanoma, basal cell carcinoma, squamous cell carcinoma and actinic keratosis) and 391 benign lesions (melanocytic nevus and seborrheic keratosis). One-dimensional convolutional neural networks (1D-CNN) were developed for Raman spectral classification. The stratified samples were divided randomly into training (70%), validation (10%) and test set (20%), and were repeated 56 times using parallel computing. Different data augmentation strategies were implemented for the training dataset, including added random noise, spectral shift, spectral combination and artificially synthesized Raman spectra using one-dimensional generative adversarial networks (1D-GAN). The area under the receiver operating characteristic curve (ROC AUC) was used as a measure of the diagnostic performance. Conventional machine learning approaches, including partial least squares for discriminant analysis (PLS-DA), principal component and linear discriminant analysis (PC-LDA), support vector machine (SVM), and logistic regression (LR) were evaluated for comparison with the same data splitting scheme as the 1D-CNN.
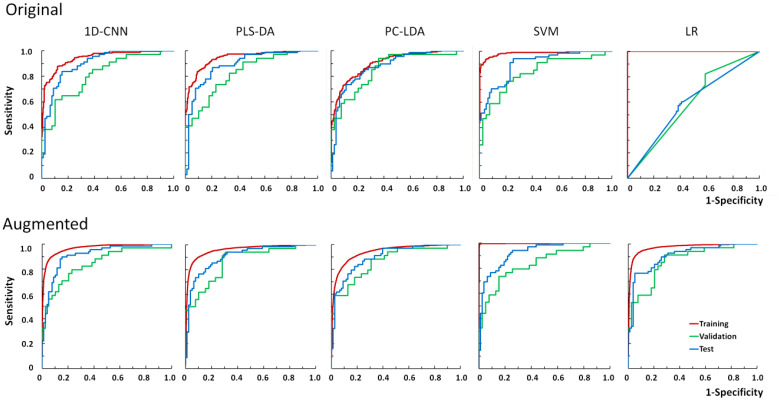
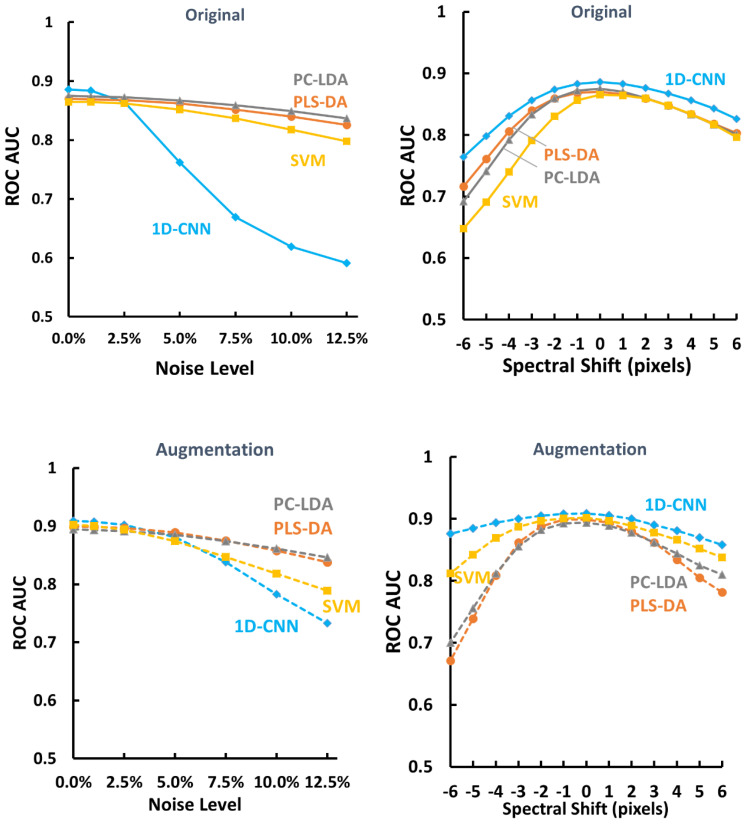
Results: The ROC AUC of the test dataset based on the original training spectra were 0.886±0.022 (1D-CNN), 0.870±0.028 (PLS-DA), 0.875±0.033 (PC-LDA), 0.864±0.027 (SVM), and 0.525±0.045 (LR), which were improved to 0.909±0.021 (1D-CNN), 0.899±0.022 (PLS-DA), 0.895±0.022 (PC-LDA), 0.901±0.020 (SVM), and 0.897±0.021 (LR) respectively after augmentation of the training dataset (p<0.0001, Wilcoxon test). Paired analyses of 1D-CNN with conventional machine learning approaches showed that 1D-CNN had a 1-3% improvement (p<0.001, Wilcoxon test).
Conclusions: Data augmentation not only improved the performance of both deep neural networks and conventional machine learning techniques by 2-4%, but also improved the performance of the models on spectra with higher noise or spectral shifting. Convolutional neural networks slightly outperformed conventional machine learning approaches for skin cancer detection by Raman spectroscopy.
Keywords: Raman spectroscopy; Skin cancer detection; artificial intelligence (AI); convolutional neural networks (CNN); data augmentation; machine learning; optical diagnosis.
Copyright © 2024 Zhao, Lui, Kalia, Lee and Zeng.
Conflict of interest statement
The authors and the BC Cancer Agency hold several patents for Raman spectroscopy that have been licensed to Vita Imaging Inc San Jose, California.
Figures

Similar articles
-
Serum analysis based on SERS combined with 2D convolutional neural network and Gramian angular field for breast cancer screening.Spectrochim Acta A Mol Biomol Spectrosc. 2024 May 5;312:124054. doi: 10.1016/j.saa.2024.124054. Epub 2024 Feb 19. Spectrochim Acta A Mol Biomol Spectrosc. 2024. PMID: 38382221
-
Classification of skin cancer using convolutional neural networks analysis of Raman spectra.Comput Methods Programs Biomed. 2022 Jun;219:106755. doi: 10.1016/j.cmpb.2022.106755. Epub 2022 Mar 21. Comput Methods Programs Biomed. 2022. PMID: 35349907
-
Comparative study of machine-and deep-learning based classification algorithms for biomedical Raman spectroscopy (RS): case study of RS based pathogenic microbe identification.Anal Sci. 2024 Dec;40(12):2101-2109. doi: 10.1007/s44211-024-00645-0. Epub 2024 Aug 29. Anal Sci. 2024. PMID: 39207655
-
Artificial intelligence in clinical care amidst COVID-19 pandemic: A systematic review.Comput Struct Biotechnol J. 2021;19:2833-2850. doi: 10.1016/j.csbj.2021.05.010. Epub 2021 May 7. Comput Struct Biotechnol J. 2021. PMID: 34025952 Free PMC article. Review.
-
Cancer Diagnosis Using Deep Learning: A Bibliographic Review.Cancers (Basel). 2019 Aug 23;11(9):1235. doi: 10.3390/cancers11091235. Cancers (Basel). 2019. PMID: 31450799 Free PMC article. Review.
Cited by
-
AI-assisted identification of nonmelanoma skin cancer structures based on combined line-field confocal optical coherence tomography and confocal Raman microspectroscopy.J Biomed Opt. 2025 Jul;30(7):076008. doi: 10.1117/1.JBO.30.7.076008. Epub 2025 Jul 28. J Biomed Opt. 2025. PMID: 40726594 Free PMC article.
-
Emerging Technologies for Timely Point-of-Care Diagnostics of Skin Cancer.Glob Chall. 2025 Mar 18;9(5):2400274. doi: 10.1002/gch2.202400274. eCollection 2025 May. Glob Chall. 2025. PMID: 40352638 Free PMC article. Review.
-
A Static Sign Language Recognition Method Enhanced with Self-Attention Mechanisms.Sensors (Basel). 2024 Oct 29;24(21):6921. doi: 10.3390/s24216921. Sensors (Basel). 2024. PMID: 39517818 Free PMC article.
-
Machine learning models to predict osteoporosis in patients with chronic kidney disease stage 3-5 and end-stage kidney disease.Sci Rep. 2025 Apr 3;15(1):11391. doi: 10.1038/s41598-025-95928-5. Sci Rep. 2025. PMID: 40181057 Free PMC article.
References
-
- Cancer facts & Figures 2023. Available at: www.cancer.org (Accessed September 13, 2023).
LinkOut - more resources
Full Text Sources