. 2024 Jun 19:15:1355269.
doi: 10.3389/fphar.2024.1355269. eCollection 2024.

Dissecting gastric cancer heterogeneity and exploring therapeutic strategies using bulk and single-cell transcriptomic analysis and experimental validation of tumor microenvironment and metabolic interplay

Affiliations

Dissecting gastric cancer heterogeneity and exploring therapeutic strategies using bulk and single-cell transcriptomic analysis and experimental validation of tumor microenvironment and metabolic interplay

XianTao Lin et al. Front Pharmacol. .

Abstract

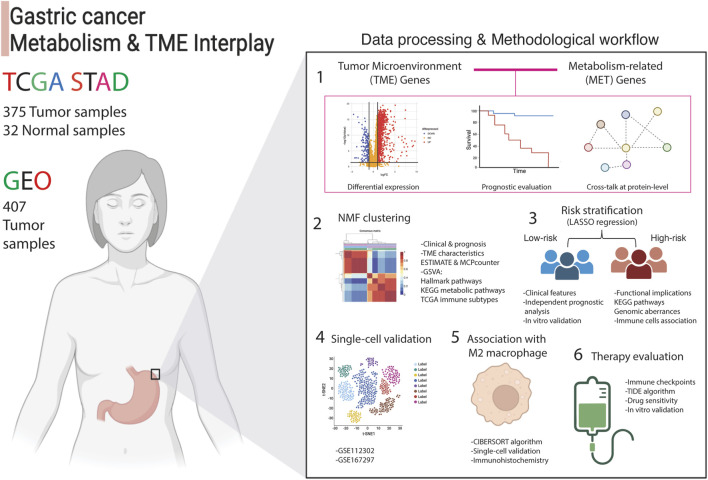
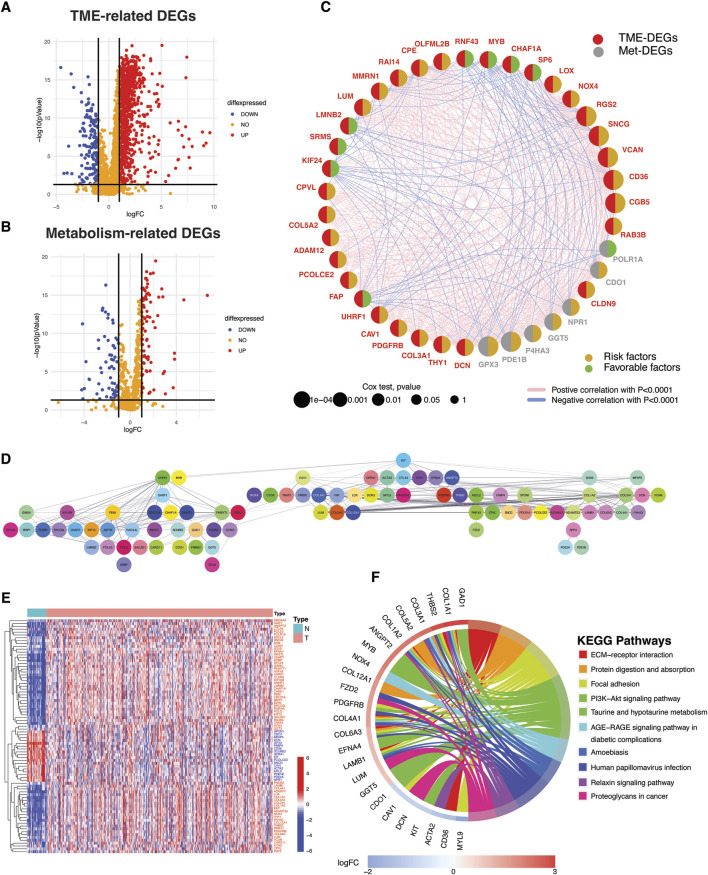
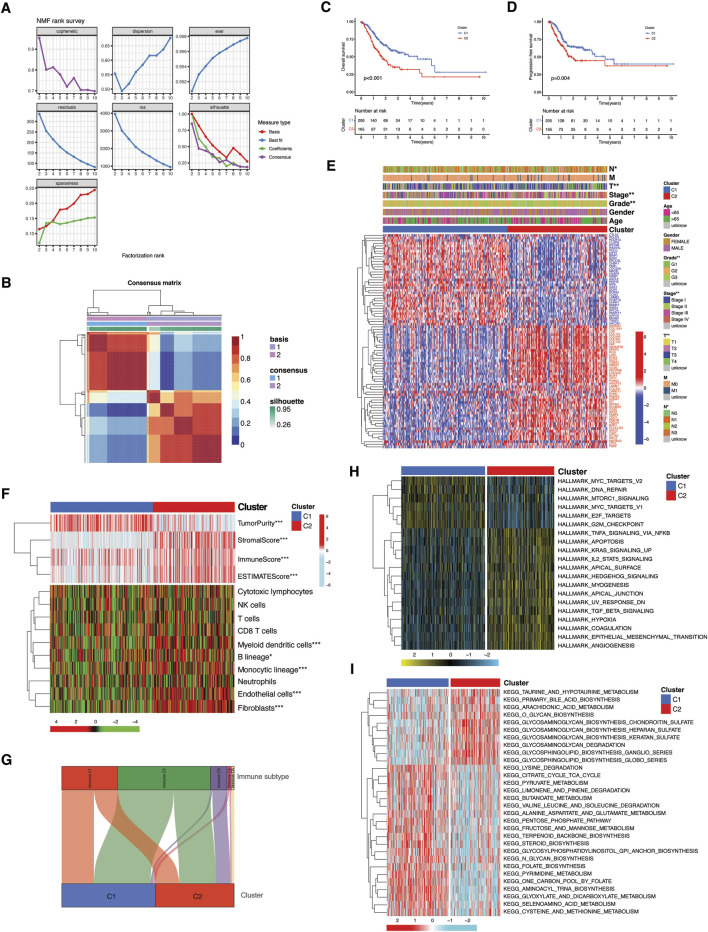
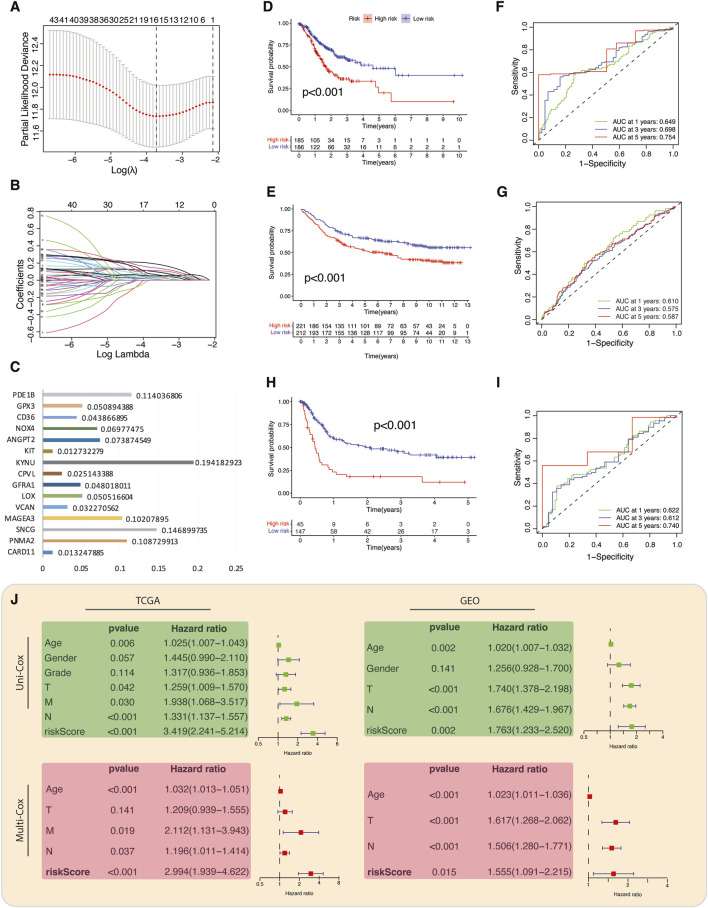
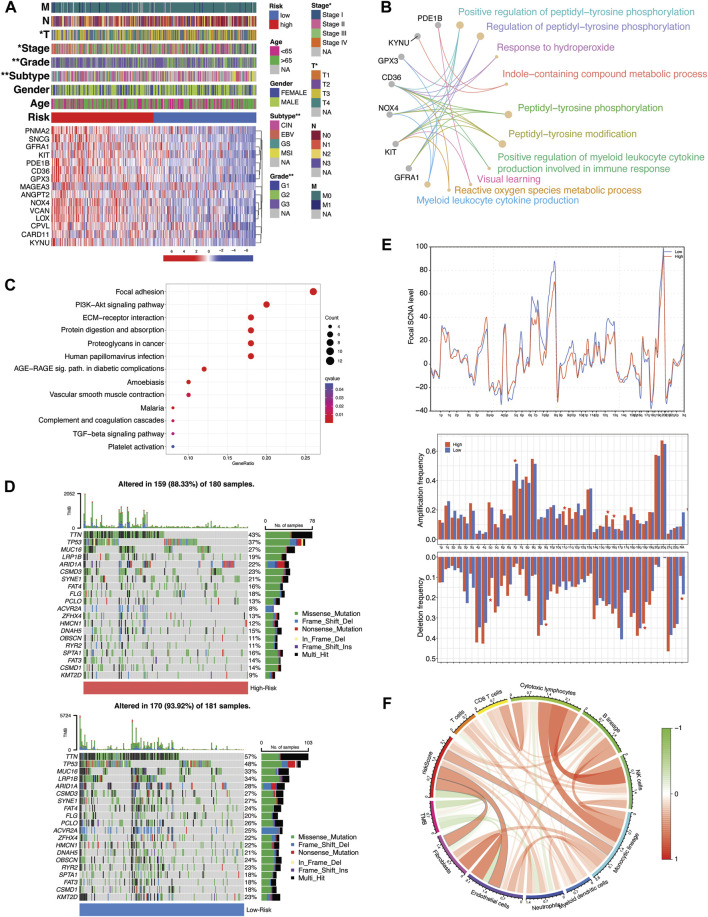
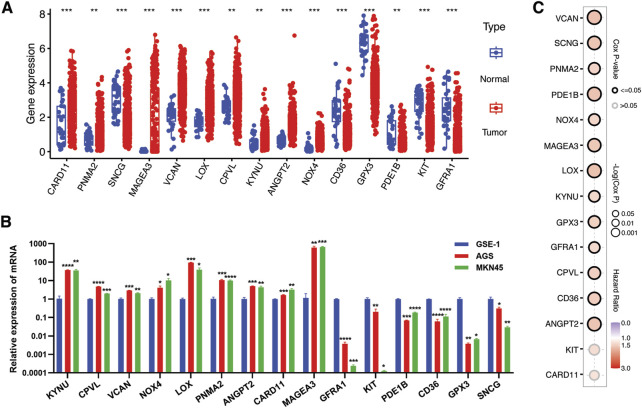
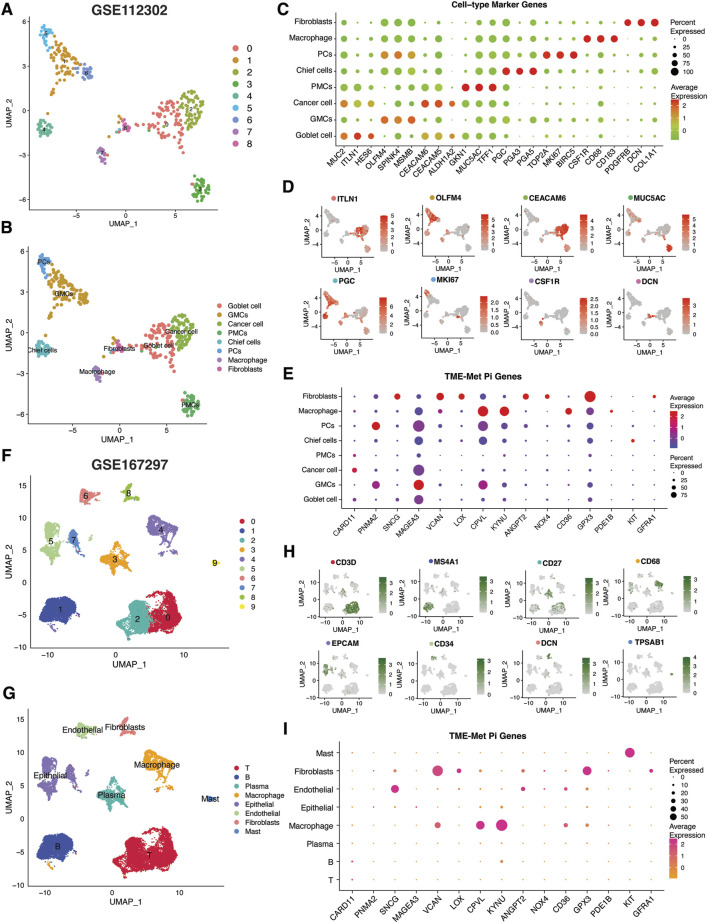
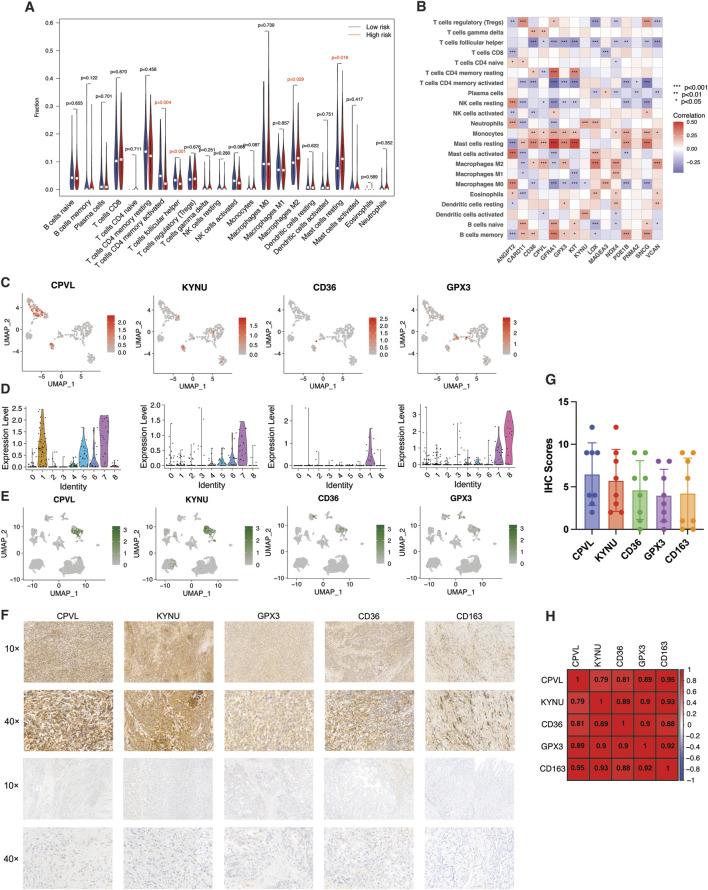
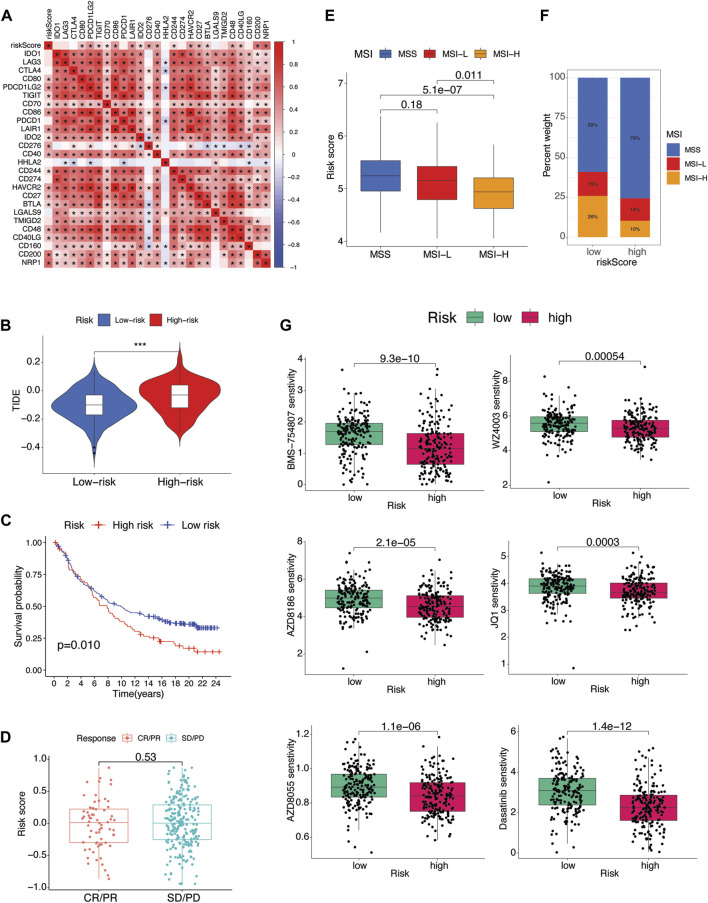
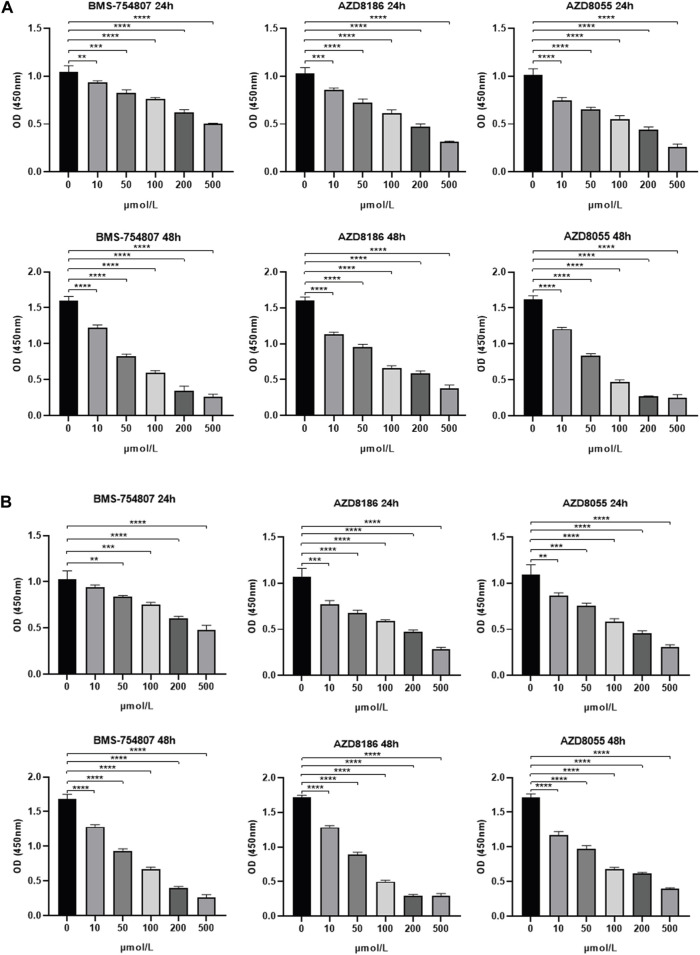
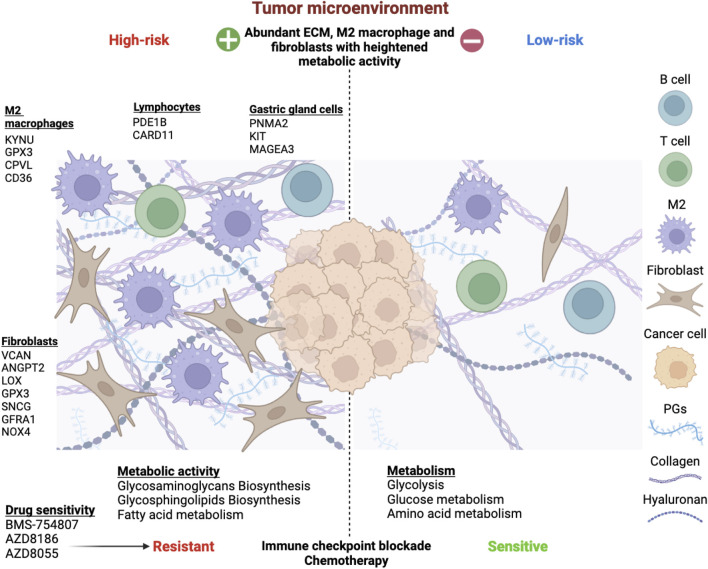
Gastric cancer, the fifth most prevalent cancer worldwide, is often diagnosed in advanced stages with limited treatment options. Examining the tumor microenvironment (TME) and its metabolic reprogramming can provide insights for better diagnosis and treatment. This study investigates the link between TME factors and metabolic activity in gastric cancer using bulk and single-cell RNA-sequencing data. We identified two molecular subtypes in gastric cancer by analyzing the distinct expression patterns of 81 prognostic genes related to the TME and metabolism, which exhibited significant protein-level interactions. The high-risk subtype had increased stromal content, fibroblast and M2 macrophage infiltration, elevated glycosaminoglycans/glycosphingolipids biosynthesis, and fat metabolism, along with advanced clinicopathological features. It also exhibited low mutation rates and microsatellite instability, associating it with the mesenchymal phenotype. In contrast, the low-risk group showed higher tumor content and upregulated protein and sugar metabolism. We identified a 15-gene prognostic signature representing these characteristics, including CPVL, KYNU, CD36, and GPX3, strongly correlated with M2 macrophages, validated through single-cell analysis and an internal cohort. Despite resistance to immunotherapy, the high-risk group showed sensitivity to molecular targeted agents directed at IGF-1R (BMS-754807) and the PI3K-mTOR pathways (AZD8186, AZD8055). We experimentally validated these promising drugs for their inhibitory effects on MKN45 and MKN28 gastric cells. This study unveils the intricate interplay between TME and metabolic pathways in gastric cancer, offering potential for enhanced diagnosis, patient stratification, and personalized treatment. Understanding molecular features in each subtype enriches our comprehension of gastric cancer heterogeneity and potential therapeutic targets.

Keywords: M2 macrophage; cancer metabolism; gastric cancer; single-cell analysis; tumor microenvironment.


Conflict of interest statement

The authors declare that the research was conducted in the absence of any commercial or financial relationships that could be construed as a potential conflict of interest.

Figures

FIGURE 1
FIGURE 1
Analytical process adopted in this article. The interplay between tumor microenvironment and metabolism genes was examined using transcriptomic data from 375 stomach adenocarcinoma (STAD) patients from TCGA (training set) and 407 tumor samples (validation set) from the GEO database. Differential expression analysis compared tumor (n = 375) to normal samples (n = 32), followed by uni-cox regression analysis and protein-level interaction analysis. This identified 81 crosstalk genes, labeled as TME-Met genes, which were then subjected to NMF clustering to assess clinical and functional implications. LASSO regression yielded a 15-gene risk signature, termed TME-Met risk signature, to stratify STAD patients into high and low-risk categories. Clinical, functional, and immunological features were evaluated, and gene expression in gastric cancer cells was validated using RT-qPCR. Single-cell validation identified four genes predominantly expressed by M2 macrophages, confirmed via IHC analysis. Finally, therapeutic implications were explored, identifying three potential drugs for inhibiting gastric cell proliferation.
FIGURE 2
FIGURE 2
Identification of TME- and metabolism-related DEGs with protein-level interactions and prognostic significance. (A) Volcano plots depicting TME- and (B) metabolism-related differentially expressed genes (DEGs). DEGs were defined according to the following criteria: log fold change (logFC) = 1, and the false discover rate (FDR) < 0.05. (C) Bubble Network illustrating the prognostic impact of significant TME- and metabolism-related DEGs and correlation among them. (D) Protein-protein interaction (PPI) network depicting protein-level interactions of TME-Met DEGs at interaction score = 0.4. (E) Heatmap shows the expression pattern of TME-Met DEGs between TCGA STAD normal (n = 32) and tumor samples (n = 375). Red and blue represent upregulation and downregulation respectively. (F) Circos plot depicting KEGG pathway enrichment analyses of TME-Met DEGs. (increasing depth of the red indicate the more obvious differences; q-value: the adjusted p-value).
FIGURE 3
FIGURE 3
Molecular subtyping and functional implication of TME-Met DEGs cross-talk. (A, B) Consensus clustering matrix in TCGA STAD patients. (C) Kaplan-Meier curves for the OS and (D) PFS comparison between clusters. (E) Heatmap illustrating the expression of 81 TME-Met DEGs (Red: upregulation; Blue: downregulation) between the clusters and correlation between clusters and clinicopathological features. (F) Heatmap shows the enrichment results of ESTIMATE algorithm and single-sample gene set enrichment analysis (ssGSEA) of immune cell infiltration between the clusters. p values are shown as: *p < 0.05; **p < 0.01; ***p < 0.001. (H) Sankey diagram presenting the correlation between clusters and immune subtypes. (I) Heatmaps showing GSVA enrichment scores of hallmark cancer pathways and (G) KEEG metabolic pathways in the clusters.
FIGURE 4
FIGURE 4
Construction and validation of TME-Met prognostic index. (A) LASSO regression of the 81 TME-Met genes and (B) Cross-validation for tuning the parameter selection in the LASSO regression. (C) Bar plot depicting the regression coefficients of the 15 TME-Met prognostic index (PI) genes. (D) Kaplan-Meier curves for the OS difference between risk subgroups in the TCGA cohort and (E) GEO cohort. (F) Time-dependent receiver operating characteristic (ROC) curves and area under curve (AUC) analyses depicting the predictive efficiency of riskScore in TCGA cohort and (G) GEO cohort. (H) Kaplan-Meier curves for the OS difference between risk subgroups in the TCGA cohort and (I) Time-dependent ROC curves and AUC analyses depicting the predictive efficiency of riskScore in external validation cohort (GSE15459). (J) Univariate and multivariate cox-regression analysis to evaluate the independent prognostic value of the risk score in TCGA and GEO cohorts.
FIGURE 5
FIGURE 5
Molecular and functional implications of TME-Met prognostic index. (A) Heatmap illustrating the expression of 15 TME-Met PI genes (Red: upregulation; Blue: downregulation) in the TME-Met PI risk subgroups (Red: high-risk; Blue: low-risk) and association with clinicopathological features (TNM staging. T: primary tumor; N: lymph node; M: metastasis. Degree of differentiation. G1: highly differentiated; G2: moderately differentiated; G3: poorly differentiated). (B) KEGG pathway enrichment analyses of TME-Met PI genes and (C) DEGs between the risk subgroups. (D) Oncoplot depicting the mutation frequency of top 20 mutated genes in the high- and low-risk groups. (E) Comparisons of focal- and arm-level amplification and deletion frequencies levels between risk subgroups. (F) Correlation among riskScore, TMB and TME infiltrates.
FIGURE 6
FIGURE 6
Verification of expression of TME-Met PI genes in gastric cancer. (A) The expression levels of TME-Met PI genes between risk subgroups in the TCGA STAD cohort. (B) mRNA expression level of TME-Met PI genes in gastric normal cell (GSE-1) and cancer cells (AGS and MKN45). p values are shown as: *p < 0.05; **p < 0.01; ***p < 0.001). (C) Bubble plot depicts overall survival significance of TME-Met PI genes in TCGA STAD samples.
FIGURE 7
FIGURE 7
Single-cell transcriptomic analysis of TME-Met PI genes in gastric cancer. (A, B) Uniform manifold approximation and projection (UMAP) plots showing main clusters and cell-types in single-cell gastric cancer dataset (GSE112302), colored by cluster (A) and (B) cell type. (C) Bubble plot shows the expression levels of top 3 marker genes in each cell-type for GSE112302 dataset. (D) UMAP plots displaying expression patterns of cell-specific marker genes for each cell-type in GSE112302 dataset. (E) The bubble plot depicting the expression levels of TME-Met PI genes in all cell types in GSE112302 dataset. (F, G) UMAP plots showing main clusters and cell-types in single-cell gastric cancer dataset (GSE167297), colored by cluster (F) and (G) cell type. (H) UMAP plots displaying expression patterns of cell-specific marker genes for each cell-type in GSE167297 dataset. (I) The bubble plot depicting the expression levels of TME-Met PI genes in all cell types in GSE167297 dataset.
FIGURE 8
FIGURE 8
Identification and validation of M2 macrophage-related risk genes. (A) Violin plot of abundance of 22 subtypes of immune cells in risk subgroups. (B) Spearman’s correlation between infiltration of 22 subtypes of immune cells and individual TME-Met PI genes (n = 15) in TCGA STAD cohort. p values are shown as: *p < 0.05; **p < 0.01; ***p < 0.001. (C) UMAP plots and (D) Violin plots showing expression patterns of CPVL, KYNU, CD36, and GPX3 in single-cell gastric cancer dataset (GSE112302). (E) UMAP plots showing expression patterns of CPVL, KYNU, CD36, and GPX3 in GSE167297 dataset. (F) Representative images of expression (brown, cell cytoplasmic/nucleus stain) and ( G ) IHC quantification of expression level of CPVL, KYNU, CD36, and GPX3 and marker of M2 macrophage (CD163) in the clinical samples of stomach adenocarcinoma (n = 8). ( H ) Pearson’s correlation of expression level of CPVL, KYNU, CD36, and GPX3 and marker of M2 macrophage (CD163) in the clinical samples of stomach adenocarcinoma.
FIGURE 9
FIGURE 9
Therapeutic implications (A) Pearson’s correlation between riskScore and several immune checkpoint inhibitors. p values are shown as: *p < 0.05; **p < 0.01; ***p < 0.001. (B) Association between riskScore and TIDE score of TCGA STAD patients. (C) The Kaplan-Meier curves of difference in survival probability between risk subgroups and (D) boxplots of riskScore variation in responsiveness to immune checkpoint blockade of IMvigor210 urothelial carcinoma cohort. (E) Box plot of association of microsatellite instability (MSI) and riskScore. (F) Percent of MSI types in each risk subgroup. (G) Drug sensitivity analysis of risk subgroups.
FIGURE 10
FIGURE 10
Experimental validation of drug sensitivity analysis (A) 24-h/48-h inhibitory capacity of BMS-754807, AZD8186, and AZD8055 on MKN45 and (B) MKN28 gastric cancer cells at various concentrations (0, 10, 50, 100, 200, 500 μmol/L) using CCK-8 assay. 0 μmol/L was considered as control. *p < 0.05; **p < 0.01; ***p < 0.001, ****p < 0.0001.
FIGURE 11
FIGURE 11
Overview of the risk stratification of gastric cancer patients based on tumor microenvironment and metabolism interplay. Extensive analysis revealed 15 risk genes expressed by diverse TME components. M2 macrophages upregulated KYNU, GPX3, CPVL, and CD36. Fibroblasts expressed VCAN, ANGPT2, LOX, GPX3, SNCG, GFRA1, and NOX4, impacting proliferation, mesenchymal transition, angiogenesis, and ROS production. PDE1B and CARD11 were associated with B and T lymphocytes, while PNMA2, KIT, and MAGEA3 were expressed by various gastric gland cells, such as chief cells, gland mucous cells, and proliferative cells. The TME-Met Interplay upregulated ECM biosynthesis and fatty acid metabolism. The high-risk subgroup showed resistance to immunotherapy and chemotherapy but responded to three molecular targeted drugs. Conversely, low-risk patients exhibited enriched glycolysis, glucose, and amino acid metabolism, with lower ECM content and sensitivity to immunotherapy and chemotherapy.

Similar articles

Cited by

References

    1. Ajani J. A., Lee J., Sano T., Janjigian Y. Y., Fan D., Song S. (2017). Gastric adenocarcinoma. Nat. Rev. Dis. Prim. 3, 17036. 10.1038/nrdp.2017.36 - DOI - PubMed
    1. Al-Mansoob M., Gupta I., Stefan Rusyniak R., Ouhtit A. (2021). KYNU, a novel potential target that underpins CD44-promoted breast tumour cell invasion. J. Cell. Mol. Med. 25 (5), 2309–2314. 10.1111/jcmm.16296 - DOI - PMC - PubMed
    1. Aran D., Hu Z., Butte A. J. (2017). xCell: digitally portraying the tissue cellular heterogeneity landscape. Genome Biol. 18 (1), 220. 10.1186/s13059-017-1349-1 - DOI - PMC - PubMed
    1. Badgwell B. (2016). Multimodality therapy of localized gastric adenocarcinoma. J. Natl. Compr. Cancer Netw. JNCCN. 14 (10), 1321–1327. 10.6004/jnccn.2016.0139 - DOI - PubMed
    1. Bat-Erdene U., Quan E., Chan K., Lee B. M., Matook W., Lee K. Y., et al. (2018). Neutrophil TLR4 and PKR are targets of breast cancer cell glycosaminoglycans and effectors of glycosaminoglycan-induced APRIL secretion. Oncogenesis 7 (6), 45. 10.1038/s41389-018-0058-2 - DOI - PMC - PubMed