

Chloroplast DNA methylation in the kelp Saccharina latissima is determined by origin and possibly influenced by cultivation
- PMID: 38962361
- PMCID: PMC11219511
- DOI: 10.1111/eva.13744
Chloroplast DNA methylation in the kelp Saccharina latissima is determined by origin and possibly influenced by cultivation
Abstract
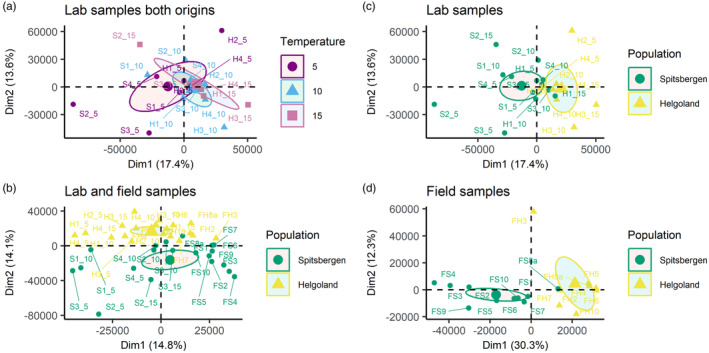
DNA cytosine methylation is an important epigenetic mechanism in genomic DNA. In most land plants, it is absent in the chloroplast DNA. We detected methylation in the chloroplast DNA of the kelp Saccharina latissima, a non-model macroalgal species of high ecological and economic importance. Since the functional role of the chloroplast methylome is yet largely unknown, this fundamental research assessed the chloroplast DNA cytosine methylation in wild and laboratory raised kelp from different climatic origins (High-Arctic at 79° N, and temperate at 54° N), and in laboratory samples from these origins raised at different temperatures (5, 10 and 15°C). Results suggest genome-wide differences in methylated sites and methylation level between the origins, while rearing temperature had only weak effects on the chloroplast methylome. Our findings point at the importance of matching conditions to origin in restoration and cultivation processes to be valid even on plastid level.
Keywords: aquaculture; epigenetics; marine algae; marine macrophyte; non‐model organism; organelle genome methylation; plastid.
© 2024 The Author(s). Evolutionary Applications published by John Wiley & Sons Ltd.
Conflict of interest statement
No conflicts of interest were met.
Figures


References
-
- Alexa, A. , & Rahnenführer, J. (2009). Gene set enrichment analysis with topGO. Bioconductor Improv, 27, 1–26.
-
- Bartsch, I. , Wiencke, C. , Bischof, K. , Buchholz, C. M. , Buck, B. H. , Eggert, A. , Feuerpfeil, P. , Hanelt, D. , Jacobsen, S. , Karez, R. , Karsten, U. , Molis, M. , Roleda, M. Y. , Schubert, H. , Schumann, R. , Valentin, K. , Weinberger, F. , & Wiese, J. (2008). The genus Laminaria sensu lato: Recent insights and developments. European Journal of Phycology, 43, 1–86. 10.1080/09670260701711376 - DOI
-
- Benjamini, Y. , & Hochberg, Y. (1995). Controlling the false discovery rate: A practical and powerful approach to multiple testing. Journal of the Royal Statistical Society B, 57, 289–300.
-
- Bolton, J. J. , & Lüning, K. (1982). Optimal growth and maximal survival temperatures of Atlantic Laminaria species (Phaeophyta) in culture. Marine Biology, 66, 89–94. 10.1007/BF00397259 - DOI
LinkOut - more resources
Full Text Sources
