. 2024 Jul 2;5(7):e636.
doi: 10.1002/mco2.636. eCollection 2024 Jul.

Single-cell transcriptome dissecting the microenvironment remodeled by PD1 blockade combined with photodynamic therapy in a mouse model of oral carcinogenesis

Affiliations

Single-cell transcriptome dissecting the microenvironment remodeled by PD1 blockade combined with photodynamic therapy in a mouse model of oral carcinogenesis

Yunmei Dong et al. MedComm (2020). .

Abstract

Oral squamous cell carcinoma (OSCC) stands as a predominant and perilous malignant neoplasm globally, with the majority of cases originating from oral potential malignant disorders (OPMDs). Despite this, effective strategies to impede the progression of OPMDs to OSCC remain elusive. In this study, we established mouse models of oral carcinogenesis via 4-nitroquinoline 1-oxide induction, mirroring the sequential transformation from normal oral mucosa to OPMDs, culminating in OSCC development. By intervening during the OPMDs stage, we observed that combining PD1 blockade with photodynamic therapy (PDT) significantly mitigated oral carcinogenesis progression. Single-cell transcriptomic sequencing unveiled microenvironmental dysregulation occurring predominantly from OPMDs to OSCC stages, fostering a tumor-promoting milieu characterized by increased Treg proportion, heightened S100A8 expression, and decreased Fib_Igfbp5 (a specific fibroblast subtype) proportion, among others. Notably, intervening with PD1 blockade and PDT during the OPMDs stage hindered the formation of the tumor-promoting microenvironment, resulting in decreased Treg proportion, reduced S100A8 expression, and increased Fib_Igfbp5 proportion. Moreover, combination therapy elicited a more robust treatment-associated immune response compared with monotherapy. In essence, our findings present a novel strategy for curtailing the progression of oral carcinogenesis.

Keywords: immune checkpoint blockade; multiomics; oral carcinogenesis; photodynamic therapy; single‐cell transcriptome sequencing.


Conflict of interest statement

All authors disclosed no relevant relationships.

Figures
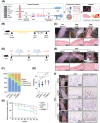
FIGURE 1
FIGURE 1
The combination of PD1 blockade and PDT exerted synergistic effects to prevent the progression of oral carcinogenesis in vivo. (A) Overview of the whole experimental strategy. The whole study could be divided into two sections: oral carcinogenesis and treatment. The dynamic features of microenvironment in oral carcinogenesis will be dissociated and how these features change in response to treatment (PD1mAb, PDT, and the combination of PD1mAb and PDT) by WES and scRNA‐seq. (B) Experimental scheme of 4‐NQO‐induced mice model. Mice were feed with 4‐NQO (50 µg/mL) in the drinking water for 16 weeks and then replaced with tap water until week 24. (C) Representative images of tongue visible lesions and H&E staining for normal, OLK, and OSCC mice. (D) Experimental scheme of treatment. OLK mice were divided into four groups randomly (each group n = 12): OSCC (only PBS, twice/week), antiPD1 (only PD1 mAb, twice/week), PDT (only PDT, once/month), COMBO (PD1 mAb and PDT). Because the observation endpoint of treatment is the same as the timepoint of OSCC, to avoid unnecessary mice sacrifice, OSCC mice were also regarded as controls in the section of treatment. (E) Representative images of tongue visible lesions and H&E staining for homogeneous lesions (homo), nonhomogeneous lesions (nonhomo), and carcinoma. (F) Quantification of lesion grades (homo, nonhomo, and carcinoma) from mice in the different groups (each group n = 12). (G) Quantification of mice weights in the different groups. Each point in the graph represents an individual mouse. ns p > 0.05, *p ≤ 0.05, and **p ≤ 0.01 by Wilcoxon. (H) Kaplan–Meier survival analysis across the four groups. The outcome indicator was that visible exophytic lesions were observed and the lesions’ diameter ≥1 mm (each group n = 12). *p ≤ 0.05 by Log‐rank test. (I) Representative images of tongue visible lesions and IHC staining of Ki67 and Cleaved Caspase‐3 in tissue slides from both control and treatment groups.
FIGURE 2
FIGURE 2
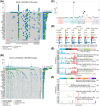
The mutational profiles of 4‐NQO‐induced oral carcinogenesis mice model were highly similar to that of smoking. (A) Oncoplot displaying the somatic landscape of mice samples. (B) Oncoplot displaying the somatic landscape of TCGA HNSCC samples. (C) The mutation burden of each mouse sample. (D) The number/percentage of single‐nucleotide variants (SNV) class in each group. (E) Signatures of single base substitution (SBS) profile. (F) Signatures of double base substitution (DBS) profile.
FIGURE 3
FIGURE 3
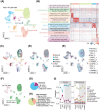
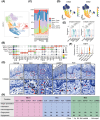
Whole‐cell atlas was mapped by scRNA‐seq. (A) UMAP plot visualizing 10 cell types encompassing 81,826 cells from all samples (n = 12). (B) Heatmap showing expression levels of marker genes for each cell type. (C) UMAP plot visualizing cells colored by seurat clusters (n = 24). (D) UMAP plot visualizing cells colored by groups (n = 6). (E) UMAP plot visualizing cells colored by samples (n = 12). (F) UMAP plot visualizing cells colored by immune cells (n = 16,173 cells) and nonimmune cells (n = 65,653 cells). (G) Pie chart showing the proportion of each immune subset in total immune cells. (H) Pie chart showing the proportion of each nonimmune subset in total nonimmune cells. (I) Line charts showing the proportion of various cell types in each group.
FIGURE 4
FIGURE 4
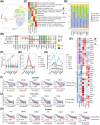
Epithelial subtypes and functional remodeling. (A) UMAP plot visualizing the identified five epithelial subtypes (total = 17,519 cells). (B) Dotplot showing expression levels of top‐expression genes for each epithelial subtype. (C) Heatmap showing the expression‐based pathway activities score of each epithelial subtype by GSVA. (D) Stacked bar plot showing the proportion of per epithelial subtype in each sample. (E) Heatmap showing expression levels of inflammatory, antigen presentation, chemical carcinogenesis, hypoxia, TNF, and NF‐κB‐related genes across the six groups. (F) Box plots showing cell proliferation‐related gene signature score of each group. Each point in the graph represents an individual epithelial cell. ns p > 0.05, *p ≤ 0.05, **p ≤ 0.01, ***p ≤ 0.001, and ****p ≤ 0.0001 by Wilcoxon. (G) Line charts showing normalized expression level of the genes overexpressed in the whole process in oral carcinogenesis across the six groups. (H) Line charts showing normalized expression levels of the genes only overexpressed in OLK across the six groups. (I) Kaplan–Meier survival analysis of the upregulated genes in the whole process in oral carcinogenesis in GSE26549 cohort. p Values were calculated by log‐rank test. (J) Kaplan–Meier survival analysis of the upregulated genes in the whole process in oral carcinogenesis in TCGA OSCC cohort. p Values were calculated by log‐rank test. (K) Kaplan–Meier survival analysis of the genes only overexpressed in OLK in GSE26549 cohort. p Values were calculated by log‐rank test.
FIGURE 5
FIGURE 5
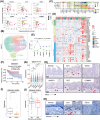
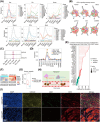
Fibroblast subtypes and functional remodeling. (A) Scatter plot visualizing the incoming/outgoing strength of each cell type scatter plot across the six groups. (B) UMAP plot visualizing the identified five fibroblast subtypes (total = 38,811 cells). (C) Dotplot showing expression levels of top‐expression genes for each fibroblast subtype. (D) Heatmap showing expression levels of antigen presentation, extracellular matrix (ECM) proteins, ECM enzymes, and inflammatory‐related genes across the six groups. (E) Folding line chart showing the proportion of Fib_Igfbp5 and Fib_S100a4 in each group. (F) Kaplan–Meier survival analysis of the genesets of Fib_Igfbp5 in GSE26549 cohort. p Values were calculated by log‐rank test. (G) Box plots with jitter showing the expression level of Igfbp5 in fibroblasts across the six groups. Each point in the graph represents a fibroblast. ns p > 0.05, *p ≤ 0.05, **p ≤ 0.01, ***p ≤ 0.001, and ****p ≤ 0.0001 by Wilcoxon. (H) Representative images of IHC staining of IGFBP5 in mice tongue slides. (I) Box plots showing the expression level of IGFBP5 in GSE85195. Each point in the graph represents an individual patient. The P‐value was calculated by Wilcoxon. (J) Box plots showing the expression level of IGFBP5 in GSE26549. Each point in the graph represents an individual patient. The p Value was calculated by Wilcoxon. (K) Representative images of IHC staining of IGFBP5 in human normal oral mucosa, OLK, and OSCC tissue slides.
FIGURE 6
FIGURE 6
Myeloid subtypes and functional remodeling. (A) UMAP plot visualizing the identified six myeloid subtypes (total = 12,612 cells). (B) Dotplot showing expression levels of top‐expression genes for each myeloid subtype. (C) Box plot showing the proportion of per myeloid subtype in each sample. (D) UMAP of scale normalized expression of S100a8 (left) and S100a9 (right). (E) Box plot with jitter showing the expression level of S100a8 (left) and S100a9 (right) in total myeloid cells across the six groups. Each point in the graph represents a myeloid cell. ns p > 0.05, *p ≤ 0.05, **p ≤ 0.01, ***p ≤ 0.001, and ****p ≤ 0.0001 by Wilcoxon. (F) Violin plot showing expression levels of the Cd274 in per myeloid subtype. (G) IHC staining of S100A8 in mice tongue slides across the six groups. (H) Summary of the main functions’ changes in DCs, macrophages, and mast cells across groups. The reference for OLK and OSCC group is normal group, and the reference for antiPD1, PDT, and COMBO is OSCC group.
FIGURE 7
FIGURE 7
The expression of CXCL9 is positive correlated with the infiltration of exhausted CD8+T cells. (A) Line charts showing the expression level of inflammation‐related genes in epithelial cells, endothelial cells, fibroblasts, macrophages, DCs, and mast cells across the six groups. (B) Chord diagrams showing the strength of CXCL signaling network between cell types across the six groups. (C) Violin plot showing expression levels of the Cxcl9 and Cxcl10 in per epithelial subtype. (D) Line charts showing the proportion of Epi_Cxcl9, Macro_Cd274, CD8_Tex, Endo_Selp across the twelve samples. (E) Lollipop chart showing the correlation between the expression level of CD8A and inflammation‐related genes in TCGA OSCC cohorts. The coefficient of correlation was calculated using the Pearson correlation coefficient method. (F) Heatmap showing the expression level of CXCL9, CXCL10, and CXCR3 of per sample in human scRNA‐seq datasets. (G) Box plots with jitter showing the frequency of CD8+T cells in CXCL9 high group and CXCL9 low group. Each jitter in the graph represents an individual patient. ns p > 0.05, *p ≤ 0.05, **p ≤ 0.01, ***p ≤ 0.001, and ****p ≤ 0.0001 by Wilcoxon. (H) Graphical summary of the formation of “hot tumor.” (I) mIHC staining of CXCL9, CD8, CK5 in CXCL9high and CXCL9low human OSCC slides.

Similar articles

References

    1. Siegel RL, Miller KD, Wagle NS, Jemal A. Cancer statistics, 2023. CA Cancer J Clin. 2023;73(1):17‐48. - PubMed
    1. Harrington KJ, Ferris RL, Blumenschein G, et al. Nivolumab versus standard, single‐agent therapy of investigator's choice in recurrent or metastatic squamous cell carcinoma of the head and neck (CheckMate 141): health‐related quality‐of‐life results from a randomised, phase 3 trial. Lancet Oncol. 2017;18(8):1104‐1115. - PMC - PubMed
    1. Wise‐Draper TM, Gulati S, Palackdharry S, et al. Phase II clinical trial of neoadjuvant and adjuvant pembrolizumab in resectable local–regionally advanced head and neck squamous cell carcinoma. Clin Cancer Res. 2022;28(7):1345‐1352. - PMC - PubMed
    1. Pinto AC, Caramês J, Francisco H, et al. Malignant transformation rate of oral leukoplakia—systematic review. Oral Surg Oral Med Oral Pathol Oral Radiol. 2020;129(6):600‐611. e2. - PubMed
    1. Dong Y, Wang Z, Mao F, et al. PD‐1 blockade prevents the progression of oral carcinogenesis. Carcinogenesis. 2021;42(6):891‐902. - PubMed