. 2024 Jul;11(3):035001.
doi: 10.1117/1.NPh.11.3.035001. Epub 2024 Jul 3.

Detectability of hemodynamic oscillations in cerebral cortex through functional near-infrared spectroscopy: a simulation study

Affiliations

Detectability of hemodynamic oscillations in cerebral cortex through functional near-infrared spectroscopy: a simulation study

Letizia Contini et al. Neurophotonics. 2024 Jul.

Abstract

Significance: We explore the feasibility of using time-domain (TD) and continuous-wave (CW) functional near-infrared spectroscopy (fNIRS) to monitor brain hemodynamic oscillations during resting-state activity in humans, a phenomenon that is of increasing interest in the scientific and medical community and appears to be crucial to advancing the understanding of both healthy and pathological brain functioning.

Aim: Our general object is to maximize fNIRS sensitivity to brain resting-state oscillations. More specifically, we aim to define comprehensive guidelines for optimizing main operational parameters in fNIRS measurements [average photon count rate, measurement length, sampling frequency, and source-detector distance (SSD)]. In addition, we compare TD and CW fNIRS performance for the detection and localization of oscillations.

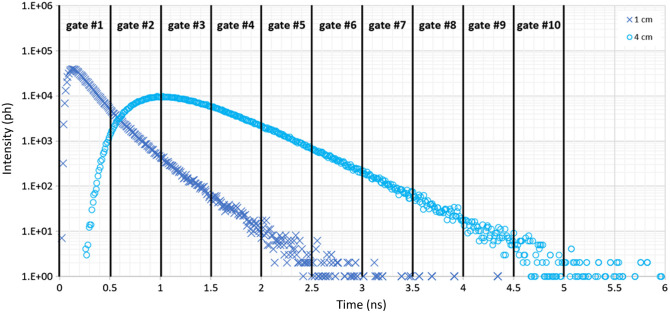
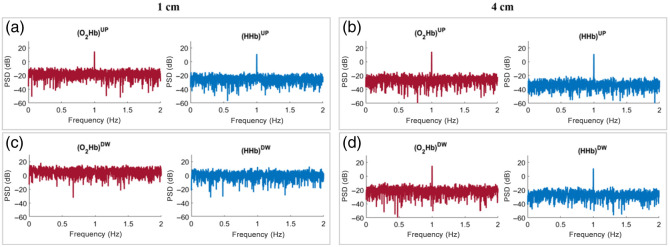
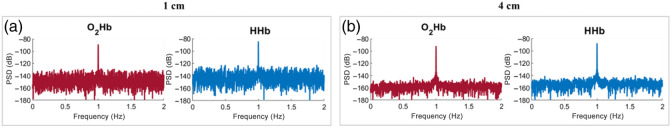
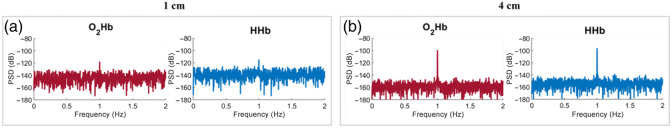
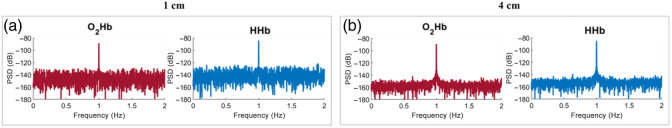
Approach: A series of synthetic TD and CW fNIRS signals were generated by exploiting the solution of the diffusion equation for two different geometries of the probed medium: a homogeneous medium and a bilayer medium. Known and periodical perturbations of the concentrations of oxy- and deoxy-hemoglobin were imposed in the medium, determining changes in its optical properties. The homogeneous slab model was used to determine the effect of multiple measurement parameters on fNIRS sensitivity to oscillatory phenomena, and the bilayer model was used to evaluate and compare the abilities of TD and CW fNIRS in detecting and isolating oscillations occurring at different depths. For TD fNIRS, two approaches to enhance depth-selectivity were evaluated: first, a time-windowing of the photon distribution of time-of-flight was performed, and then, the time-dependent mean partial pathlength (TMPP) method was used to retrieve the hemoglobin concentrations in the medium.

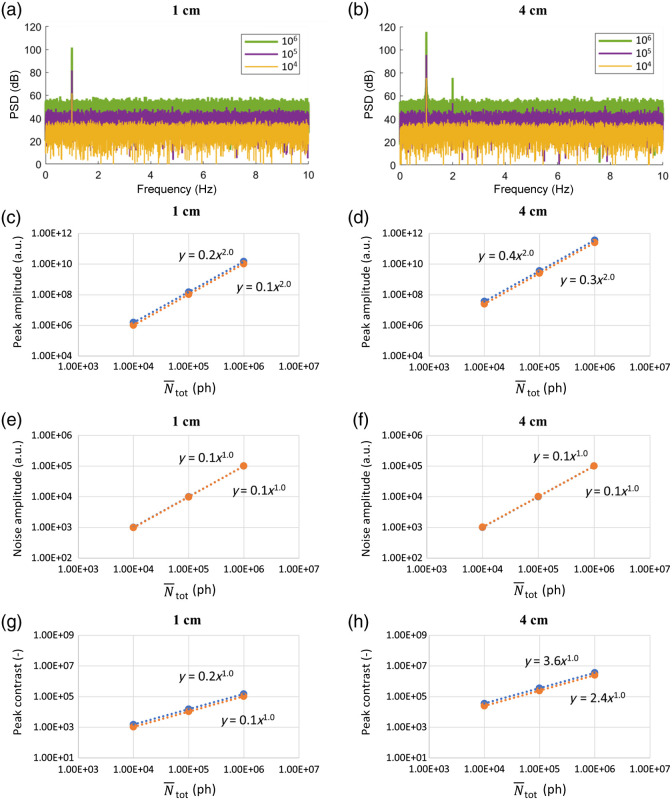
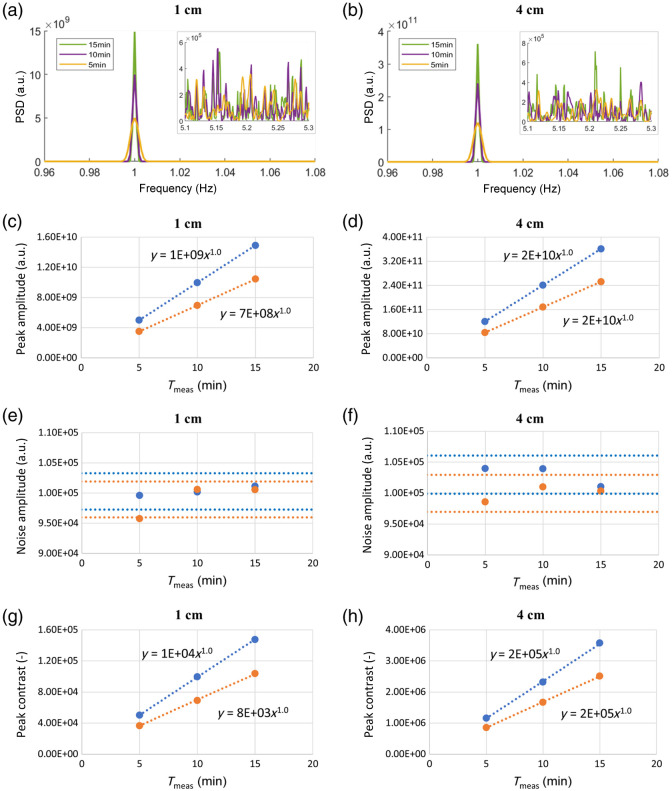
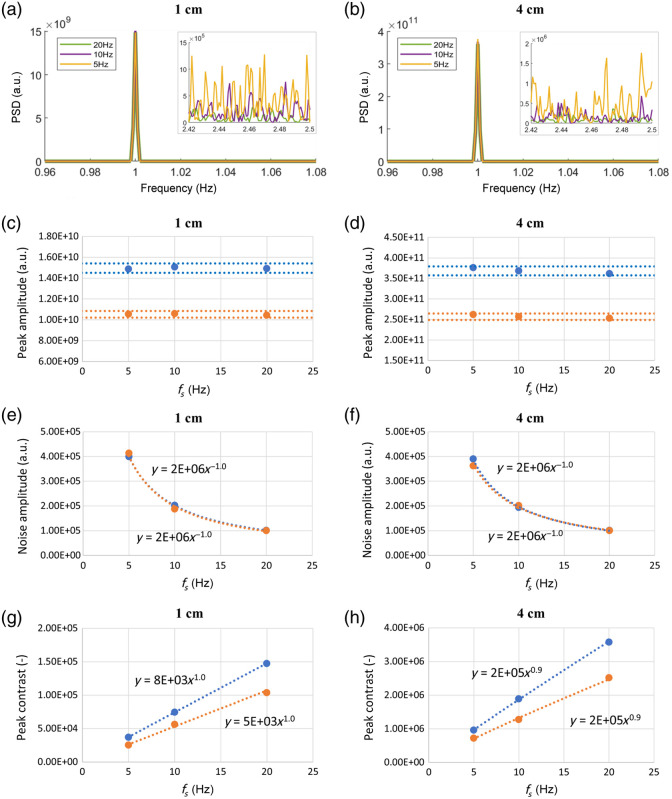
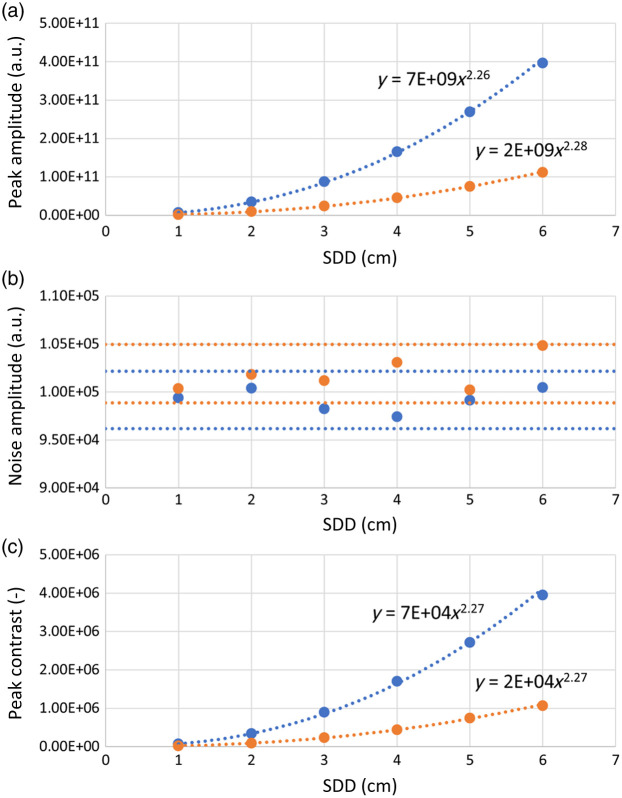
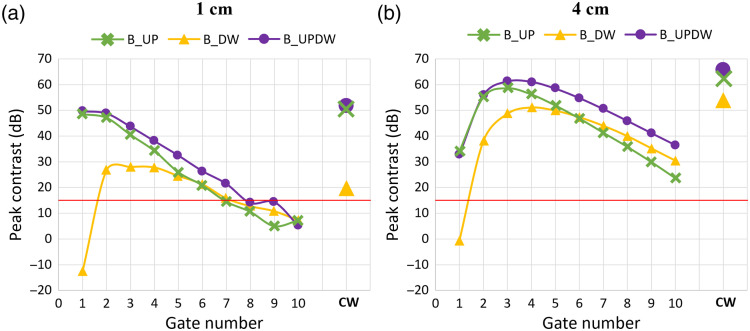
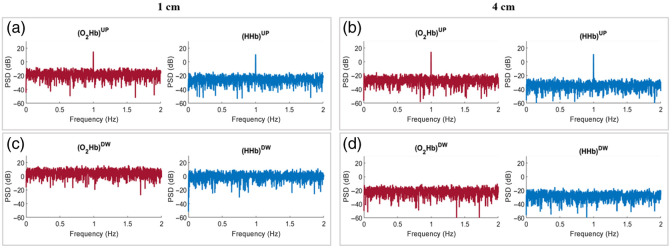
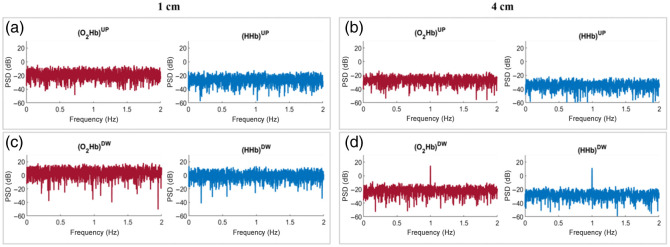
Results: In the homogeneous medium case, the sensitivity of TD and CW fNIRS to periodical perturbations of the optical properties increases proportionally with the average photon count rate, the measurement length, and the sampling frequency and approximatively with the square of the SSD. In the bilayer medium case, the time-windowing method can detect and correctly localize the presence of oscillatory components in the TD fNIRS signal, even in the presence of very low photon count rates. The TMPP method demonstrates how to correctly retrieve the periodical variation of hemoglobin at different depths from the TD fNIRS signal acquired at a single SSD. For CW fNIRS, measurements taken at typical SSDs used for short-separation channel regression show notable sensitivity to oscillations occurring in the deep layer, challenging the assumptions underlying this correction method when the focus is on analyzing oscillatory phenomena.

Conclusions: We demonstrated that the TD fNIRS technique allows for the detection and depth-localization of periodical fluctuations of the hemoglobin concentrations within the probed medium using an acquisition at a single SSD, offering an alternative to multi-distance CW fNIRS setups. Moreover, we offered some valuable guidelines that can assist researchers in defining optimal experimental protocols for fNIRS studies.

Keywords: brain; continuous-wave functional near-infrared spectroscopy; diffuse optics; hemodynamic oscillations; resting-state; time-domain functional near-infrared spectroscopy.


Figures

Fig. 1
Fig. 1
Effect of N¯tot (case H_Ntot). The two columns represent signals acquired with SSD of 1 cm (left) and 4 cm (right). (a), (b) Examples of PSDs obtained at 690 nm. (c), (d) Amplitude of the spectral peak at 1 Hz; (e), (f) amplitude of the average noise; (g), (h) peak contrast. The results are reported for 690 nm, in blue, and 830 nm, in orange. A power law fit is applied to each dataset, all giving R20.999.
Fig. 2
Fig. 2
Effect of Tmeas (case H_Tmeas). The two columns represent signals acquired with SSD of 1 cm (left) and 4 cm (right). (a), (b) Examples of PSDs obtained at 690 nm. The smaller boxes show a zoom of the PSD noise region. (c), (d) Amplitude of the spectral peak at 1 Hz; (e), (f) amplitude of the average noise; (g), (h) peak contrast. The results are reported for 690 nm, in blue, and 830 nm, in orange. A power law fit is applied to each dataset in panels (c), (d), (g), and (h), all giving R20.999. In panels (e) and (f), the horizontal lines represent a 3% variation around the mean value.
Fig 3
Fig 3
Effect of fs (case H_fs). The two columns represent signals acquired with SSD of 1 cm (left) and 4 cm (right). (a), (b) Examples of PSDs obtained at 690 nm. The smaller boxes show a zoom of the PSD noise region. (c), (d) Amplitude of the spectral peak at 1 Hz; (e), (f) amplitude of the average noise; (g), (h) peak contrast. The results are reported for 690 nm, in blue, and 830 nm, in orange. A power law fit is applied to each dataset in panels (e), (f), (g), and (h), all giving R20.99. In panels (c) and (d), the horizontal lines represent a 3% variation around the mean value.
Fig. 4
Fig. 4
Effect of SDD (case H_SDD). (a) Amplitude of the spectral peak at 1 Hz, (b) amplitude of the average noise, and (c) peak contrast. The results are reported for 690 nm, in blue, and 830 nm, in orange. A power law fit is applied to each dataset in panels (a) and (c), all giving R20.999. In panel (b), the horizontal lines represent a 3% variation around the mean value.
Fig. 5
Fig. 5
Example of DTOFs as recorded at SDD = 1 cm (dark blue, crosses) and SDD = 4 cm (light blue, circles) for N¯tot=106  ph and λ=690  nm. The applied time-windowing is represented by means of black vertical lines, positioned at the edges of each gate.
Fig. 6
Fig. 6
Contrast value of the 1 Hz peak as a function of the gate number for case B_UP (green, crosses), case B_DW (yellow, triangles), and case B_UPDW (purple, circles), with N¯tot=106  ph. (a) Results obtained for SSD = 1 cm; (b) results obtained for SDD = 4 cm. In both graphs, the red horizontal line represents the peak significance threshold of 15 dB.
Fig. 7
Fig. 7
PSDs of the hemodynamic parameters obtained from TD fNIRS for case B_UP, with N¯tot=105  ph. (a) Signals acquired at SDD = 1 cm, superficial layer (UP); (b) signals acquired at SDD = 4 cm, superficial layer; (c) signals acquired at SDD = 1 cm, deeper layer (DW); (d) signals acquired at SDD = 4 cm, deeper layer.
Fig. 8
Fig. 8
PSDs of the hemodynamic parameters obtained from TD fNIRS for case B_DW, with N¯tot=105  ph. (a) Signals acquired at SDD = 1 cm, superficial layer (UP); (b) signals acquired at SDD = 4 cm, superficial layer; (c) signals acquired at SDD = 1 cm, deeper layer (DW); (d) signals acquired at SDD = 4 cm, deeper layer.
Fig. 9
Fig. 9
PSDs of the hemodynamic parameters obtained from TD fNIRS for case B_UPDW, with N¯tot=105  ph. (a) Signals acquired at SDD = 1 cm, superficial layer (UP); (b) signals acquired at SDD = 4 cm, superficial layer; (c) signals acquired at SDD = 1 cm, deeper layer (DW); (d) signals acquired at SDD = 4 cm, deeper layer.
Fig. 10
Fig. 10
PSDs of the hemodynamic parameters obtained from CW fNIRS for case B_UP, with N¯tot=106  ph. (a) Signals acquired at SDD = 1 cm; (b) signals acquired at SDD = 4 cm.
Fig. 11
Fig. 11
PSDs of the hemodynamic parameters obtained from CW fNIRS for case B_DW, with N¯tot=106  ph. (a) Signals acquired at SDD = 1 cm; (b) signals acquired at SDD = 4 cm.
Fig. 12
Fig. 12
PSDs of the hemodynamic parameters obtained from CW fNIRS for case B_UPDW, with N¯tot=106  ph. (a) Signals acquired at SDD = 1 cm; (b) signals acquired at SDD = 4 cm.

Similar articles

References

    1. Li M., et al. , “The decoupling between hemodynamic parameters and neural activity implies a complex origin of spontaneous brain oscillations,” Front. Comput. Neurosci. 17, 1214793 (2023).10.3389/fncom.2023.1214793 - DOI - PMC - PubMed
    1. Schroeter M. L., Schmiedel O., Von Cramon D. Y., “Spontaneous low-frequency oscillations decline in the aging brain,” J. Cereb. Blood Flow Metab. 24(10), 1183–1191 (2004).10.1097/01.WCB.0000135231.90164.40 - DOI - PubMed
    1. Tong Y., Lindsey K. P., Frederick B. D., “Partitioning of physiological noise signals in the brain with concurrent near-infrared spectroscopy and fMRI,” J. Cereb. Blood Flow Metab. 31(12), 2352–2362 (2011).10.1038/jcbfm.2011.100 - DOI - PMC - PubMed
    1. Muehlschlegel S., et al. , “Feasibility of NIRS in the neurointensive care unit: a pilot study in stroke using physiological oscillations,” Neurocrit. Care 11(2), 288–295 (2009).10.1007/s12028-009-9254-4 - DOI - PMC - PubMed
    1. Yang D., Hong K.-S., “Quantitative assessment of resting-state for mild cognitive impairment detection: a functional near-infrared spectroscopy and deep learning approach,” J. Alzheimer’s Dis. 80(2), 647–663 (2021).10.3233/JAD-201163 - DOI - PubMed