

Mutations in Genes Producing Nitric Oxide and Hydrogen Sulfide and Their Connection With Apoptotic Genes in Chronic Myeloid Leukemia
- PMID: 38962618
- PMCID: PMC11221202
- DOI: 10.7759/cureus.61570
Mutations in Genes Producing Nitric Oxide and Hydrogen Sulfide and Their Connection With Apoptotic Genes in Chronic Myeloid Leukemia
Abstract
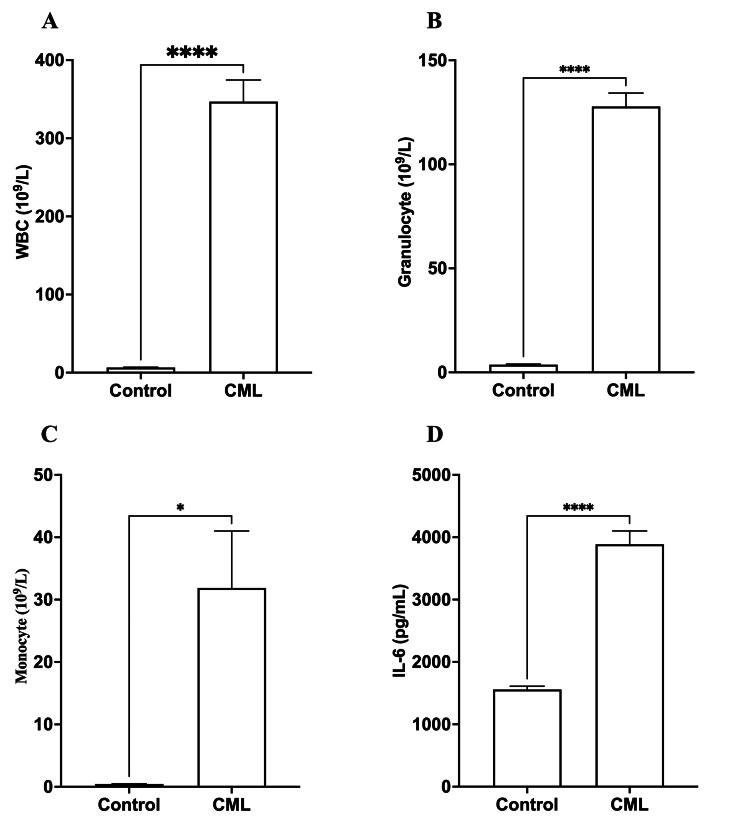
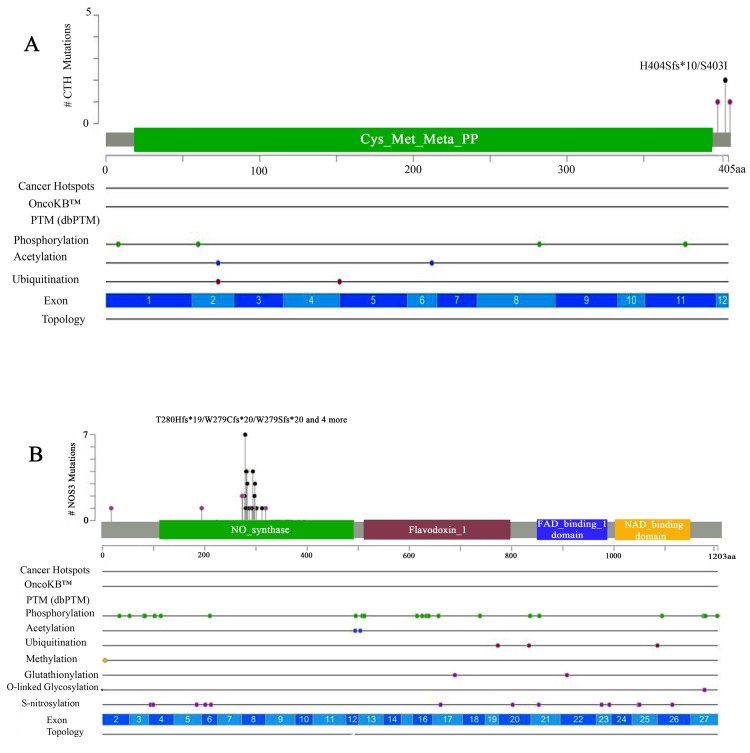
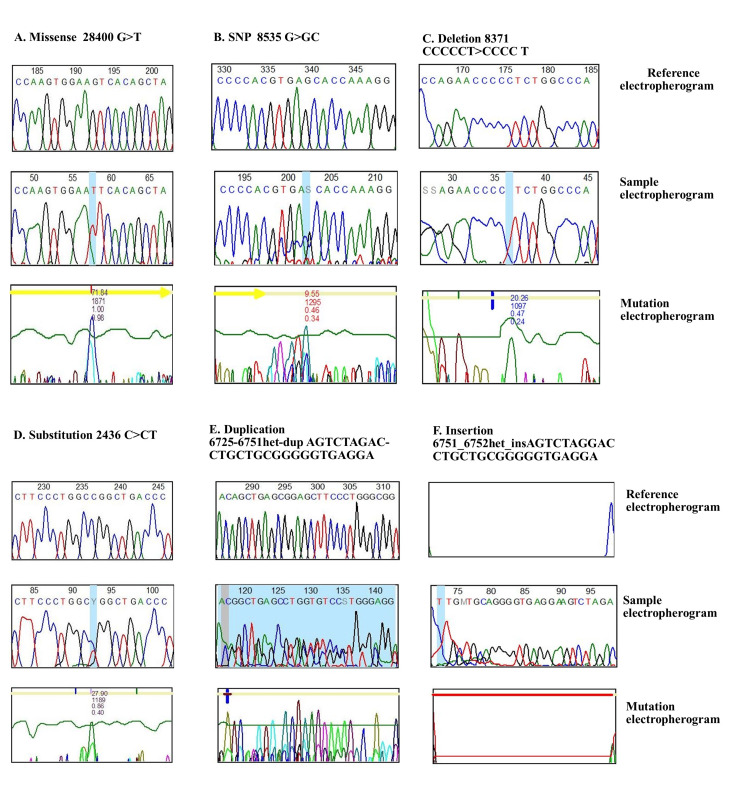
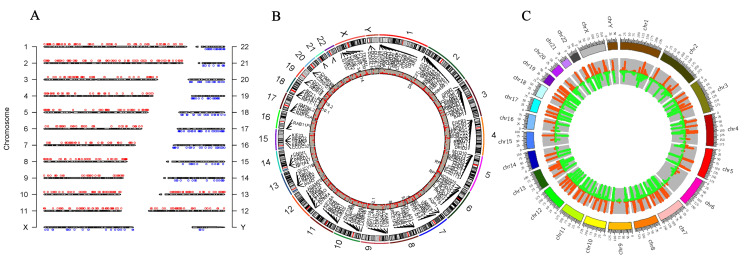
Background Despite advances in chronic myeloid leukemia (CML) genetics, the role of nitric oxide (NO) and hydrogen sulfide (H2S) gene mutations and their relationship to apoptotic genes is unclear. Therefore, this study investigated NO- and H2S-producing genes' mutations and their interactions with apoptotic genes using Sanger sequencing and next-generation sequencing (NGS). Methodology A complete blood count (CBC) was carried out to measure the total number of white blood cells, while IL-6 levels were assessed in both control and CML patients using an ELISA technique. Sanger sequencing was used to analyze mutations in the CTH and NOS3 genes, whereas NGS was applied to examine mutations on all chromosomes. Results White blood cell (WBC) and granulocyte counts were significantly higher in CML patients compared to controls (p<0.0001), and monocyte counts were similarly higher (p<0.05). Interleukin-6 (IL-6) levels were significantly elevated in CML patients than controls (p<0.0001), indicating a possible link to CML etiology or progression. Multiple mutations have been identified in both genes, notably in CTH exon 12 and the NOS3 genes VNTR, T786C, and G894T. This study also measured IL-6 concentrations using IL-6 assays, identifying its potential as a CML prognostic diagnostic. WBC counts, granulocyte counts, and mid-range absolute counts, or MID counts, were significantly higher in CML patients than in normal control individuals. NGS identified 1643 somatic and sex chromosomal abnormalities and 439 actively expressed genes in CML patients. The findings imply a genomic landscape beyond the BCR-ABL1 mutation in CML development compared to other databases. Conclusion In conclusion, this study advances the understanding of the genetic characteristics of CML by identifying mutations in the NO- and H2S-producing genes and their complex connections with genes involved in apoptosis. The comprehensive genetic profile obtained by Sanger sequencing and NGS provides possibilities for identifying novel targets for therapy and personalized treatments for CML, therefore contributing to developments in hematological diseases.
Keywords: chronic myeloid leukaemia; cth gene; next generation sequencing (ngs); next-generation sequencing (ngs); nos3 gene; sanger sequencing.
Copyright © 2024, Saber et al.
Conflict of interest statement
Human subjects: Consent was obtained or waived by all participants in this study. Human Ethics Research Committee of the College of Science, Salahaddin University-Erbil issued approval 4/5/439. Animal subjects: All authors have confirmed that this study did not involve animal subjects or tissue. Conflicts of interest: In compliance with the ICMJE uniform disclosure form, all authors declare the following: Payment/services info: All authors have declared that no financial support was received from any organization for the submitted work. Financial relationships: All authors have declared that they have no financial relationships at present or within the previous three years with any organizations that might have an interest in the submitted work. Other relationships: All authors have declared that there are no other relationships or activities that could appear to have influenced the submitted work.
Figures
Similar articles
-
Deep sequencing reveals the spectrum of BCR-ABL1 mutations upon front-line therapy resistance in chronic myeloid leukemia: An Eastern-Indian cohort study.Cancer Treat Res Commun. 2022;33:100635. doi: 10.1016/j.ctarc.2022.100635. Epub 2022 Sep 15. Cancer Treat Res Commun. 2022. PMID: 36155130
-
Prospective assessment of NGS-detectable mutations in CML patients with nonoptimal response: the NEXT-in-CML study.Blood. 2020 Feb 20;135(8):534-541. doi: 10.1182/blood.2019002969. Blood. 2020. PMID: 31877211
-
Next-generation sequencing for BCR-ABL1 kinase domain mutation testing in patients with chronic myeloid leukemia: a position paper.J Hematol Oncol. 2019 Dec 5;12(1):131. doi: 10.1186/s13045-019-0815-5. J Hematol Oncol. 2019. PMID: 31801582 Free PMC article. Review.
-
A novel BCR-ABL1 fusion gene identified by next-generation sequencing in chronic myeloid leukemia.Mol Cytogenet. 2016 Jun 27;9:47. doi: 10.1186/s13039-016-0257-5. eCollection 2016. Mol Cytogenet. 2016. PMID: 27350795 Free PMC article.
-
Molecular techniques for the personalised management of patients with chronic myeloid leukaemia.Biomol Detect Quantif. 2017 Feb 14;11:4-20. doi: 10.1016/j.bdq.2017.01.001. eCollection 2017 Mar. Biomol Detect Quantif. 2017. PMID: 28331814 Free PMC article. Review.
References
LinkOut - more resources
Full Text Sources
Miscellaneous