

Individual longitudinal changes in DNA-methylome identify signatures of early-life adversity and correlate with later outcome
- PMID: 38962694
- PMCID: PMC11219970
- DOI: 10.1016/j.ynstr.2024.100652
Individual longitudinal changes in DNA-methylome identify signatures of early-life adversity and correlate with later outcome
Abstract
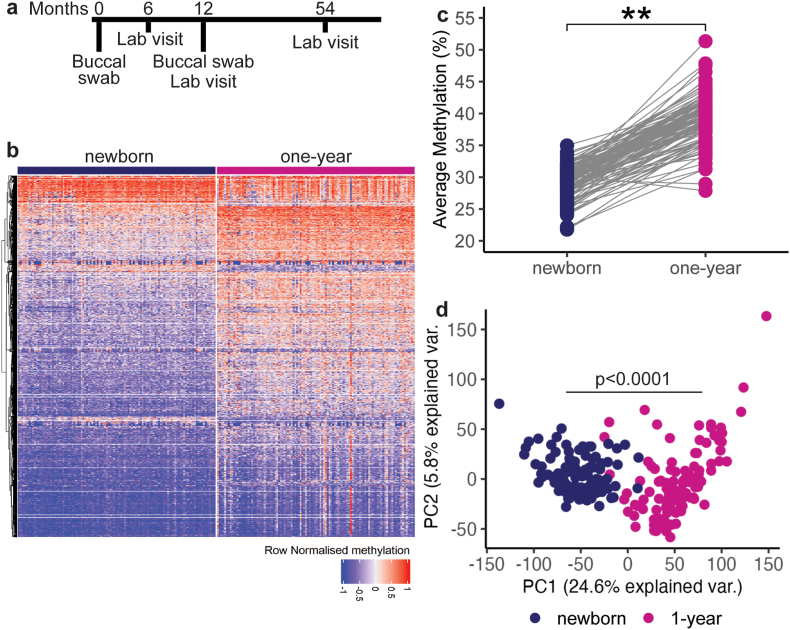
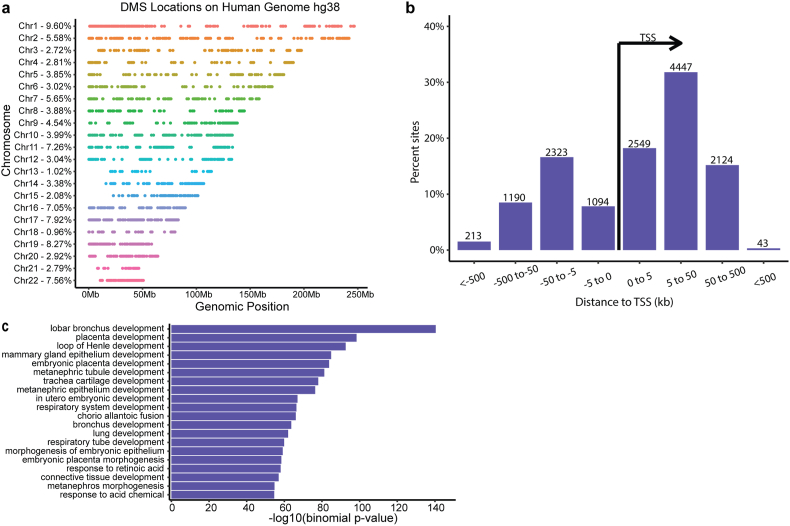
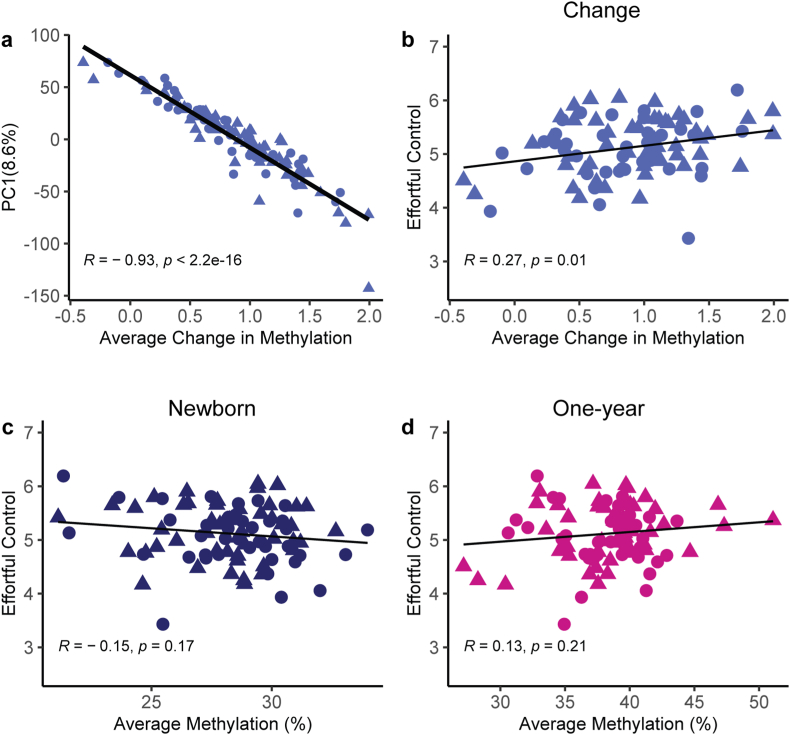
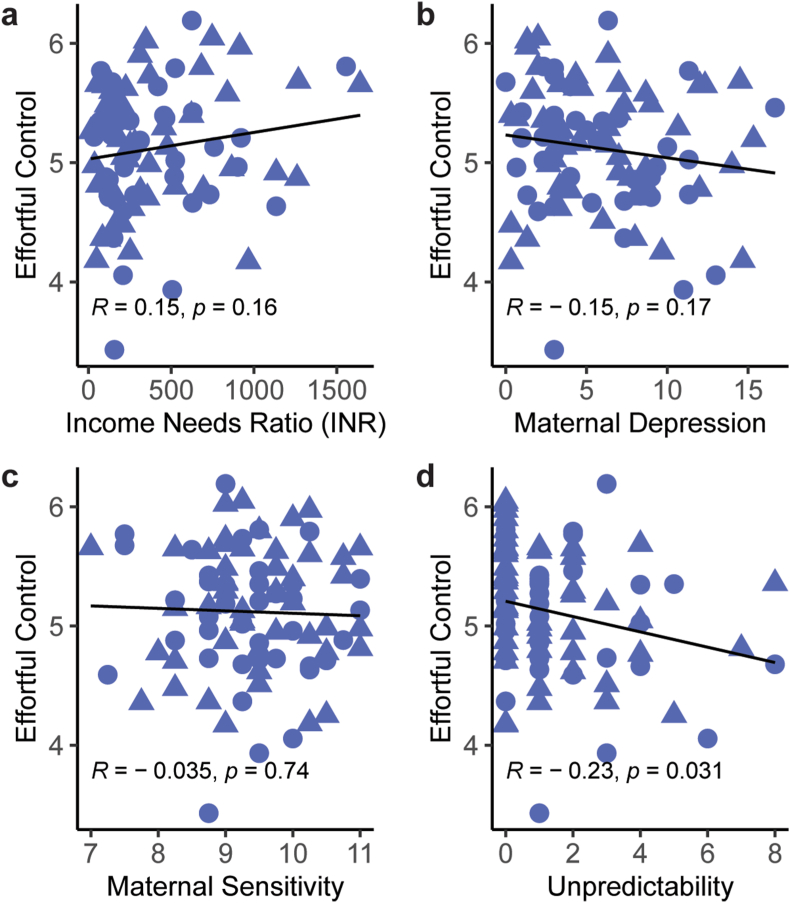
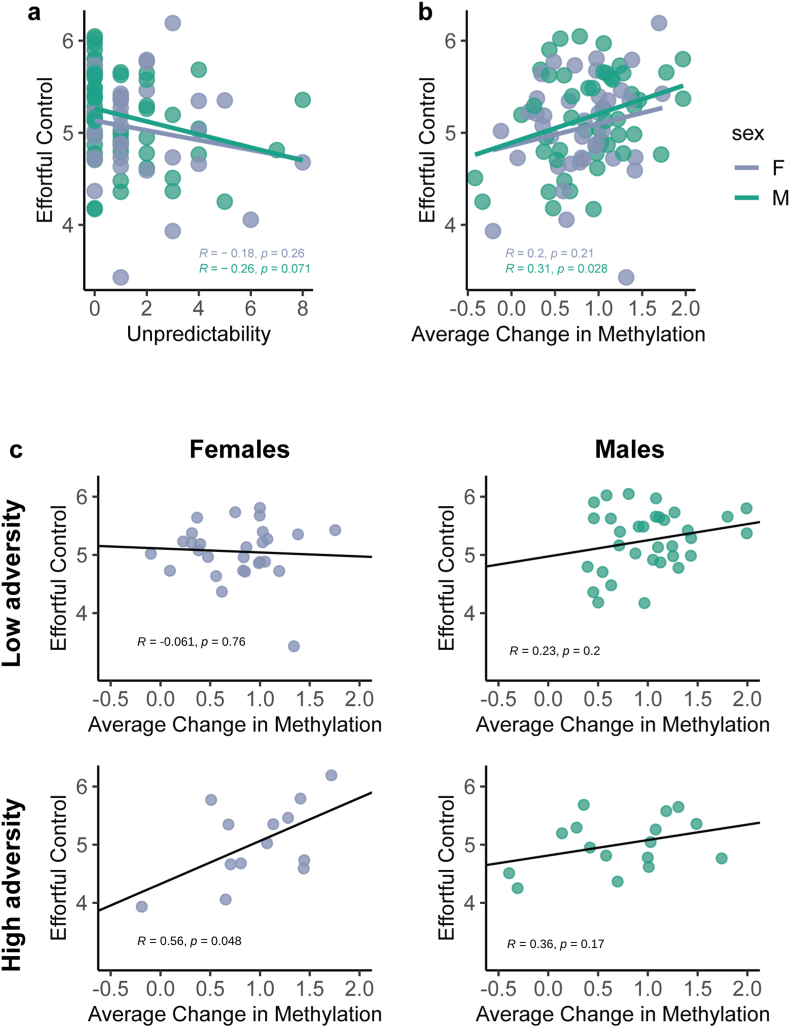
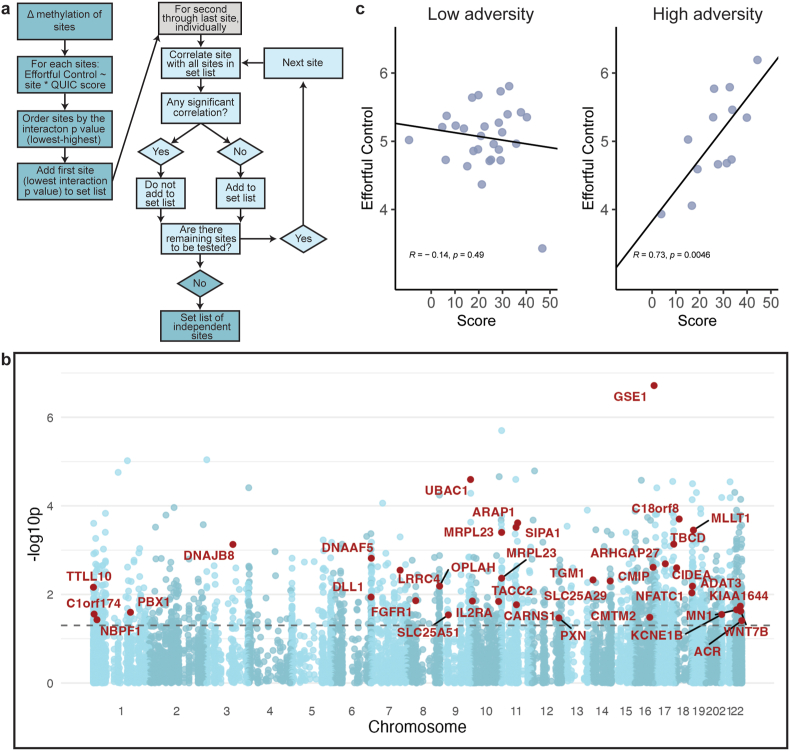
Adverse early-life experiences (ELA) affect a majority of the world's children. Whereas the enduring impact of ELA on cognitive and emotional health is established, there are no tools to predict vulnerability to ELA consequences in an individual child. Epigenetic markers including peripheral-cell DNA-methylation profiles may encode ELA and provide predictive outcome markers, yet the interindividual variance of the human genome and rapid changes in DNA methylation in childhood pose significant challenges. Hoping to mitigate these challenges we examined the relation of several ELA dimensions to DNA methylation changes and outcome using a within-subject longitudinal design and a high methylation-change threshold. DNA methylation was analyzed in buccal swab/saliva samples collected twice (neonatally and at 12 months) in 110 infants. We identified CpGs differentially methylated across time for each child and determined whether they associated with ELA indicators and executive function at age 5. We assessed sex differences and derived a sex-dependent 'impact score' based on sites that most contributed to methylation changes. Changes in methylation between two samples of an individual child reflected age-related trends and correlated with executive function years later. Among tested ELA dimensions and life factors including income to needs ratios, maternal sensitivity, body mass index and infant sex, unpredictability of parental and household signals was the strongest predictor of executive function. In girls, high early-life unpredictability interacted with methylation changes to presage executive function. Thus, longitudinal, within-subject changes in methylation profiles may provide a signature of ELA and a potential predictive marker of individual outcome.
Keywords: Adverse childhood experiences; Biomarkers; DNA methylation; Early-life stress; Epigenetics; Executive control; Methylomics; Precision medicine; Stress; Within-subject design.
© 2024 The Authors.
Conflict of interest statement
The authors declare that they have no known competing financial interests or personal relationships that could have appeared to influence the work reported in this paper.
Figures
Update of
-
Within-subject changes in methylome profile identify individual signatures of early-life adversity, with a potential to predict neuropsychiatric outcome.bioRxiv [Preprint]. 2023 Dec 19:2023.12.16.571594. doi: 10.1101/2023.12.16.571594. bioRxiv. 2023. Update in: Neurobiol Stress. 2024 May 31;31:100652. doi: 10.1016/j.ynstr.2024.100652. PMID: 38187766 Free PMC article. Updated. Preprint.
Similar articles
-
Within-subject changes in methylome profile identify individual signatures of early-life adversity, with a potential to predict neuropsychiatric outcome.bioRxiv [Preprint]. 2023 Dec 19:2023.12.16.571594. doi: 10.1101/2023.12.16.571594. bioRxiv. 2023. Update in: Neurobiol Stress. 2024 May 31;31:100652. doi: 10.1016/j.ynstr.2024.100652. PMID: 38187766 Free PMC article. Updated. Preprint.
-
Early life adversity drives sex-dependent changes in 5-mC DNA methylation of parvalbumin cells in the prefrontal cortex in rats.bioRxiv [Preprint]. 2024 Feb 1:2024.01.31.578313. doi: 10.1101/2024.01.31.578313. bioRxiv. 2024. PMID: 38352518 Free PMC article. Preprint.
-
DNA Methylation of PXDN Is Associated with Early-Life Adversity in Adult Mental Disorders.Biomolecules. 2024 Aug 9;14(8):976. doi: 10.3390/biom14080976. Biomolecules. 2024. PMID: 39199364 Free PMC article.
-
Bridging Basic and Clinical Research in Early Life Adversity, DNA Methylation, and Major Depressive Disorder.Front Genet. 2019 Mar 22;10:229. doi: 10.3389/fgene.2019.00229. eCollection 2019. Front Genet. 2019. PMID: 30984237 Free PMC article. Review.
-
The effects of early life adversity on children's mental health and cognitive functioning.Transl Psychiatry. 2022 Jun 10;12(1):244. doi: 10.1038/s41398-022-02001-0. Transl Psychiatry. 2022. PMID: 35688817 Free PMC article. Review.
Cited by
-
Characterizing the Social Epigenome in Mexican Patients with Early-Onset Psychosis.Genes (Basel). 2025 May 17;16(5):591. doi: 10.3390/genes16050591. Genes (Basel). 2025. PMID: 40428414 Free PMC article.
-
Sex-Specific Effects of Early Life Unpredictability on Hippocampal and Amygdala Responses to Novelty in Adolescents.bioRxiv [Preprint]. 2024 Sep 21:2024.09.20.614130. doi: 10.1101/2024.09.20.614130. bioRxiv. 2024. PMID: 39345394 Free PMC article. Preprint.
-
Quantification of Epigenetic Aging in Public Health.Annu Rev Public Health. 2025 Apr;46(1):91-110. doi: 10.1146/annurev-publhealth-060222-015657. Epub 2024 Dec 16. Annu Rev Public Health. 2025. PMID: 39681336 Free PMC article. Review.
-
Neurobiology of resilience to early life stress.Neuropsychopharmacology. 2025 Jun 25. doi: 10.1038/s41386-025-02158-4. Online ahead of print. Neuropsychopharmacology. 2025. PMID: 40562842 Review.
-
Leveraging research into sex differences and steroid hormones to improve brain health.Nat Rev Endocrinol. 2025 Apr;21(4):214-229. doi: 10.1038/s41574-024-01061-0. Epub 2024 Nov 25. Nat Rev Endocrinol. 2025. PMID: 39587332 Review.
