. 2024 May 25;11(6):nwae182.
doi: 10.1093/nsr/nwae182. eCollection 2024 Jun.

Lysophosphatidylcholine binds α-synuclein and prevents its pathological aggregation

Affiliations

Lysophosphatidylcholine binds α-synuclein and prevents its pathological aggregation

Chunyu Zhao et al. Natl Sci Rev. .

Abstract

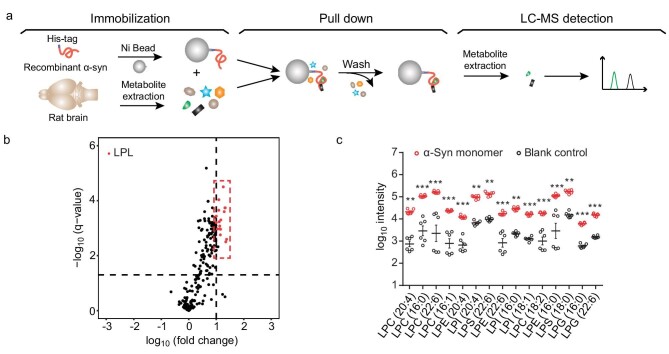
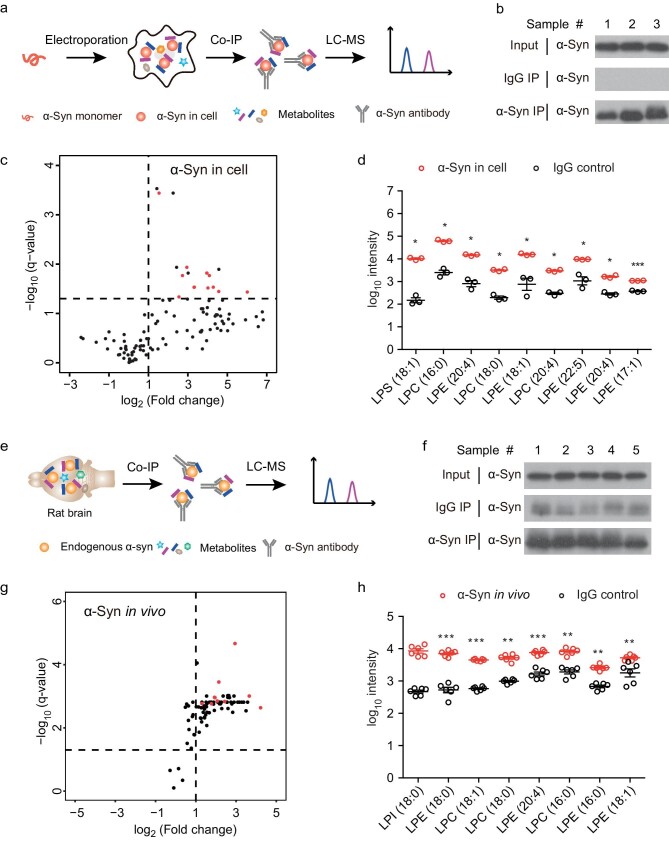
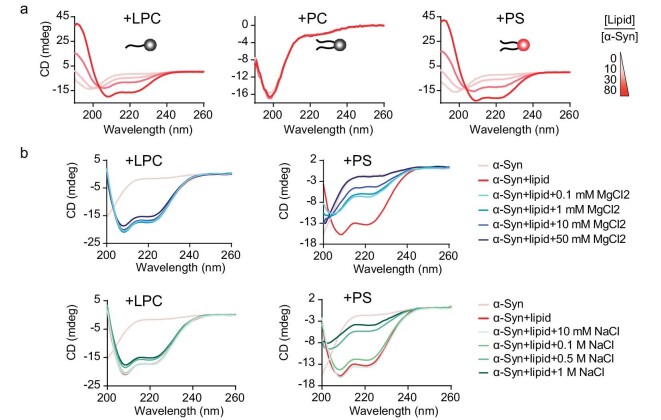
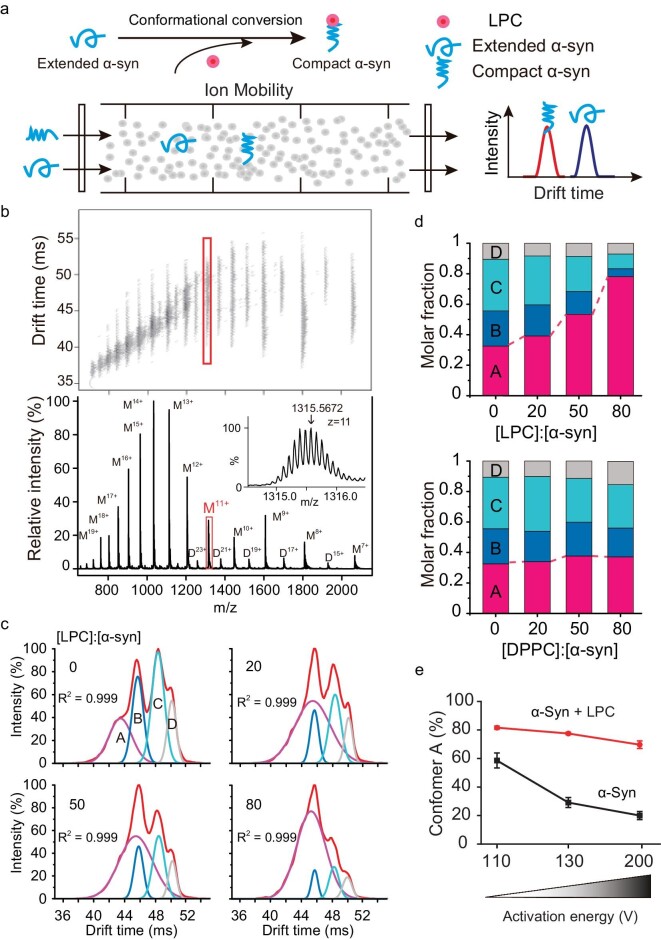
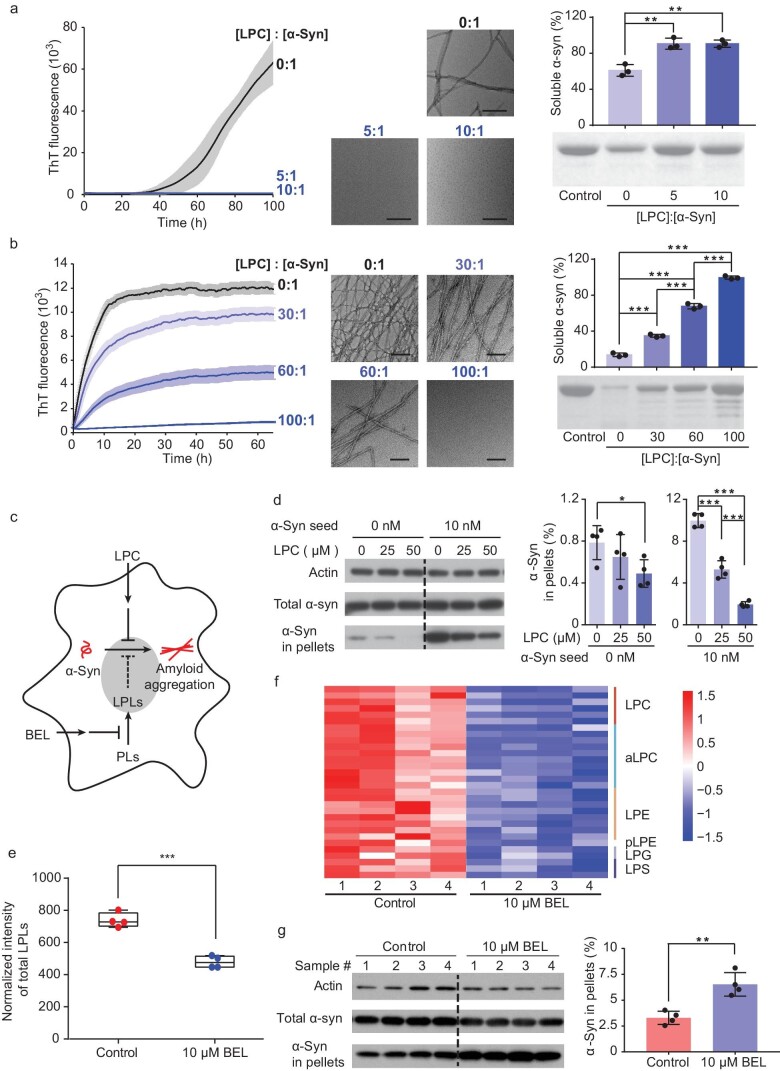
Accumulation of aggregated α-synuclein (α-syn) in Lewy bodies is the pathological hallmark of Parkinson's disease (PD). Genetic mutations in lipid metabolism are causative for a subset of patients with Parkinsonism. The role of α-syn's lipid interactions in its function and aggregation is recognized, yet the specific lipids involved and how lipid metabolism issues trigger α-syn aggregation and neurodegeneration remain unclear. Here, we found that α-syn shows a preference for binding to lysophospholipids (LPLs), particularly targeting lysophosphatidylcholine (LPC) without relying on electrostatic interactions. LPC is capable of maintaining α-syn in a compact conformation, significantly reducing its propensity to aggregate both in vitro and within cellular environments. Conversely, a reduction in the production of cellular LPLs is associated with an increase in α-syn accumulation. Our work underscores the critical role of LPLs in preserving the natural conformation of α-syn to inhibit improper aggregation, and establishes a potential connection between lipid metabolic dysfunction and α-syn aggregation in PD.

Keywords: Parkinson's disease; lysophosphatidylcholine, aggregation; α-synuclein.


Figures

Figure 1.
Figure 1.
The α-syn monomer shows the preference for binding to LPLs in vitro. (a) Schematic illustration of the in vitro metabolite profiling assay developed in this study. His-tagged α-syn monomers were immobilized on Ni beads and incubated with metabolite extracts from rat brains. Bound metabolites were detected and identified by LC-MS-based metabolite profiling. (b) Volcano plots of the identified metabolites. LPLs that bind with the α-syn monomer with high significance and fold change are highlighted in red. The horizontal dashed line indicates a q-value of 0.05. The vertical dashed line indicates a fold change of 10. q-Values were calculated by Student's t-test followed by false discovery rates (FDR) correction. Fold change represents the metabolite intensity of the α-syn sample over that of the blank sample. (c) Intensities of the top-ranking LPLs that bind with the α-syn monomer in comparison with those of the blank control. Data represent the mean ± SEM (standard error of mean) (n = 6). *, q-value < 0.05; **, q-value < 0.01; ***, q-value < 0.001; Student's t-test followed by FDR correction.
Figure 2.
Figure 2.
LPL interacts with α-Syn in cells and in vivo. (a, e) Schematic illustration of the metabolite profiling for in-cell α-syn (a) and in vivo α-syn (e). Recombinant α-syn monomers were electroporated into HEK 293T cells and then immunoprecipitated by α-syn antibody (a). Endogenous α-syn in rat brains was extracted by immunoprecipitation (e). Co-precipitated metabolites were identified by LC-MS. (b, f) Western blot confirmed that α-syn was extracted from cells (b) and endogenous α-syn was extracted from the rat brain (f) by IP. (c, g) Volcano plots show the metabolite-binding profile of in-cell α-syn (c) and endogenous α-syn (g). LPLs with significant changes (fold change > 2, q-value < 0.05) are highlighted in red. Fold change represents the metabolite intensity of the α-syn sample over that of the IgG control sample. (d, h) Intensity of the top-ranking LPLs that co-precipitated with in-cell α-syn (d) and endogenous α-syn (h). Data represent the mean ± SEM (n = 3 in d, n = 6 in h), *, q-value < 0.05; **, q-value < 0.01; ***, q-value < 0.001; Student's t-test followed by FDR correction.
Figure 3.
Figure 3.
LPC induces the structural transition of α-syn independent of electrostatic interaction. (a) The secondary structure transition of α-syn in the presence of LPC micelles, PC liposomes and PS liposomes monitored by circular dichroism (CD) spectroscopy. Lipid molecules are shown as cartoons with neutral head groups (in the left and middle panels) and negatively charged head groups (in the right panel). The color bar indicates the molar ratios of lipid/α-syn. (b) CD spectroscopy shows that as concentrations of salts (MgCl2 or NaCl) increase, the DOPS–α-syn interaction was disrupted accordingly, whereas the LPC–α-syn interaction was not apparently affected.
Figure 4.
Figure 4.
LPC compacts α-syn and increases its stability. (a) The schematics of IM-MS technology. (b) IM-MS spectrum of α-syn with charge-state distributions. Monomeric charged state (11+) is highlighted with a frame, and is zoomed in with labels in the inset. (c) IM-MS spectrum isolated from 11+ charged α-syn was deconvolved into four conformers (A–D) on the basis of Ω acquired from α-syn in the presence of LPC. (d) Population distribution change of the four conformers (A–D) upon the addition of LPC (upper) and DPPC (lower). (e) The compact conformer A of α-syn is stabilized by LPC and resists activation-induced unfolding.
Figure 5.
Figure 5.
LPC inhibits α-syn aggregation in vitro and in cells. (a, b) The ThT kinetic assay (graph on left) and the analysis of soluble α-syn (graph on right) shows the inhibition effect of LPC on α-syn aggregation at relatively low LPC/α-syn ratios (a) and high LPC/α-syn ratios (b). α-Syn aggregation was enhanced by the addition of 0.05% (v/v) preformed α-syn fibril seeds in (b). Transmission electron microscopy (TEM) images in the middle were taken at the end of the ThT assay for each sample. Scale bar = 200 nm. Data represent the mean ± SD (n = 3). **, P-value < 0.01; ***, P-value < 0.001; Student's t-test. (c) Schematic illustration of the cellular experiments. Chemical inhibitor BEL was added to inhibit the phospholipase that converts PLs to LPLs, to inhibit the production of LPLs. Reduced LPL production may impair the protection of LPLs against α-syn aggregation. (d) Western blot and the analysis of α-syn in-cell pellets show a dose-dependent inhibition of intracellular α-syn aggregation by treating cells with LPC. Preformed α-syn fibril seeds were used to promote α-syn aggregation. Data represent the mean ± SD (n = 4). *, P-value < 0.05; ***, P-value < 0.001; Student's t-test. (e) Normalized intensity of total LPL amounts in the control cells and BEL-treated cells. The total amounts of LPLs were calculated using the sum of Z-score-normalized (x/standard deviation) intensity for each LPL. ***, P-value < 0.001; Student's t-test. (f) Heat map of the lipidomic profiling of BEL-treated cells. LPLs with a significant change in amount (q-value < 0.05) are presented and colored by Z-scores. The lipid species within each cluster are shown in the right column. pLPE is a 1Z-alkenyl ether (plasmalogen) substituent of LPE. aLPC is an alkyl ether substituent of LPC. Four biological replicates for each sample were measured. Student's t-test followed by FDR correction. (g) Western blot and the analysis of α-syn in-cell pellets show that in the presence of BEL, insoluble α-syn aggregates dramatically increased compared to those in the control. Data are shown as means ± SD (n = 4). **, P-value < 0.01; Student's t-test.

Similar articles

Cited by

References

    1. Goedert M, Spillantini MG, Del Tredici K et al. 100 years of Lewy pathology. Nat Rev Neurol 2013; 9: 13–24.10.1038/nrneurol.2012.242 - DOI - PubMed
    1. Lashuel HA, Overk CR, Oueslati A et al. The many faces of alpha-synuclein: from structure and toxicity to therapeutic target. Nat Rev Neurosci 2013; 14: 38–48.10.1038/nrn3406 - DOI - PMC - PubMed
    1. Paisán-Ruiz C, Li A, Schneider SA et al. Widespread Lewy body and tau accumulation in childhood and adult onset dystonia-parkinsonism cases with PLA2G6 mutations. Neurobiol Aging 2012; 33: 814–23.10.1016/j.neurobiolaging.2010.05.009 - DOI - PMC - PubMed
    1. Uversky V, Eliezer D. Biophysics of Parkinson's disease: structure and aggregation of alpha-synuclein. Curr Protein Pept Sci 2009; 10: 483–99.10.2174/138920309789351921 - DOI - PMC - PubMed
    1. Bartels T, Choi JG, Selkoe DJ. Alpha-synuclein occurs physiologically as a helically folded tetramer that resists aggregation. Nature 2011; 477: 107–10.10.1038/nature10324 - DOI - PMC - PubMed