. 2024 Jun 4;11(6):nwae188.
doi: 10.1093/nsr/nwae188. eCollection 2024 Jun.

A pan-TE map highlights transposable elements underlying domestication and agronomic traits in Asian rice

Affiliations

A pan-TE map highlights transposable elements underlying domestication and agronomic traits in Asian rice

Xiaoxia Li et al. Natl Sci Rev. .

Abstract

Transposable elements (TEs) are ubiquitous genomic components and hard to study due to being highly repetitive. Here we assembled 232 chromosome-level genomes based on long-read sequencing data. Coupling the 232 genomes with 15 existing assemblies, we developed a pan-TE map comprising both cultivated and wild Asian rice. We detected 177 084 high-quality TE variations and inferred their derived state using outgroups. We found TEs were one source of phenotypic variation during rice domestication and differentiation. We identified 1246 genes whose expression variation was associated with TEs but not single-nucleotide polymorphisms (SNPs), such as OsRbohB, and validated OsRbohB's relative expression activity using a dual-Luciferase (LUC) reporter assays system. Our pan-TE map allowed us to detect multiple novel loci associated with agronomic traits. Collectively, our findings highlight the contributions of TEs to domestication, differentiation and agronomic traits in rice, and there is massive potential for gene cloning and molecular breeding by the high-quality Asian pan-TE map we generated.

Keywords: pan-TE; rice; super pan-genome; transposable element.


Figures

Figure 1.
Figure 1.
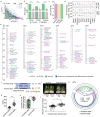
Construction of a pan-TE map and evaluation of TE variations in Asian accessions using chromosome-level genomes. (a) Landscape of genome size and TE content across different subpopulations. Phylogeny of 250 accessions were based on whole-genome SNPs (top); accessions in different subpopulations are indicated by different colors. Osi, Aus, Osj, Or and outgroup respectively refer to O. sativa indica, O. sativa aus, O. sativa japonica, O. rufipogon, and three non-Asian accessions (one O. glaberrima, one O. barthii and one O. glumaepatula). Length of genome and TE content (Mb) in each genome are indicated (bottom). The length of Gypsy, Copia, DTC, DTA, DTT, DTM, DTH, Helitron, LINE and SINE elements in each genome are indicated. (b) Overview of the pipeline for pan-TE map construction. Firstly, 232 high-quality chromosomal-level assemblies were de novo assembled by integrating public long-read and short-read data. After combining the de novo assemblies with 18 existing assemblies, the TE sequences were annotated and a TE library was generated. To construct a pan-TE map, the TE variations were identified by combing the results of genome alignment, the TE library and long-read data. Subsequently three non-Asian accessions were used as outgroups (henceforth ‘outgroup’) to infer whether a given TE variation was in derived state or ancestral state in each accession. A TE variation that has both derived state and ancestral state in Asian rice accessions was defined as derived TE variation (henceforth ‘dTE’). Ancestral state indicates that the genotype of the locus in a given accession (0/0) is the same as that of the outgroup (0/0); derived state indicates that the genotype of the locus in a given accession (1/1 or 0/1) is different from that of the outgroup (0/0), including homozygous (1/1) and heterozygous (0/1) genotype. Finally, a dTE genotype data set in matrix format is generated for use in downstream analysis, including domestication, gene expression and GWAS. (c) The copy number variation for different TE families in 250 natural accessions. The x axis represents the copy number variation for each TE family across accessions, evaluated as coefficient of variation (CV); the y axis represents the average number of TEs in each family; the z axis represents the differences in total TE number for each family among accessions in total TE number, evaluated as standard deviation (SD). (d) Pearson correlation coefficients for comparisons between total length of Gypsy elements and genome size across different subpopulations. Colored dots and lines indicate data from each subpopulation. (e) Length distributions of TE variations in the non-redundant TE data set for Asian accessions.
Figure 2.
Figure 2.
Inference and characterization of TE variations representing a derived state across Asian accessions. (a) The landscape of dTEs across the Asian accessions. Three non-Asian accessions were used as outgroups (henceforth termed ‘outgroup’) to infer whether a given TE variation was in derived state or ancestral state in each accession. The TE variations, which have both derived state and ancestral state in Asian rice accessions, were defined as derived TE variations (henceforth ‘dTEs’). Ancestral state indicates that the genotype of a TE variation in an accession is consistent with that of the outgroup; derived state indicates that the genotype of a TE variation, homozygous (left) or heterozygous (right), in an accession is different from that of the outgroup. NA indicate that the genotype is uncertain. Osi, Aus, Osj, Or and outgroup respectively refer to O. sativa indica, O. sativa aus, O. sativa japonica, O. rufipogon and three non-Asian accessions (O. glaberrima, O. barthii and O. glumaepatula). (b) Total length and number of non-redundant dTEs and sequences detected across different subpopulations. DEL and INS refer to deletion and insertion events identified by comparing the Asian accessions to the outgroups, respectively. ‘All’ refers to all the Asian rice accessions in the present study. (c) Average length and number of dTEs for each accession across different subpopulations. ***P < 0.001, significance was determined using the Student's t-test. (d) The count ratio of INS events to DEL events for different frequencies of dTEs in Asian rice accessions. (e) Total length and number of dTEs for TE families in Asian rice accessions. (f) A Helitron in the MYB61 promoter region was found in all Osj accessions in a previous study, but was undetectable in Or and Osi accessions and the rice outgroup genomes CC and EE. However, the Helitron inserted in some Or and Osi accessions in our high-quality Asian pan-TE map. (g) Distribution of the number of dTEs near each gene (within ±2 kb of a gene body). (h) Gene ontology (GO) analyses of the genes containing several dTEs (‘the genes’ were ranked by the number of dTEs overlapping with their genic region, and the top 5% of ranked genes were used in the GO analyses). BP, CC and MF respectively refer to biological process, cellular component and molecular function.
Figure 3.
Figure 3.
Contribution of dTEs to rice domestication and differentiation. (a) Pearson correlation coefficient between dTE average pairwise diversity (π) and recombination rate (ρ) across different subpopulations. (b) Comparisons of the average numbers of dTEs in the selective windows (i.e. ranked in top 5% of 100 kb FST windows for SNPs) and in windows randomly selected from each permutation for 500 independent permutations between subpopulations. (c) Number of dTEs showing signatures of selection (henceforth ‘selected dTEs’) between Or and Osi, Or and Osj, and Osi and Osj. FST outliers based on TE variations were indicated as loci showing signatures of selection. (d) Fold enrichment of selected dTEs in each TE family by the Fisher's exact test. Unknown refers to LTR/unknown family. (e) Positions of functional genes harboring selected dTEs in their genic regions on chromosomes 1–6. For chromosomes 7–12 see Fig. S3g. Genic regions included the gene body, regions of 2 kb upstream (henceforth ‘promoter’) and 2 kb downstream (henceforth ‘downstream’) of the gene body. Functional genes harboring selected dTEs in rice domestication and differentiation processes are displayed by different colored fonts. Differences in the gene expression between subpopulations were tested using the Student's t-test. ***P < 0.001, **P < 0.01 and * P < 0.05. (f) A 150 bp dTE (Tourist MITE) insertion occurred at 262 bp upstream of LIP19 in Osj accessions. (g–h) Differences in the expression level of LIP19 (g) and cold tolerance (h) between Osi accessions with the ancestral state (n = 131 and n = 122, respectively) and Osj accessions with the derived state (n = 58 and n = 54, respectively) of the 150 bp dTE INS. Significance was tested by the Student's t-test, ***P < 0.001. (i) Phenotypes of NH242 (an Osj accession) and NH181 (an Osi accession) under control (left) and cold stress treatments (right). For the cold stress treatment, 10-day-old seedlings were transferred to 4°C for 72 h and recovered for 4 days in a greenhouse at 30°C. (j) Differences in the absolute value of latitude of the accessions with this dTE INS (derived state) and those without this dTE INS (ancestral state) near LIP19. Significance was tested by the Wilcoxon-Mann-Whitney test, **P < 0.01. (k) Phylogenetic tree based on the sequence alignments of the promoter and gene body regions of LIP19 across all accessions in the present study. Accessions in different subpopulations are indicated by different colors.
Figure 4.
Figure 4.
TE variations associated with gene expression and agricultural traits. (a) The distribution of linkage disequilibrium values (LD, ) between dTEs and SNPs/InDels within 50 kb of the dTEs. For each dTE, the maximum with adjacent SNPs/InDels (within 50 kb on either side) was recorded. The dashed line indicates  = 0.70. (b) Percentage of dTEs overlapping with genic regions. Genic regions include gene body (CDS, 3’UTR, 5’UTR and intron), and the regions within 2 kb upstream (henceforth ‘promoter’) and 2 kb downstream (henceforth ‘downstream’) of the gene body. Unknown refers to LTR/unknown family. ‘All’ refers to the percentage of dTEs in the genic regions of all dTE loci identified in the present study, and ‘NIP’ refers to the percentage of TEs overlapping with genic regions in the Nipponbare genome. (c) Number of eGenes associated with dTE and SNP variants. eGenes are genes whose expression is significantly associated with dTE and SNP variants. (d) Manhattan plot of OsRbohB expression level and the dTE variants and SNPs (top). The leading dTE (328 bp) insertion (INS) associated with OsRbohB expression level is indicated (bottom). (e–f) Differences in the expression level of OsRbohB (e) and the thousand grain weight (f) between accessions with the ancestral state of the dTE INS event (n = 125 and n = 121, respectively) and those with the derived state (both n = 61). Significance was tested by the Student's t-test, ***P < 0.001. (g) Transcriptional activation assays by contransfecting rice protoplasts. Error bars represent the mean ± SD of three biological replicates. (h) GWAS for seed setting rate under cold stress using the TE and SNP data sets for the Os accessions. A locus on chromosome 6, which was identified by TEs but not by SNPs, was significantly associated with seed setting rate under cold stress. The triangles represent SNPs and dots represent dTEs. The most strongly associated dTE was a 1.0 kb dTE (Gypsy) deletion (DEL) event in the promoter of LOC_Os06g28970. (i and j) Comparison of seed setting rate under cold stress (i) and the expression level of LOC_Os06g28970 (j) between accessions with (i.e. derived state, n = 16 and n = 32, respectively) and without (i.e. ancestral state, n = 83 and n = 169, respectively) the dTE DEL event. Significance was tested by the Student's t-test, **P < 0.01, *P < 0.05.

Similar articles

Cited by

References

    1. Feschotte C, Jiang N, Wessler SR. Plant transposable elements: where genetics meets genomics. Nat Rev Genet 2002; 3: 329–41. 10.1038/nrg793 - DOI - PubMed
    1. Mc CB. Chromosome organization and genic expression. Cold Spring Harb Symp Quant Biol 1951; 16: 13–47. 10.1101/SQB.1951.016.01.004 - DOI - PubMed
    1. Wicker T, Sabot F, Hua-Van A et al. A unified classification system for eukaryotic transposable elements. Nat Rev Genet 2007; 8: 973–82. 10.1038/nrg2165 - DOI - PubMed
    1. Chénais B. Transposable elements and human diseases: mechanisms and implication in the response to environmental pollutants. Int J Mol Sci 2022; 23: 2551. 10.3390/ijms23052551 - DOI - PMC - PubMed
    1. Cai X, Lin R, Liang J et al. Transposable element insertion: a hidden major source of domesticated phenotypic variation in Brassica rapa. Plant Biotechnol J 2022; 20: 1298–310. 10.1111/pbi.13807 - DOI - PMC - PubMed