

Bioinformatics and systems biology approaches to identify potential common pathogeneses for sarcopenia and osteoarthritis
- PMID: 38962732
- PMCID: PMC11221828
- DOI: 10.3389/fmed.2024.1380210
Bioinformatics and systems biology approaches to identify potential common pathogeneses for sarcopenia and osteoarthritis
Abstract
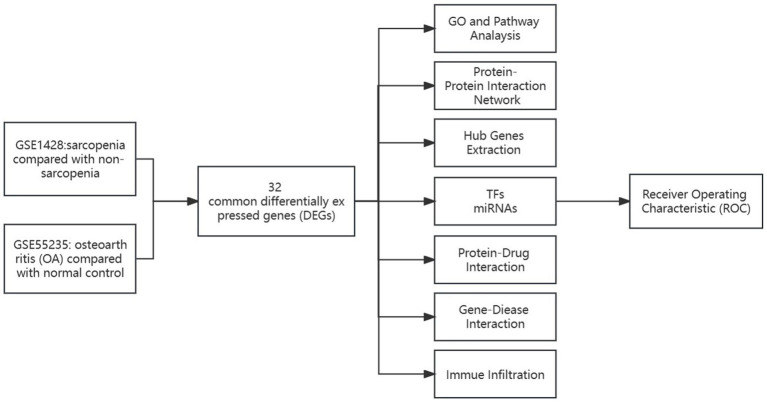
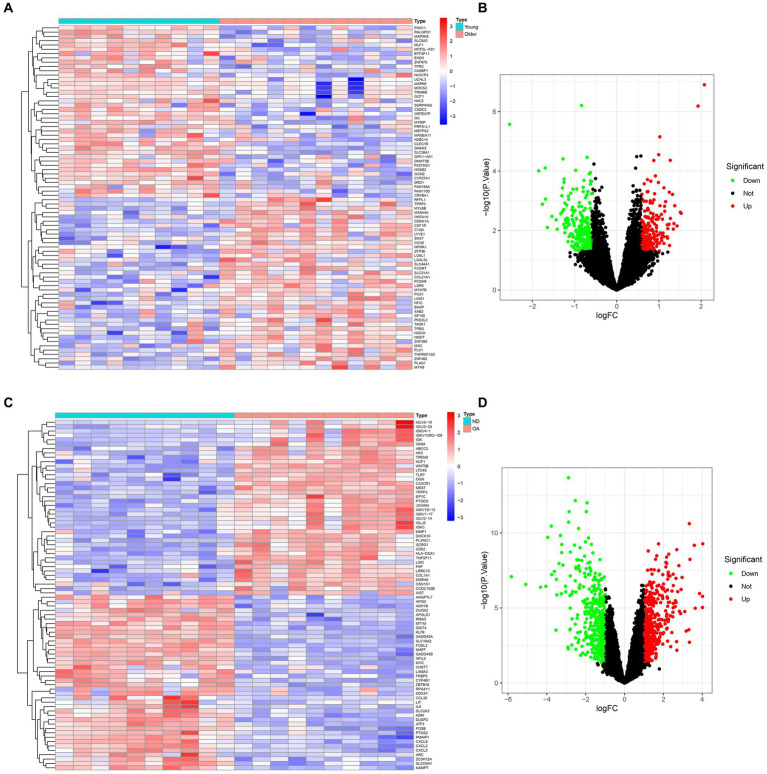
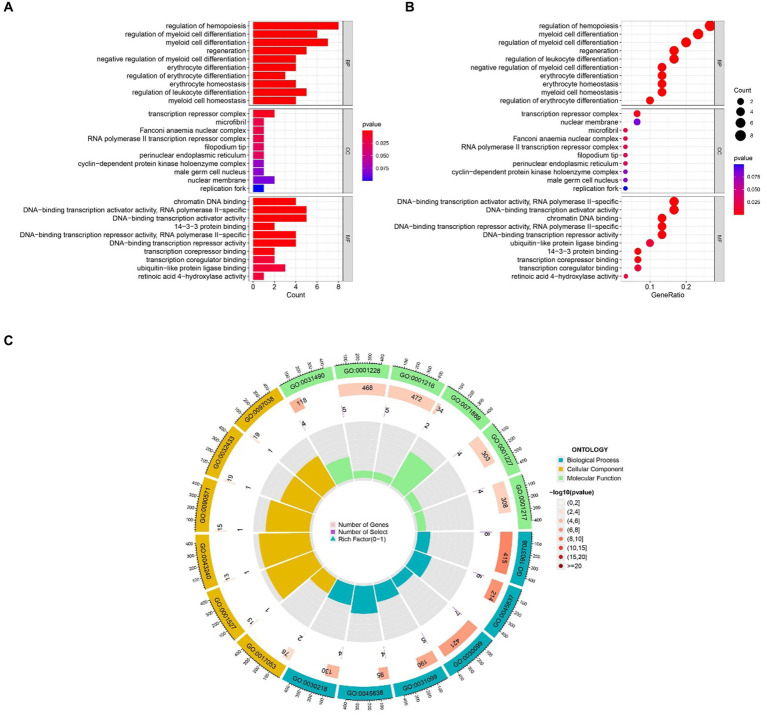
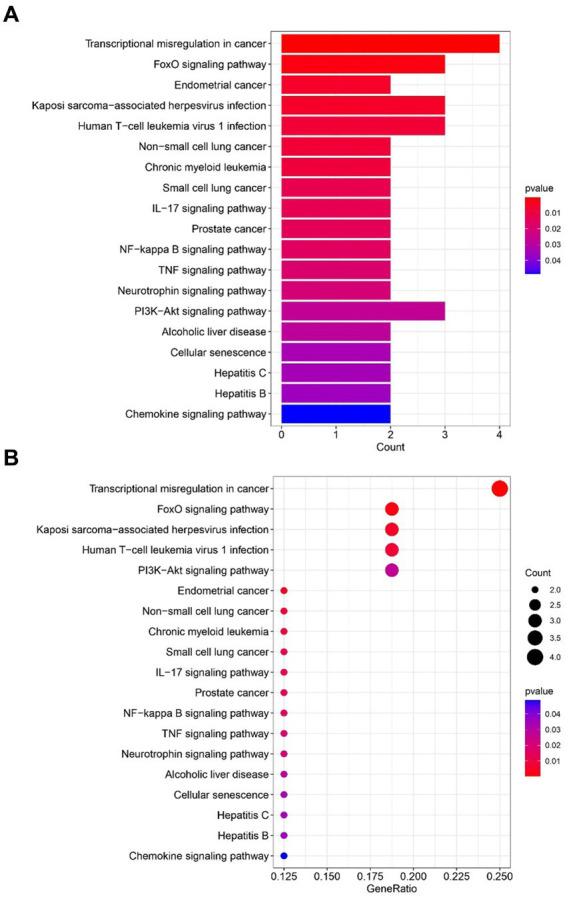
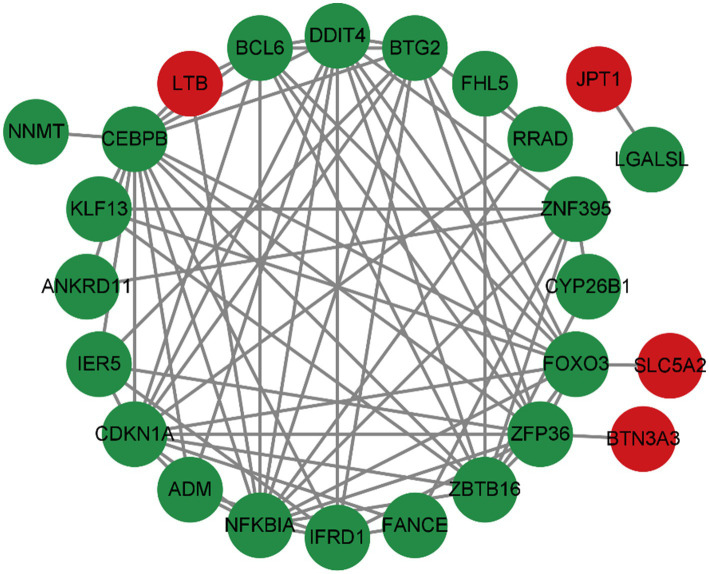
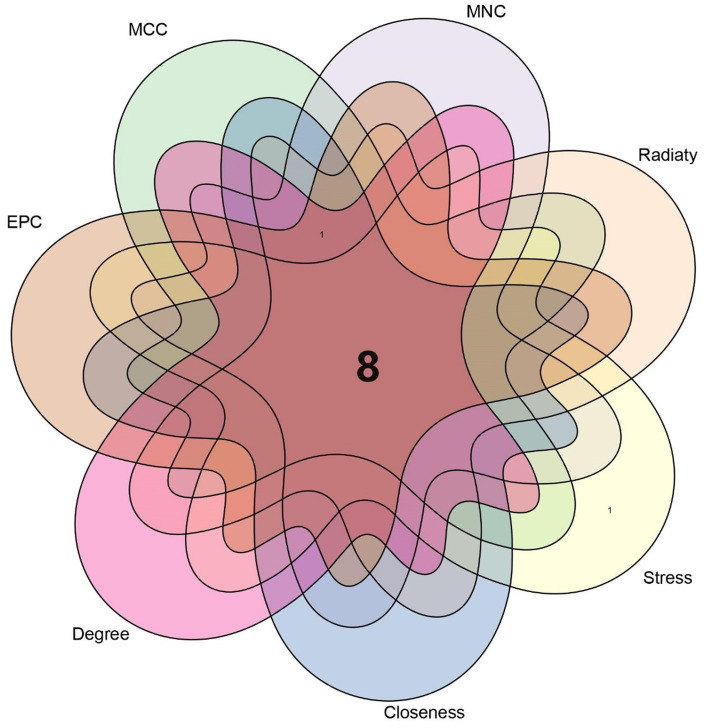
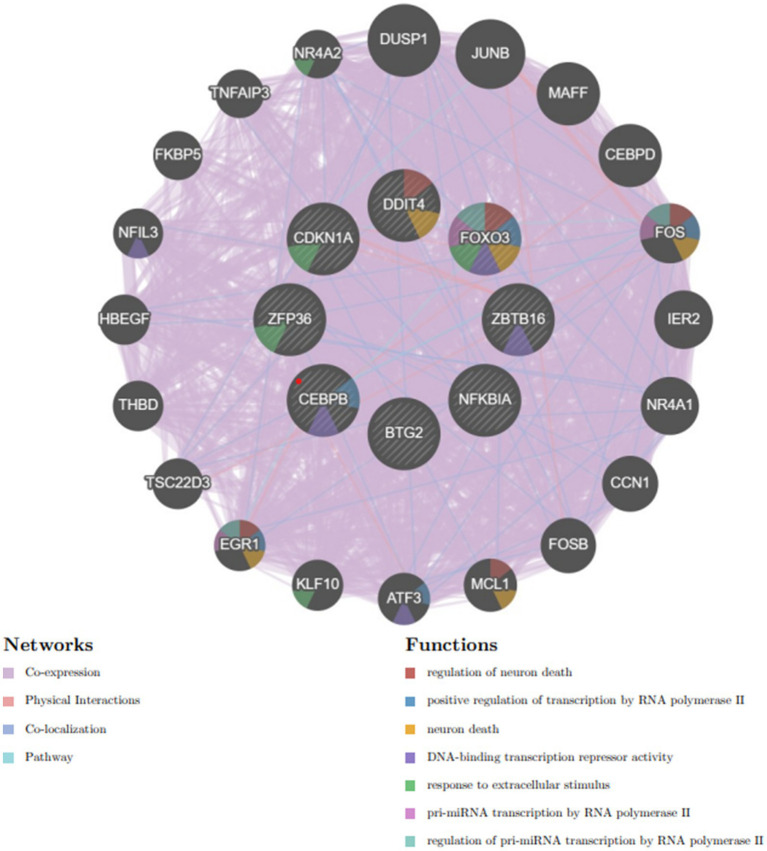
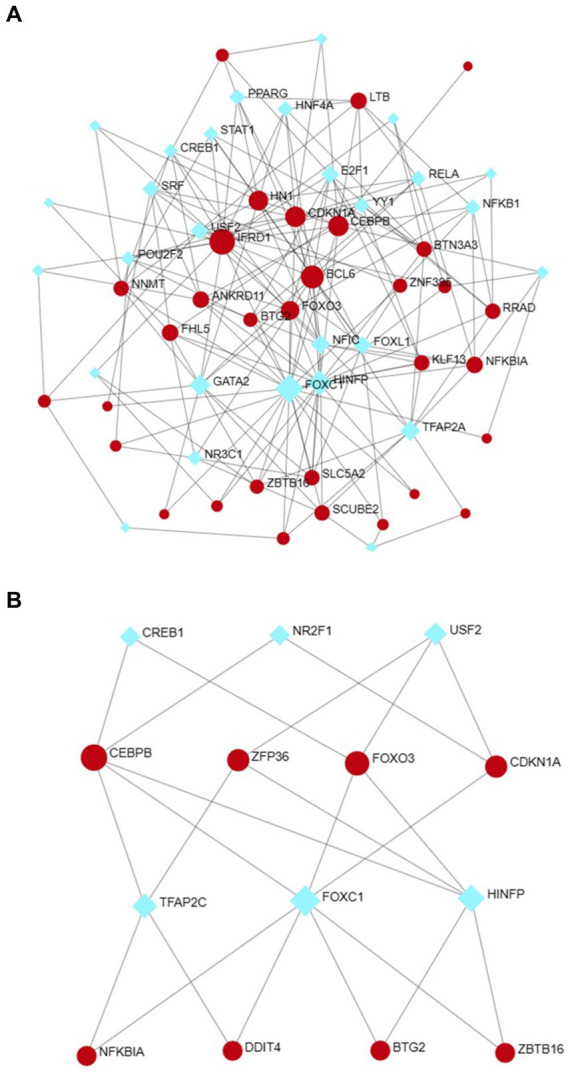
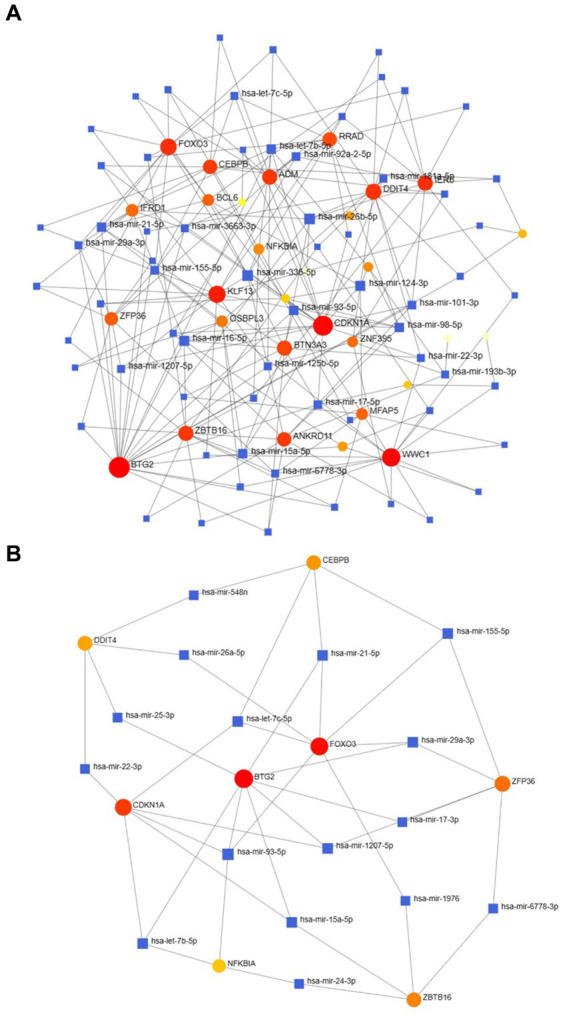
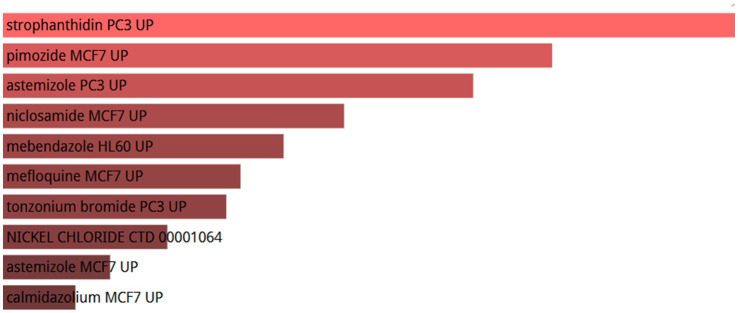
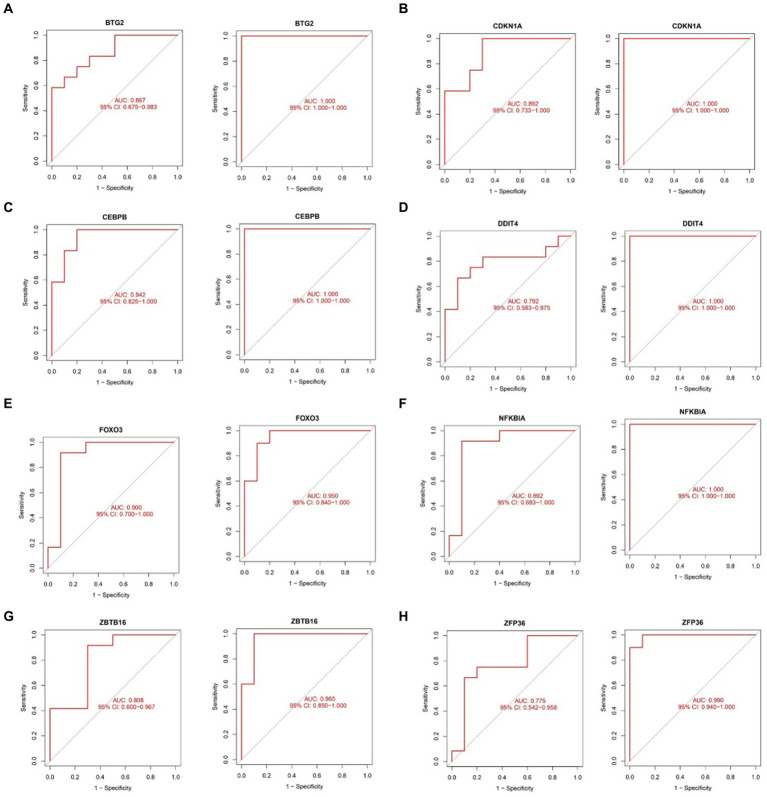
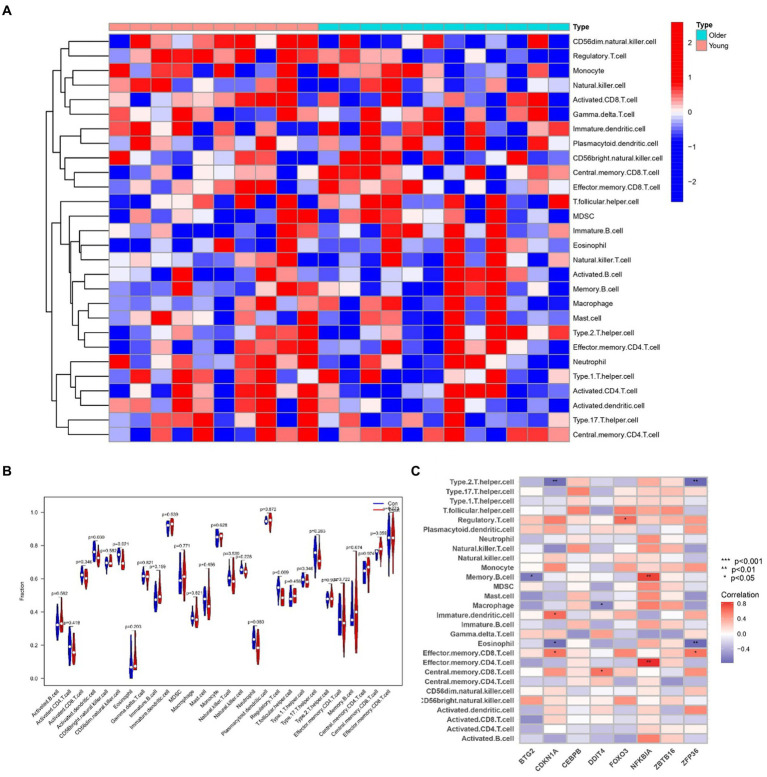
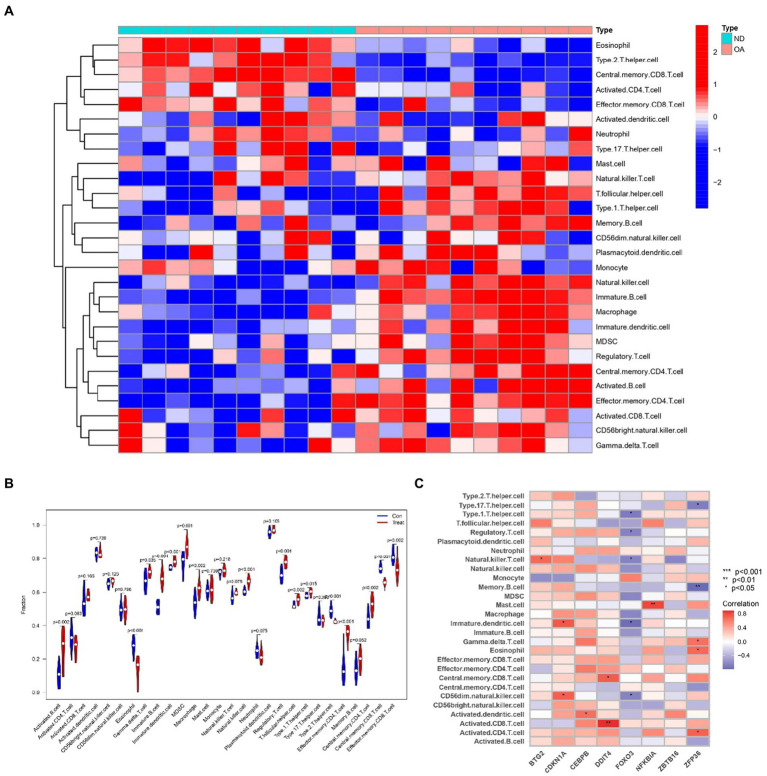
Sarcopenia, a geriatric syndrome characterized by progressive loss of muscle mass and strength, and osteoarthritis, a common degenerative joint disease, are both prevalent in elderly individuals. However, the relationship and molecular mechanisms underlying these two diseases have not been fully elucidated. In this study, we screened microarray data from the Gene Expression Omnibus to identify associations between sarcopenia and osteoarthritis. We employed multiple statistical methods and bioinformatics tools to analyze the shared DEGs (differentially expressed genes). Additionally, we identified 8 hub genes through functional enrichment analysis, protein-protein interaction analysis, transcription factor-gene interaction network analysis, and TF-miRNA coregulatory network analysis. We also discovered potential shared pathways between the two diseases, such as transcriptional misregulation in cancer, the FOXO signalling pathway, and endometrial cancer. Furthermore, based on common DEGs, we found that strophanthidin may be an optimal drug for treating sarcopenia and osteoarthritis, as indicated by the Drug Signatures database. Immune infiltration analysis was also performed on the sarcopenia and osteoarthritis datasets. Finally, receiver operating characteristic (ROC) curves were plotted to verify the reliability of our results. Our findings provide a theoretical foundation for future research on the potential common pathogenesis and molecular mechanisms of sarcopenia and osteoarthritis.
Keywords: bioinformatics; disease markers; hub genes; osteoarthritis; pathogenesis; sarcopenia.
Copyright © 2024 Yang, Zhong, Du, Wang, Jiang, Li and Liu.
Conflict of interest statement
The authors declare that the research was conducted in the absence of any commercial or financial relationships that could be construed as a potential conflict of interest.
Figures


Similar articles
-
Identification of the shared gene signatures and pathways between sarcopenia and type 2 diabetes mellitus.PLoS One. 2022 Mar 10;17(3):e0265221. doi: 10.1371/journal.pone.0265221. eCollection 2022. PLoS One. 2022. PMID: 35271662 Free PMC article.
-
Exploring molecular mechanisms underlying the pathophysiological association between knee osteoarthritis and sarcopenia.Osteoporos Sarcopenia. 2023 Sep;9(3):99-111. doi: 10.1016/j.afos.2023.08.005. Epub 2023 Sep 15. Osteoporos Sarcopenia. 2023. PMID: 37941536 Free PMC article.
-
Bioinformatics and system biology approach to identify potential common pathogenesis for COVID-19 infection and sarcopenia.Front Med (Lausanne). 2024 Jun 24;11:1378846. doi: 10.3389/fmed.2024.1378846. eCollection 2024. Front Med (Lausanne). 2024. PMID: 38978778 Free PMC article.
-
Bioinformatics and system biology approach to identify potential common pathogenesis for COVID-19 infection and osteoarthritis.Sci Rep. 2023 Jun 8;13(1):9330. doi: 10.1038/s41598-023-32555-y. Sci Rep. 2023. PMID: 37291167 Free PMC article.
-
Identification of shared gene signatures and pathways for diagnosing osteoporosis with sarcopenia through integrated bioinformatics analysis and machine learning.BMC Musculoskelet Disord. 2024 Jun 3;25(1):435. doi: 10.1186/s12891-024-07555-2. BMC Musculoskelet Disord. 2024. PMID: 38831425 Free PMC article.
References
-
- Mayhew AJ, Amog K, Phillips S, Parise G, McNicholas PD, de Souza RJ, et al. . The prevalence of sarcopenia in community-dwelling older adults, an exploration of differences between studies and within definitions: a systematic review and meta-analyses. Age Ageing. (2019) 48:48–56. doi: 10.1093/ageing/afy106, PMID: - DOI - PubMed
LinkOut - more resources
Full Text Sources
Miscellaneous