Emission characteristics and health effects of PM2.5 from vehicles in typical areas
- PMID: 38962775
- PMCID: PMC11220272
- DOI: 10.3389/fpubh.2024.1326659
Emission characteristics and health effects of PM2.5 from vehicles in typical areas
Abstract
Introduction: Vehicle emissions have become an important source of urban air pollution, and the assessment of air pollution emission characteristics and health effects caused by specific pollution sources can provide scientific basis for air quality management.
Methods: In this paper, vehicle PM2.5 pollution in typical urban agglomerations of China (the Beijing-Tianjin-Hebei urban agglomeration (BTHUA), the triangle of the Central China urban agglomeration (TCCUA) and the Chengdu-Chongqing urban agglomeration (CCUA)) were used as research samples to evaluate the emission characteristics, health effects and economic losses of vehicle PM2.5 pollution based on the emission inventory, air quality model and exposure-response function from 2010 to 2020.
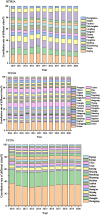
Results: The results indicated that PM2.5 emissions from vehicles in the three urban agglomerations during 2010-2020 first showed an upward yearly trend and then showed a slow decrease in recent years. Heavy-duty trucks and buses are the main contribution vehicles of PM2.5, and the contribution rates of light-duty vehicles to PM2.5 is increasing year by year. The contribution rate of PM2.5 in Beijing decreased significantly. In addition to capital cities and municipalities directly under the central Government, the emission of pollutants in other cities cannot be ignored. The evaluation results of the impact of PM2.5 pollution from vehicles on population health show that: the number of each health endpoint caused by PM2.5 pollution from vehicles in the BTHUA and CCUA showed an overall upward trend, while the TCCUA showed a downward trend in recent years. Among them, PM2.5 pollution from vehicles in the three major urban agglomerations cause about 78,200 (95% CI: 20,500-138,800) premature deaths, 122,800 (95% CI: 25,600-220,500) inpatients, and 628,400 (95% CI: 307,400-930,400) outpatients and 1,332,400 (95% CI: 482,700-2,075,600) illness in 2020. The total health economic losses caused by PM2.5 pollution from vehicles in the three major urban agglomerations in 2010, 2015 and 2020 were 68.25 billion yuan (95% CI: 21.65-109.16), 206.33 billion yuan (95% CI: 66.20-326.20) and 300.73 billion yuan (95% CI: 96.79-473.16), accounting for 0.67% (95% CI: 0.21-1.07%), 1.19% (95% CI: 0.38%-1.88%) and 1.21% (95% CI: 0.39%-1.90%) of the total GDP of these cities.
Discussion: Due to the differences in vehicle population, PM2.5 concentration, population number and economic value of health terminal units, there are differences in health effects and economic losses among different cities in different regions. Among them, the problems of health risks and economic losses were relatively prominent in Beijing, Chengdu, Chongqing, Tianjin and Wuhan.
Keywords: PM2.5; economic loss; health risk; typical urban agglomerations; vehicular pollution.
Copyright © 2024 Song and Hao.
Conflict of interest statement
The authors declare that the research was conducted in the absence of any commercial or financial relationships that could be construed as a potential conflict of interest.
Figures


Similar articles
-
[Health Impact Analysis of Fine Particulate Pollution from Vehicles in the Beijing-Tianjin-Hebei Region].Huan Jing Ke Xue. 2023 Dec 8;44(12):6610-6620. doi: 10.13227/j.hjkx.202302096. Huan Jing Ke Xue. 2023. PMID: 38098388 Chinese.
-
[An Assessment of PM2.5-Related Health Risks and Associated Economic Losses in Chinese Cities].Huan Jing Ke Xue. 2018 Aug 8;39(8):3467-3475. doi: 10.13227/j.hjkx.201711237. Huan Jing Ke Xue. 2018. PMID: 29998650 Chinese.
-
[Spatiotemporal Distribution Characteristics of Air Pollution and Health Risks in Key Cities of China].Huan Jing Ke Xue. 2023 Nov 8;44(11):5954-5963. doi: 10.13227/j.hjkx.202210266. Huan Jing Ke Xue. 2023. PMID: 37973080 Chinese.
-
Characteristics of Major Air Pollutants in China.Adv Exp Med Biol. 2017;1017:7-26. doi: 10.1007/978-981-10-5657-4_2. Adv Exp Med Biol. 2017. PMID: 29177957 Review.
-
Emission control status and future perspectives of diesel trucks in China.J Environ Sci (China). 2025 Feb;148:702-713. doi: 10.1016/j.jes.2023.06.010. Epub 2023 Jun 13. J Environ Sci (China). 2025. PMID: 39095202 Review.
References
-
- Hao H, Wang H, Ouyang M, Cheng F. Vehicle survival patterns in China. Sci China Technol Sci. (2011) 54:625–9. doi: 10.1007/s11431-010-4256-1, (In Chinese) - DOI
-
- Sun SD, Zhao G, Wang T, Jin J, Wang P, Lin Y, et al. . Past and future trends of vehicle emissions in Tianjin, China, from 2000 to 2030. Atmos Environ. (2019) 209:182–91. doi: 10.1016/j.atmosenv.2019.04.016 - DOI
-
- Zhao X, Doering OC, Tyner WE. The economic competitiveness and emissions of battery electric vehicles in China. Appl Energy. (2015) 156:666–75. doi: 10.1016/j.apenergy.2015.07.063 - DOI
MeSH terms
Substances
LinkOut - more resources
Full Text Sources
Medical

