

Geospatial pattern of level of minimum acceptable diet and its determinants among children aged 6-23 months in Ethiopia. Spatial and multiscale geographically weighted regression analysis
- PMID: 38962777
- PMCID: PMC11221355
- DOI: 10.3389/fpubh.2024.1348755
Geospatial pattern of level of minimum acceptable diet and its determinants among children aged 6-23 months in Ethiopia. Spatial and multiscale geographically weighted regression analysis
Abstract
Background: Despite prior progress and the proven benefits of optimal feeding practices, improving child dietary intake in developing countries like Ethiopia remains challenging. In Ethiopia, over 89% of children fail to meet the minimum acceptable diet. Understanding the geographical disparity and determinants of minimum acceptable diet can enhance child feeding practices, promoting optimal child growth.
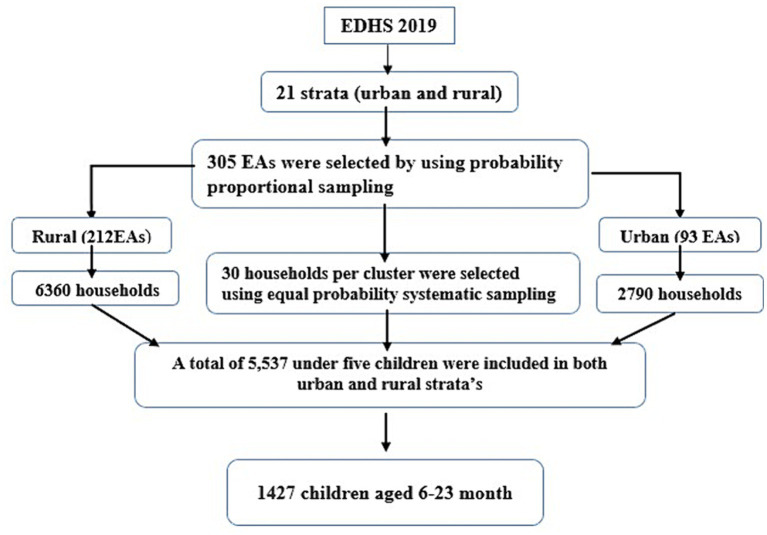
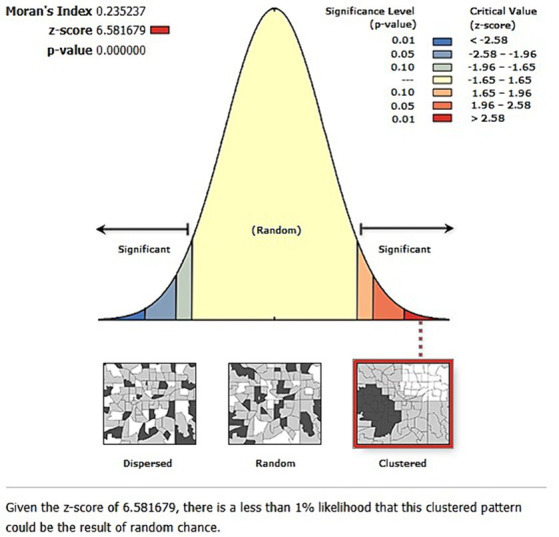
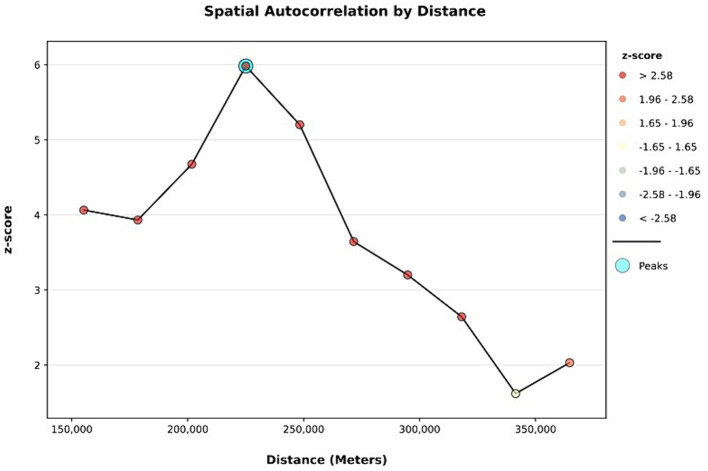
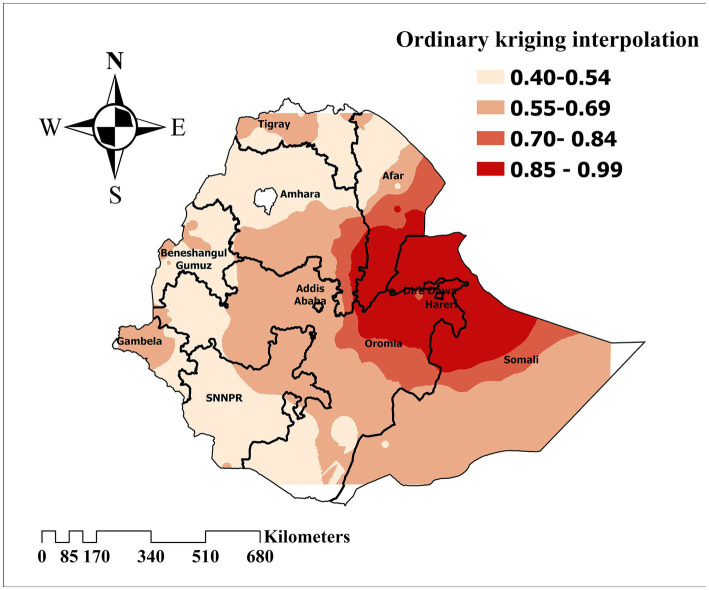
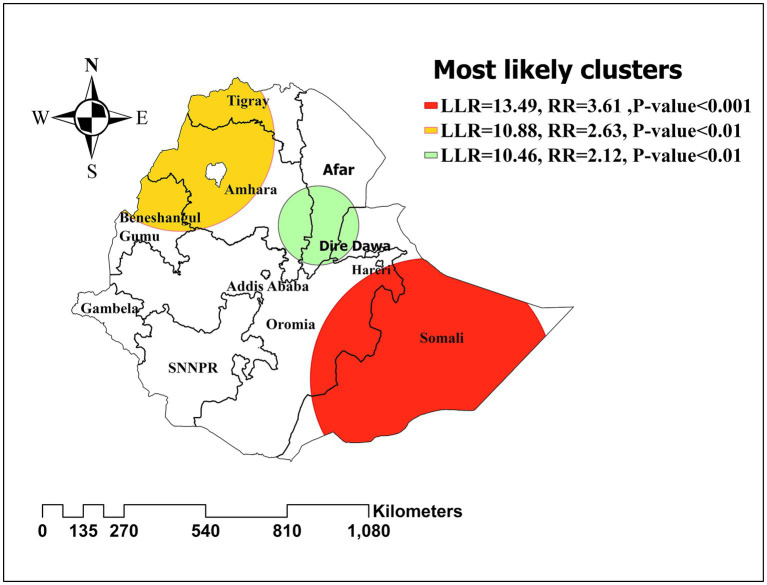
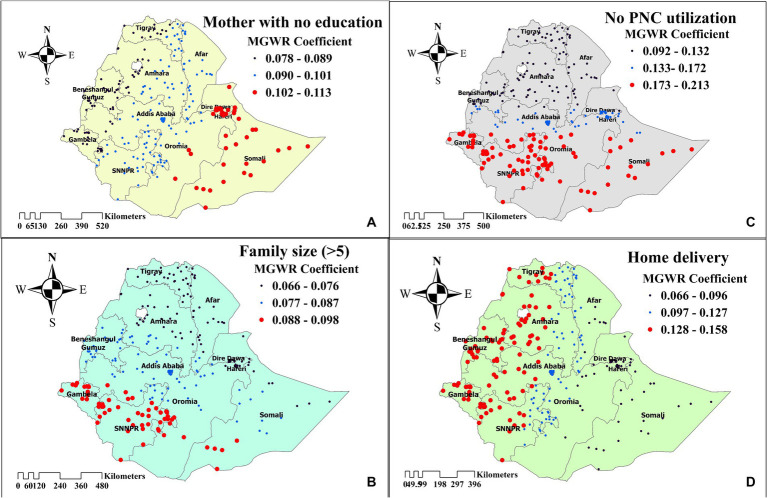
Methods: Spatial and multiscale geographically weighted regression analysis was conducted among 1,427 weighted sample children aged 6-23 months. ArcGIS Pro and SatScan version 9.6 were used to map the visual presentation of geographical distribution failed to achieve the minimum acceptable diet. A multiscale geographically weighted regression analysis was done to identify significant determinants of level of minimum acceptable diet. The statistical significance was declared at P-value <0.05.
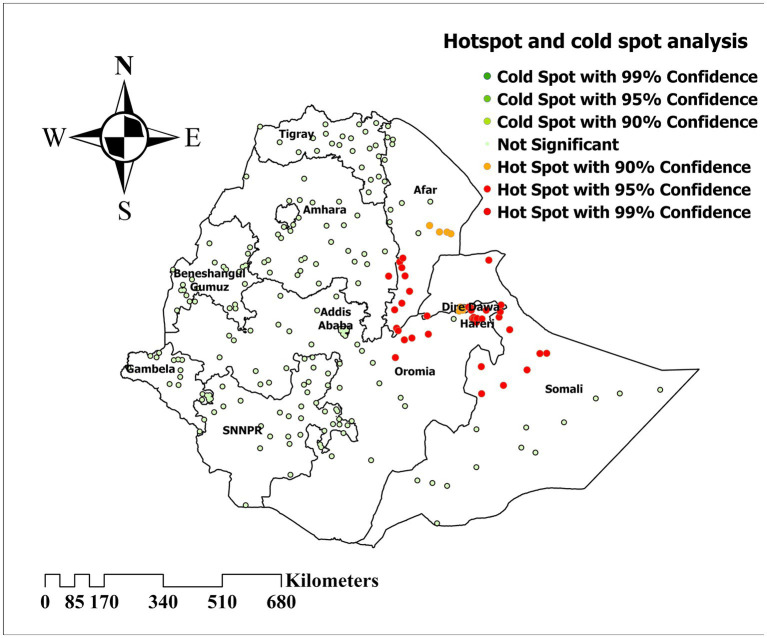
Results: Overall, 89.56% (95CI: 87.85-91.10%) of children aged 6-23 months failed to achieve the recommended minimum acceptable diet. Significant spatial clustering was detected in the Somali, Afar regions, and northwestern Ethiopia. Children living in primary clusters were 3.6 times more likely to be unable to achieve the minimum acceptable diet (RR = 3.61, LLR =13.49, p < 0.001). Mother's with no formal education (Mean = 0.043, p-value = 0.000), family size above five (Mean = 0.076, p-value = 0.005), No media access (Mean = 0.059, p-value = 0.030), home delivery (Mean = 0.078, p-value = 0.002), and no postnatal checkup (Mean = 0.131, p-value = 0.000) were found to be spatially significant determinants of Inadequate minimum acceptable diet.
Conclusion: Level of minimum acceptable diet among children in Ethiopia varies geographically. Therefore, to improve child feeding practices in Ethiopia, it is highly recommended to deploy additional resources to high-need areas and implement programs that enhance women's education, maternal healthcare access, family planning, and media engagement.
Keywords: Ethiopia; children; determinants; geospatial pattern; minimum acceptable diet.
Copyright © 2024 Kitaw, Abate, Derese Tilahun and Haile.
Conflict of interest statement
The authors declare that the research was conducted in the absence of any commercial or financial relationships that could be construed as a potential conflict of interest.
Figures
References
-
- World Health Organization . Indicators for assessing infant and young child feeding practices: Part 2: measurement. Geneve, Switzerland: World Health Organization. (2010).
-
- World Health Organization . Infant and young child feeding. Nutrition. (2011) 89:11–3.
-
- Das JK, Salam RA, Imdad A, Bhutta ZA. Infant and young child growth In: Reproductive, maternal, newborn, and child Health. Toronto, Canada (2016). 225.
-
- WHO U, USAID A, AED U . Indicators for assessing infant and young child feeding practices. Geneva: World Health Organization; (2008).
MeSH terms
LinkOut - more resources
Full Text Sources