. 2024 Aug;11(32):e2404937.
doi: 10.1002/advs.202404937. Epub 2024 Jul 4.

A Lipid-Sensitive Spider Peptide Toxin Exhibits Selective Anti-Leukemia Efficacy through Multimodal Mechanisms

Affiliations

A Lipid-Sensitive Spider Peptide Toxin Exhibits Selective Anti-Leukemia Efficacy through Multimodal Mechanisms

Peng Zhang et al. Adv Sci (Weinh). 2024 Aug.

Abstract

Anti-cancer peptides (ACPs) represent a promising potential for cancer treatment, although their mechanisms need to be further elucidated to improve their application in cancer therapy. Lycosin-I, a linear amphipathic peptide isolated from the venom of Lycosa singorensis, shows significant anticancer potential. Herein, it is found that Lycosin-I, which can self-assemble into a nanosphere structure, has a multimodal mechanism of action involving lipid binding for the selective and effective treatment of leukemia. Mechanistically, Lycosin-I selectively binds to the K562 cell membrane, likely due to its preferential interaction with negatively charged phosphatidylserine, and rapidly triggers membrane lysis, particularly at high concentrations. In addition, Lycosin-I induces apoptosis, cell cycle arrest in the G1 phase and ferroptosis in K562 cells by suppressing the PI3K-AKT-mTOR signaling pathway and activating cell autophagy at low concentrations. Furthermore, intraperitoneal injection of Lycosin-I inhibits tumor growth of K562 cells in a nude mouse xenograft model without causing side effects. Collectively, the multimodal effect of Lycosin-I can provide new insights into the mechanism of ACPs, and Lycosin-I, which is characterized by high potency and specificity, can be a promising lead for the development of anti-leukemia drugs.

Keywords: PI3K‐AKT‐mTOR signaling pathway; anticancer peptide; apoptosis; cell cycle arrest; ferroptosis; leukemia.


Conflict of interest statement

The authors declare no conflict of interest.

Figures

Figure 1
Figure 1
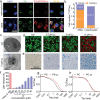
Lycosin‐I exhibits a potent and selective cytotoxic activity against leukemia cells through a lipid‐sensitive conformational transition. a) Chemical structures of the peptide Lycosin‐I. b) The computer simulation of the secondary structure model of Lycosin‐I predicted by the pymol‐open‐source. c) CD spectra of Lycosin‐I (50 µm) in PBS (7.4). d) CD spectra of Lycosin‐I (50 µm) in POPC/POPS (3:1). e,f) TEM (e) and AFM (f) images of the assemblies of 100 µM Lycosin‐I. g) Hemolytic activity of Lycosin‐I against human erythrocytes. h) The IC50 values of Lycosin‐I for the solid tumor cell lines MDA‐MB‐231, MCF‐7, A549, HCT116, HT‐29, and SW480, for human leukemia cell lines (MV4;11, HL‐60, and U937), and for non‐cancer cell lines (HUVEC, HBE, and HEK293T cells) were determined by CCK‐8 assay. i) The dose‐dependent response of Lycosin‐I to K562 cells and isolated normal human lymphocytes. Values are expressed as mean ± S.E.M.; n = 6 for each group.
Figure 2
Figure 2
The ability of Lycosin‐I to bind cell membranes and its activity to rapidly destroy them. a) The distribution of Lycosin‐I in K562 cells or isolated lymphocytes was examined by confocal laser scanning microscopy. Cells were treated with Cy5‐ly at 2.5 µm for 1 h. b) Quantitative fluorescence analysis was performed based on the data from (a). c) TEM images of K562 cells after treatment with 10 µm Lycosin‐I for 1 h. d,e) SYTO9/PI double staining (d) and trypan blue staining (e) after K562 cells were treated with 2.5, 5, and 10 µm Lycosin‐I for 1 h, respectively. f) Measurement of LDH leakage after K562 cells were treated with Lycosin‐I at different concentrations for 1 h. PBS and Triton X‐100 represent the negative and positive controls, respectively. Representative normalized autocorrelation curves for Dil‐labeled phosphatidylserine (PS) liposomes g) in the absence (black) and presence (red) of Lycosin‐I and Dil‐labeled PC liposomes h) in the absence (black) and presence (red) of Lycosin‐I, respectively. G (Tau): magnitude of auto‐correlation. It was calculated as described in the Methods section. Values in Figure 2f are presented as mean ± S.E.M.; n = 6 for each group.
Figure 3
Figure 3
Lycosin‐I induces apoptosis and cell cycle arrest in K562 cells. a) Apoptosis analysis of K562 cells treated with 5 µm Lycosin‐I for 24 h followed by staining with Annexin‐V/PI. b) Cell cycle analysis of K562 cells treated with 5 µm Lycosin‐I for 24 h by flow cytometry. c) Fluorescence images of MMP staining with JC‐1 in K562 cells in the absence or presence of 5 µm Lycosin‐I for 24 h. d,e) The expression of apoptosis‐related proteins BAX, BCL‐2, Caspase‐3, and Cleaved Caspase‐3 (d), and cell cycle‐related proteins p53, p27, p21, cyclin D1, and cyclin E1 (e) in K562 cells treated with 5 µm Lycosin‐I for 24 h. Quantification of proteins (as in Figure S12, Supporting Information) is normalized to β‐actin with respect to the control group (n = 3; mean ± S.E.M.) using t‐test, *p < 0.05; **p < 0.01.
Figure 4
Figure 4
Lycosin‐I induces ferroptosis in K562 cells. a) Representative fluorescence images of ROS levels in K562 cells treated with 5 µM Lycosin‐I for 24 h. Rosup was used as positive control. Scale bar, 50 µm. c) Representative fluorescence images of lipid ROS levels in K562 cells treated with 5 µm Lycosin‐I for 24 h. Scale bar, 50 µm. b–e) Quantitative analysis of ROS contents (b), lipid ROS level (d) and ferrous ion concentration (e) determined using a multifunctional fluorescence microplate reader. f) The cytotoxicity of Lycosin‐I on K562 cells with and without the presence of the ferroptosis inhibitors DFO and Fer‐1. g,h) Representative TEM images of mitochondria in K562 cells. Cells were treated with 5 µm Lycosin‐I for 24 h. i–k) The expression of GPX4 (i), TFRC (j) and FTH protein (k) in K562 cells treated with 5 µm Lycosin‐I for 24 h. Data are presented as mean ± S.E.M., n = 6 for each group. Statistical analysis was performed with a t‐test for d and e and with a one‐way ANOVA test for b and f. *p < 0.01; ***p < 0.001. Quantification of proteins (as in the Figure S14, Supporting Information) was normalized to β‐actin relative to the control group (n = 3; mean ± S.E.M.) using the t‐test, *p < 0.05; **p < 0.01.
Figure 5
Figure 5
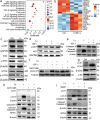
Lycosin‐I triggers apoptosis, autophagy, cell cycle arrest, and ferroptosis of K562 cells via the PI3K‐AKT‐mTOR signaling pathway. a) The KEGG signaling pathway enrichment analysis based on the differentially expressed genes in K562 cells treated with 5 µm Lycosin‐I. b) Cluster heatmap of the expression differences of genes regulating cell survival‐related signaling pathways as mentioned in Figure 5a. c–i) Western blotting analysis of the proteins indicated in K562 cells treated with 5 µm Lycosin‐I and some pharmacological agents for 24 h. c) Lycosin‐I decreases the phosphorylation of PI3K, AKT and mTOR proteins. d,e) The AKT activator IGF (200 ng mL−1) reverses the inhibition of AKT phosphorylation d) and the cleavage of Caspase‐3 (e) by Lycosin‐I. f) The mTOR activator MHY1485 (1 µm) or IGF (200 ng mL−1) reverses the down‐regulation of Cyclin D1 by Lycosin‐I. g) Lycosin‐I improves the ratio of LC3‐II to LC3‐I proteins and decreases the expression of p62. h,i) MHY1485 (1 µm) (h) or the autophagy inhibitor BafA1(40 nm) (i) suppresses Lycosin‐I‐induced autophagy and prevents apoptosis and ferroptosis. Quantification of proteins (as shown in the Figures S18 and S19, Supporting Information) is normalized to the internal control with respect to the control group (n = 3; mean ± S.E.M) using t‐test or one‐way ANOVA test; *p < 0.05; **p < 0.01; ***p < 0.01.
Figure 6
Figure 6
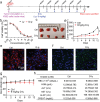
In vivo antitumor activity and safety evaluation of Lycosin‐I. a) Schematic illustration of the schedule for the in vivo therapeutic experiments. Treatments were administered via intraperitoneal injection every other day for a total of 6 times. b) Cell viability of Lycosin‐I and D‐Lycosin‐I on K562 cell lines was examined using the CCK‐8 assay. Cells were incubated with various concentrations of the peptides for 24 h. c) Growth curves of K562 tumor formation. d) Images of excised K562 tumors in nude mice (n = 4). e) Analysis of GPX4 expression in tumor of control and D‐Lycosin‐I treatment groups. f) Analysis of cleaved‐Caspase‐3 expression in the tumor of the control and D‐Lycosin‐I treatment groups. g) Changes in body weight of BALB/c mice during the study. h) Data from RBC parameters, and liver and kidney function tests, of mice treated with PBS or D‐Lycosin‐I for 12 days. HGB, hemoglobin; ALT, alanine aminotransferase; AST, aspartate aminotransferase; ALKP, alkaline phosphatase; Creat, creatinine. Data are expressed as mean ± S.E.M., n = 4 for each group. Statistical analysis was performed using the t‐test. *p < 0.01; **p < 0.01.
Scheme 1
Scheme 1
Illustrates the multimodal mechanism of the lipid‐sensitive peptide Lycosin‐I, which acts selectively against leukemia. For the sake of simplicity, Lycosin‐I is abbreviated as Ly in all figures in this study. Lycosin‐I, which was isolated from the venom of Lycosa singorensis, has the ability to self‐assemble into nanosphere structures. Upon binding to phospholipids, Lycosin‐I undergoes a conformational change from a random coil to a helix, resulting in a potent inhibitory effect on leukemia cells via a multimodal mechanism. 1) Rapid membrane lysis at high concentration. 2) Induction of cell apoptosis: Lycosin‐I activates the mitochondria‐mediated apoptotic pathway, which ultimately leads to Caspase‐3 cleavage and cell apoptosis. 3) Induction of cell cycle arrest in G1 phase: Lycosin‐I upregulates the expression of p53, p27, and p21 while inhibits cyclin D and E, leading to cell cycle arrest in the G1 phase. 4) Induction of ferroptosis of cells: Lycosin‐I increases the expression of transferrin, enhances intracellular Fe2+ levels, and decreases the expression of GPX4, leading to disruption of iron homeostasis and lipid peroxidation,eventually inducing ferroptosis. Of course, ferroptosis also can ultimatelycause the cell membrane lysis. 5) Activation of cell autophagy: Lycosin‐l increases the LC3‐II/LC3‐I ratio and reduces the expression of p62, leading to activation of autophagy and further promoting cell apoptosis and ferroptosis. Most importantly, apoptosis, cell cycle arrest, and ferroptosis appear to be regulated by the Pl3K‐AKT‐mTOR signaling pathway. The graphics of Scheme 1 and ToC were created and licensed by MedPeer (medpeer.cn).

Similar articles

Cited by

References

    1. Siegel R. L., Miller K. D., Fuchs H. E., Jemal A., CA: Cancer J. Clin. 2021, 71, 7. - PubMed
    1. Greaves M., Nat. Rev. Cancer 2016, 16, 163. - PubMed
    1. Marks D. I., Rowntree C., Blood 2017, 129, 1134. - PubMed
    1. Evangelisti C., Chiarini F., McCubrey J. A., Martelli A. M., Int. J. Mol. Sci. 2018, 19, 1878. - PMC - PubMed
    1. Hamdi A., Mawad R., Bassett R., di Stasi A., Ferro R., Afrough A., Ram R., Dabaja B., Rondon G., Champlin R., Sandmaier B. M., Doney K., Bar M., Kebriaei P., Biol. Blood Marrow Transplant. 2014, 20, 1767. - PMC - PubMed

LinkOut - more resources