

Association of Autoantibody Concentrations and Trajectories With Lupus Nephritis Histologic Features and Treatment Response
- PMID: 38962936
- PMCID: PMC11521769
- DOI: 10.1002/art.42941
Association of Autoantibody Concentrations and Trajectories With Lupus Nephritis Histologic Features and Treatment Response
Abstract
Objective: Autoantibodies are a hallmark of lupus nephritis (LN), but their association with LN classes and treatment response are not adequately known. In this study, we quantified circulating autoantibodies in the Accelerating Medicines Partnership LN longitudinal cohort to identify serological biomarkers of LN histologic classification and treatment response and how these biomarkers change over time based on treatment response.
Methods: Peripheral blood samples were collected from 279 patients with systemic lupus erythematosus undergoing diagnostic kidney biopsy based on proteinuria. Of these, 268 were diagnosed with LN. Thirteen autoantibody specificities were measured by bead-based assays (Bio-Rad Bioplex 2200) and anti-C1q by enzyme-linked immunosorbent assay at the time of biopsy (baseline) and at 3, 6, and 12 months after biopsy. Clinical response was determined at 12 months.
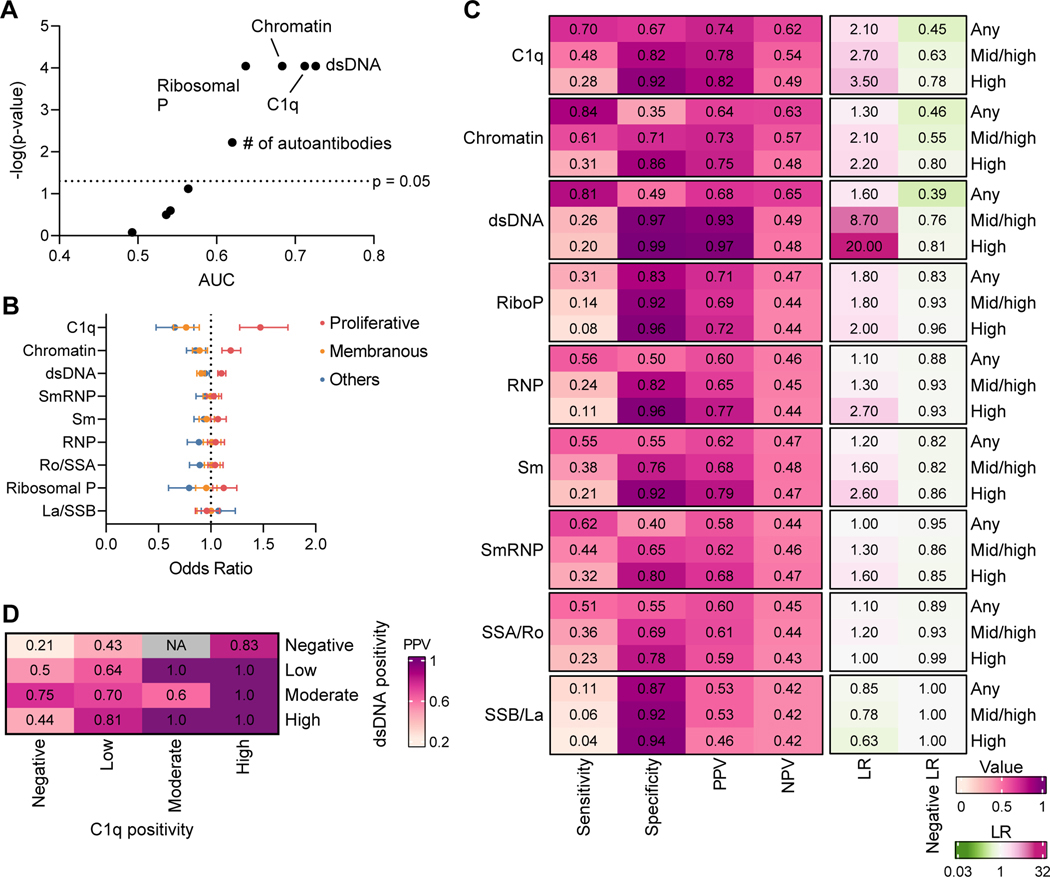
Results: Proliferative LN (International Society of Nephrology/Renal Pathology Society class III/IV±V, n = 160) was associated with higher concentrations of anti-C1q, anti-chromatin, anti-double-stranded DNA (dsDNA), and anti-ribosomal P autoantibodies compared to nonproliferative LN (classes I/II/V/VI, n = 108). Anti-C1q and-dsDNA were independently associated with proliferative LN. In proliferative LN, higher baseline anti-C1q levels predicted complete response (area under the curve [AUC] 0.72; P = 0.002) better than baseline proteinuria (AUC 0.59; P = 0.21). Furthermore, all autoantibody levels except for anti-La/SSB decreased over 12 months in patients with proliferative, but not membranous, LN with a complete response.
Conclusion: Baseline levels of anti-C1q and anti-dsDNA may serve as noninvasive biomarkers of proliferative LN, and anti-C1q may predict complete response at the time of kidney biopsy. In addition, tracking autoantibodies over time may provide further insights into treatment response and pathogenic mechanisms in patients with proliferative LN.
© 2024 The Author(s). Arthritis & Rheumatology published by Wiley Periodicals LLC on behalf of American College of Rheumatology.
Figures


References
-
- Weening JJ, D’Agati VD, Schwartz MM, Seshan SV, Alpers CE, Appel GB, Balow JE, Bruijn JA, Cook T, Ferrario F, Fogo AB, Ginzler EM, Hebert L, Hill G, Hill P, Jennette JC, Kong NC, Lesavre P, Lockshin M, Looi LM, Makino H, Moura LA, Nagata M. The classification of glomerulonephritis in systemic lupus erythematosus revisited. J Am Soc Nephrol. 2004;15(2):241–50. Epub 2004/01/30. doi: 10.1097/01.asn.0000108969.21691.5d. PubMed PMID: 14747370. - DOI - PubMed
-
- Dimitrijevic J, Dukanovic L, Kovacevic Z, Bogdanovic R, Maksic D, Hrvacevic R, Aleksic A, Naumovic R, Jovanovic D, Brajuskovic G, Milosavljevic I . Lupus nephritis: histopathologic features, classification and histologic scoring in renal biopsy. Vojnosanit Pregl. 2002;59(6 Suppl):21–31. Epub 2003/07/11. PubMed PMID: 12852143. - PubMed
-
- Fanouriakis A, Kostopoulou M, Cheema K, Anders HJ, Aringer M, Bajema I, Boletis J, Frangou E, Houssiau FA, Hollis J, Karras A, Marchiori F, Marks SD, Moroni G, Mosca M, Parodis I, Praga M, Schneider M, Smolen JS, Tesar V, Trachana M, van Vollenhoven RF, Voskuyl AE, Teng YKO, van Leew B, Bertsias G, Jayne D, Boumpas DT. 2019 Update of the Joint European League Against Rheumatism and European Renal Association-European Dialysis and Transplant Association (EULAR/ERA-EDTA) recommendations for the management of lupus nephritis. Ann Rheum Dis. 2020;79(6):713–23. Epub 2020/03/30. doi: 10.1136/annrheumdis-2020-216924. PubMed PMID: 32220834. - DOI - PubMed
-
- Hahn BH, McMahon MA, Wilkinson A, Wallace WD, Daikh DI, Fitzgerald JD, Karpouzas GA, Merrill JT, Wallace DJ, Yazdany J, Ramsey-Goldman R, Singh K, Khalighi M, Choi SI, Gogia M, Kafaja S, Kamgar M, Lau C, Martin WJ, Parikh S, Peng J, Rastogi A, Chen W, Grossman JM, American College of R. American College of Rheumatology guidelines for screening, treatment, and management of lupus nephritis. Arthritis Care Res (Hoboken). 2012;64(6):797–808. Epub 2012/05/05. doi: 10.1002/acr.21664. PubMed PMID: 22556106; PMCID: PMC3437757. - DOI - PMC - PubMed
MeSH terms
Substances
Grants and funding
- UH2 AR067685/AR/NIAMS NIH HHS/United States
- UH2-AR067694/AR/NIAMS NIH HHS/United States
- UH2-AR067691/AR/NIAMS NIH HHS/United States
- UM2 AR067678/AR/NIAMS NIH HHS/United States
- UC2-AR081039/AR/NIAMS NIH HHS/United States
- UM1-AI144292/HI/NHLBI NIH HHS/United States
- P30-AR073750/AR/NIAMS NIH HHS/United States
- R01 DK134625/DK/NIDDK NIH HHS/United States
- UH2-AR067676/AR/NIAMS NIH HHS/United States
- UH2 AR067688/AR/NIAMS NIH HHS/United States
- UH2 AR067689/AR/NIAMS NIH HHS/United States
- UC2 AR081039/AR/NIAMS NIH HHS/United States
- UH2-AR067689/AR/NIAMS NIH HHS/United States
- UH2 AR067690/AR/NIAMS NIH HHS/United States
- UH2 AR067677/AR/NIAMS NIH HHS/United States
- UH2 AR067694/AR/NIAMS NIH HHS/United States
- UH2-AR067685/AR/NIAMS NIH HHS/United States
- UH2 AR067679/AR/NIAMS NIH HHS/United States
- UC2-AR081032/AR/NIAMS NIH HHS/United States
- UH2-AR067690/AR/NIAMS NIH HHS/United States
- UM1 AI144292/AI/NIAID NIH HHS/United States
- UC2 AR081032/AR/NIAMS NIH HHS/United States
- UH2 AR067681/AR/NIAMS NIH HHS/United States
- UH2-AR067679/AR/NIAMS NIH HHS/United States
- P30 AR073750/AR/NIAMS NIH HHS/United States
- R01-DK134625/DK/NIDDK NIH HHS/United States
- UH2- AR067688/AR/NIAMS NIH HHS/United States
- UH2-AR067681/AR/NIAMS NIH HHS/United States
- UM2-AR067678/AR/NIAMS NIH HHS/United States
- UH2-AR067677/AR/NIAMS NIH HHS/United States
- UH2 AR067676/AR/NIAMS NIH HHS/United States
- UH2 AR067691/AR/NIAMS NIH HHS/United States
LinkOut - more resources
Full Text Sources
