. 2024 Sep;11(33):e2402199.
doi: 10.1002/advs.202402199. Epub 2024 Jul 4.

Dendritic Cell-Hitchhiking In Vivo for Vaccine Delivery to Lymph Nodes

Affiliations

Dendritic Cell-Hitchhiking In Vivo for Vaccine Delivery to Lymph Nodes

Lei Zhou et al. Adv Sci (Weinh). 2024 Sep.

Abstract

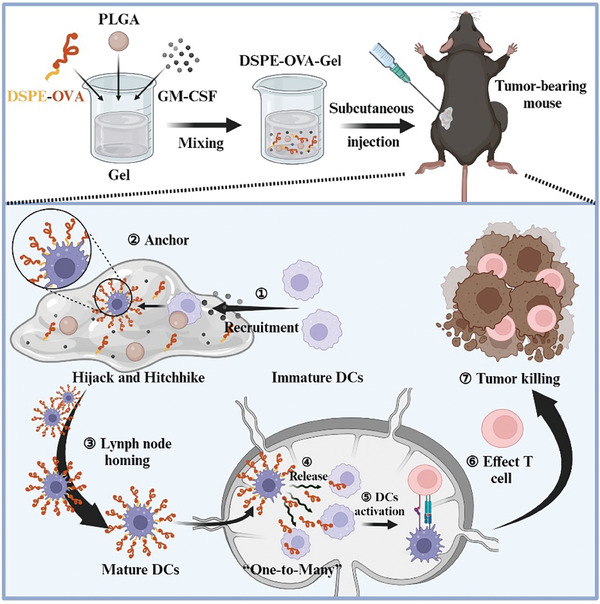
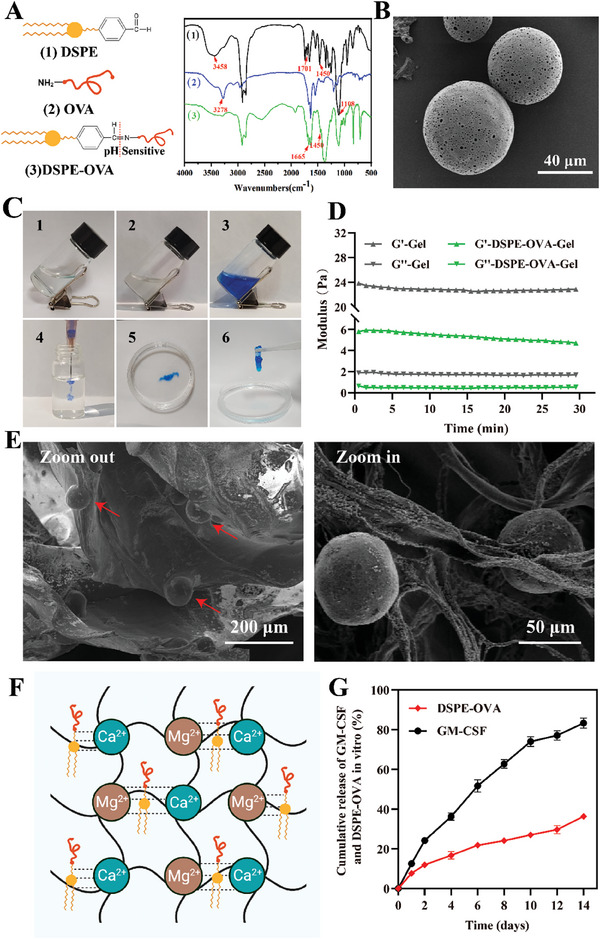
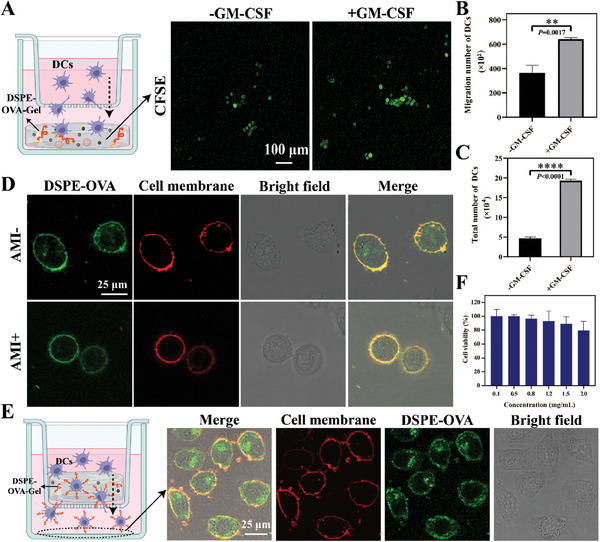
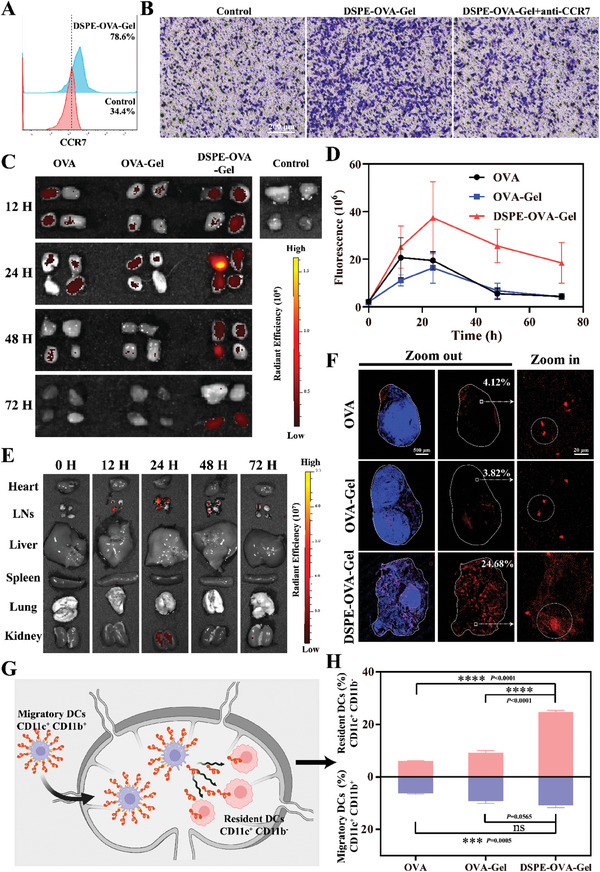
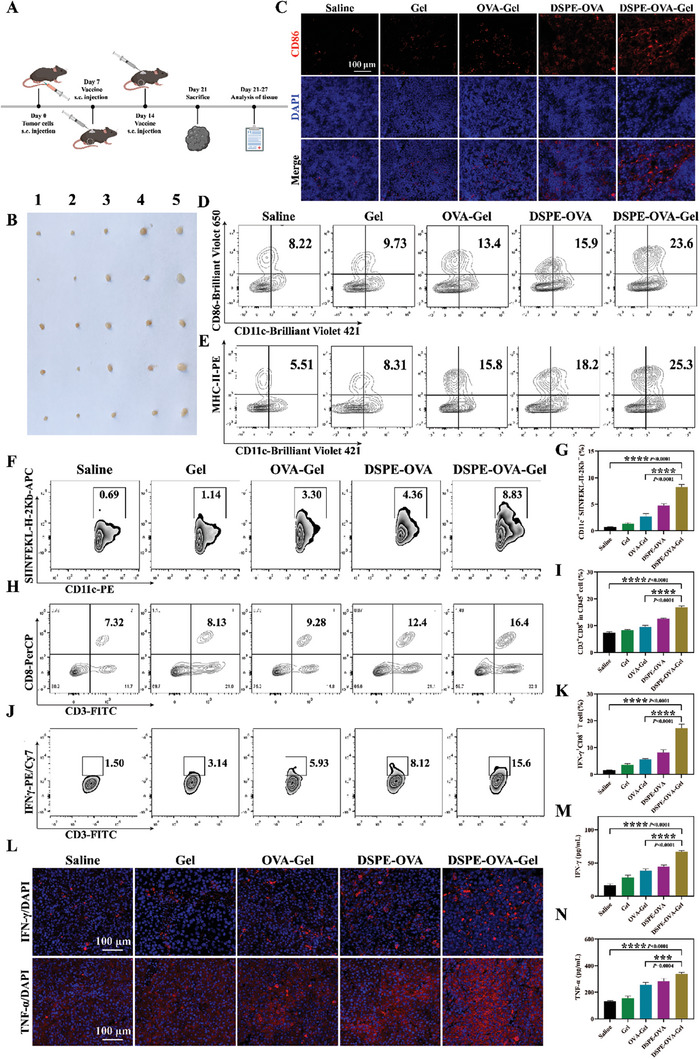
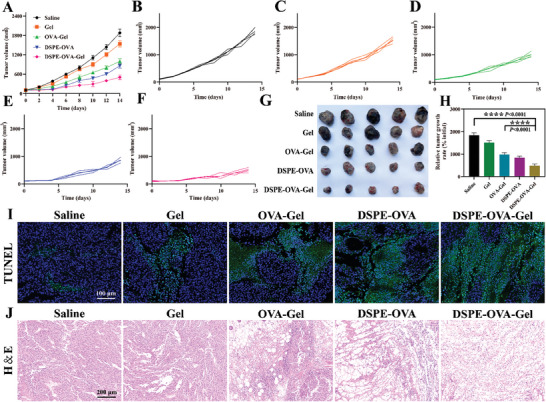
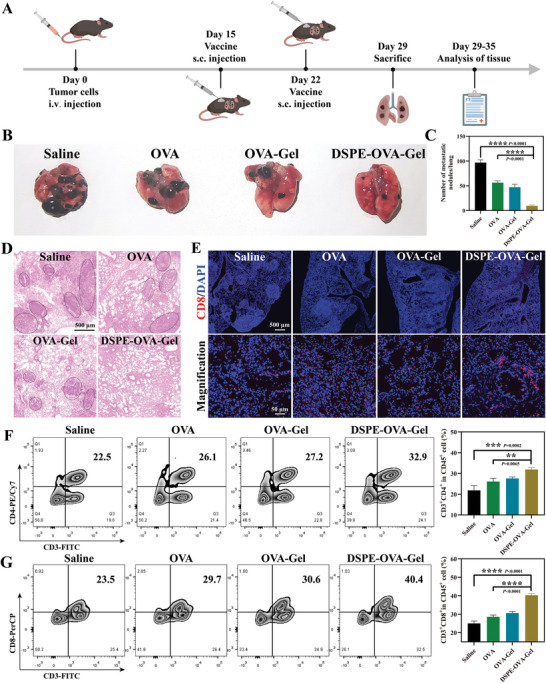
Therapeutic cancer vaccines are among the first FDA-approved cancer immunotherapies. Among them, it remains a major challenge to achieve robust lymph-node (LN) accumulation. However, delivering cargo into LN is difficult owing to the unique structure of the lymphatics, and clinical responses have been largely disappointing. Herein, inspired by the Migrated-DCs homing from the periphery to the LNs, an injectable hydrogel-based polypeptide vaccine system is described for enhancing immunostimulatory efficacy, which could form a local niche of vaccine "hitchhiking" on DCs. The OVA peptide modified by lipophilic DSPE domains in the hydrogel is spontaneously inserted into the cell membrane to achieve "antigen anchoring" on DCs in vivo. Overall, OVA peptide achieves active access LNs through recruiting and "hitchhiking" subcutaneous Migrated-DCs. Remarkably, it is demonstrated that the composite hydrogel enhances LNs targeting efficacy by approximately six-fold compared to free OVA peptide. Then, OVA peptide can be removed from the cell surface under a typical acidic microenvironment within the LNs, further share them with LN-resident APCs via the "One-to-Many" strategy (One Migrated-DC corresponding to Many LN-resident APCs), thereby activating powerful immune stimulation. Moreover, the hydrogel vaccine exhibits significant tumor growth inhibition in melanoma and inhibits pulmonary metastatic nodule formation.

Keywords: dendritic cell‐hitchhiking; lymph node targeting; vaccine delivery.


Conflict of interest statement

The authors declare no conflict of interest.

Figures

Scheme 1
Scheme 1
Schematic diagram of the hydrogel‐based vaccine to enhance tumor immunotherapy by DCs “hitchhiking”. First, the schematic diagram shows the preparation of DSPE‐OVA‐Gel, which consists of pH‐responsive DSPE‐OVA, porous PLGA microspheres, and GM‐CSF. DSPE‐OVA‐Gel solution is cross‐linked with the cations present to form hydrogel after subcutaneous injection in mice. Then, GM‐CSF recruits sufficient Migrated‐DCs to hydrogel, and porous PLGA microspheres with rough surfaces provide attachment sites for DCs. When the Migrated‐DCs are recruited and resided in hydrogel, the model antigen OVA modified by DSPE is spontaneously inserted into the DCs membrane in hydrogel based on its high membrane binding affinity to achieve “OVA anchoring” on DCs in vivo. Finally, the OVA‐bearing DCs migrate to LNs, which induce sufficient effector T‐cells via the one Migrated‐DC corresponding to many LN‐resident APCs strategy under the LN typical acidic microenvironment.
Figure 1
Figure 1
Preparation and characterization of DSPE‐OVA‐Gel vaccine. A) FT‐IR spectra of 1) DSPE, 2) OVA and 3) DSPE‐OVA. 1) The characteristic C═O peak of aromatic aldehydes at 1701 cm−1 and C═C stretching vibration peaks of benzene ring structure at 1450 cm−1 are present; 2) The characteristic peaks of OVA were at 3278 cm−1 representing NH functional groups (primary amine); 3) A new absorption peak at 1665 cm−1 was attributed to the absorption of ─C═N─ in DSPE–OVA. B) Representative TEM image of PLGA (scale bar: 40 µm). C) The photos of 1) the sodium alginate solution, 2) DSPE‐OVA‐Gel solution and 3,4) MB‐containing the DSPE‐OVA‐Gel solution. Gel formation of DSPE‐OVA‐Gel 5,6) by adding into the cation mixed solution of 1.8 × 10−3 mol L−1 CaCl2 and 1.5 × 10−3 mol L−1 MgCl2. D) The rheological (storage modulus G′ and loss modulus G″) properties of the hydrogel with/without DSPE‐OVA, PLGA and GM‐CSF. E) The zoom‐out (left) and zoom‐in (right) SEM images of DSPE‐OVA‐Gel (the scale bar is 200 µm in the left image and 50 µm in the right enlarged image). F) Schematic diagram of the DSPE‐OVA‐Gel formation. G) Cumulative release of GM‐CSF and DSPE‐OVA from DSPE‐OVA‐Gel in vitro (n = 3 independent experiments). The results are shown as the mean ± standard deviation.
Figure 2
Figure 2
DCs recruitment and OVA anchoring via DSPE‐OVA‐Gel. A) Schematics for transwell model of DCs recruitment. Representative CLSM images of DCs (green) recruited into the hydrogel after 24 h of coculture (scale bar: 100 µm). B) Statistical analyses for the number of DCs recruited to the hydrogel (n = 3 independent experiments). C) Total number of DCs in DSPE‐OVA‐Gel loaded with GM‐CSF on 5th day after subcutaneous injection. D) Representative CLSM images of DCs loaded with DSPE‐OVA in the presence/absence of preincubation with amiloride (DSPE‐OVA: green; cell membrane: red, scale bar: 25 µm). E) The ability of DCs to load DSPE‐OVA in the hydrogel was investigated by transwell coculture system (DSPE‐OVA: green; cell membrane: red, scale bar: 25 µm). A schematic diagram of transwell coculture system is shown on the left. F) The cytotoxicity of DCs treated with DSPE‐OVA was assessed in CCK‐8 assays (24 h), expressed as a percentage of normal DCs (n = 3 independent experiments). The results are shown as the mean ± standard deviation. Statistical analyses were performed via the two‐sided Student's t‐test, ** p < 0.01; **** p < 0.0001.
Figure 3
Figure 3
Exploiting the “hitchhike” for potent lymph node delivery. A) Flow cytometry for surface expression of CCR7 in DC2.4 cells after the hydrogel treatment. B) CCL21‐induced migration of DC2.4 cell was assessed by transwell assay in vitro. CCR7‐neutralizing antibody (20 µg mL−1) was used to block the chemokine receptors CCR7 on the cell surface of DC2.4 cells. (scale bar: 200 µm) C) IVIS fluorescence imaging of the isolated inguinal and axillary LNs from C57BL/6 mice at different time points after vaccine administration. D) The corresponding quantitative fluorescence intensity in LN drainage over time (n = 3 independent experiments). E) The heart, LNs, liver, spleen, lung, and kidney were excised from mice treated with DSPE‐OVA‐Gel. IVIS imaging and DSPE‐OVA‐Gel distribution among these tissues at the indicated times post‐treatment. F) Antigen accumulations within the LNs 24 h after administration. The nucleus and antigens are labeled by DAPI (blue) and TAMRA (red), respectively (scale bar of left and middle images, 500 µm; scale bar of right enlarged images, 20 µm). G) Schematic diagram of the DSPE‐OVA‐Gel potential mechanism for LNs delivery. H) The tendency of delivery pathways based on the proportion of Resident‐DCs (CD11c+ CD11b) and Migratory‐DCs (CD11c+ CD11b+) within the LNs (n = 3 independent experiments). The results are shown as the mean ± standard deviation. Statistical analyses were performed via ordinary one‐way analyses of variance (ANOVA) with Tukey's multiple comparisons test, no significant (ns): p > 0.05; *** p < 0.001; **** p < 0.0001.
Figure 4
Figure 4
DSPE‐OVA‐Gel buttresses robust immune responses in vivo. A) The experimental design to evaluate the immune responses by the DSPE‐OVA‐Gel. B) Enlargement of LNs after vaccination (1: Saline, 2: Gel, 3: OVA‐Gel, 4: DSPE‐OVA, 5: DSPE‐OVA‐Gel, n = 5 independent experiments). C) Immuno‐fluorescence images of CD86 in LNs (CD86: red; DAPI: blue, scale bar: 100 µm). Representative flow cytometric analyses of CD11c+ CD86+ cells D), CD11c+ MHC‐II+ cells E), CD11c+ SIINFEKL‐H‐2Kb+ cells (gated on CD11c+) F) and CD3+ CD8+ T‐cells (gate on CD45+) H) infiltrated in LNs after receiving different treatments in C57BL/6 mice (n = 3 independent experiments). The relative quantification of CD11c+ SIINFEKL‐H‐2Kb+ cells G) and CD8+ T‐cells I) infiltrated in LNs. Flow cytometry analyses J) and relative quantification K) of IFN‐γ+ CD8+ T‐cells (gate on CD45+ CD3+) in peripheral blood. L) Representative immuno‐fluorescence staining for IFN‐γ and TNF‐α in tumor tissues (IFN‐γ/TNF‐α: red; Nucleus: blue, scale bar: 100 µm, n = 3 independent experiments). Serum levels of IFN‐γ M) and TNF‐α N) were measured by ELISA (n = 3 independent experiments). The results are shown as the mean ± standard deviation. Statistical analyses were performed via ordinary one‐way ANOVA with Tukey's multiple comparisons test, *** p < 0.001; **** p < 0.0001.
Figure 5
Figure 5
DSPE‐OVA‐Gel effectively inhibits tumor growth. A–F) Curve of tumor volume in B16‐OVA tumor bearing mice after treatment (n = 5 independent experiments). G) Picture of tumor tissue (n = 5 independent experiments). H) Relative tumor volume profiles of tumor‐bearing mice at day 21. The relative tumor volume was calculated by average tumor volume in each measured date/average tumor volume in the initial treatment date. (n = 5 independent experiments). I) Representative TUNEL fluorescence of mouse tumor sections (TUNEL: green; DAPI: blue, scale bar: 100 µm). J) Representative H&E staining of mouse tumor sections (scale bar: 200 µm). The results are shown as the mean ± standard deviation. Statistical analyses were performed via ordinary one‐way ANOVA with Tukey's multiple comparisons test, **** p < 0.0001.
Figure 6
Figure 6
DSPE‐OVA‐Gel effectively prevents the formation of lung metastatic nodules. A) The experimental design to evaluate the efficacy of lung metastasis by the DSPE‐OVA‐Gel. Lung metastatic nodules were examined B) and counted C) at day 29 (n = 5 independent experiments). D) H&E staining of lungs (scale bar: 500 µm). E) Representative immuno‐fluorescence staining of CD8+ T‐cell infiltration in lung tissues (CD8: red; Nucleus: blue, scale bar of upper images, 500 µm; scale bar of bottom enlarged images, 50 µm). Representative flow cytometric analyses (left) and semi‐quantitative (right) of CD4+ T‐cells F) and CD8+ T‐cells G) (gate on CD45+) infiltrated in spleen after receiving different treatments in C57BL/6 mice (n = 3 independent experiments). Statistical analyses were performed via ordinary one‐way ANOVA with Tukey's multiple comparisons test, ** p < 0.01; *** p < 0.001; **** p < 0.0001.

Similar articles

Cited by

References

    1. Bae J., Parayath N., Ma W., Amiji M., Munshi N., Anderson K. C., Leukemia. 2020, 34, 210. - PMC - PubMed
    1. Castellanos‐Rueda R., Di Roberto R. B., Bieberich F., Schlatter F. S., Palianina D., Nguyen O. T. P., Kapetanovic E., Läubli H., Hierlemann A., Khanna N., Reddy S. T., Nat. Commun. 2022, 13, 6555. - PMC - PubMed
    1. Newman J. H., Chesson C. B., Herzog N. L., Bommareddy P. K., Aspromonte S. M., Pepe R., Estupinian R., Aboelatta M. M., Buddhadev S., Tarabichi S., Lee M., Li S., Medina D. J., Giurini E. F., Gupta K. H., Guevara‐Aleman G., Rossi M., Nowicki C., Abed A., Goldufsky J. W., Broucek J. R., Redondo R. E., Rotter D., Jhawar S. R., Wang S. J., Kohlhapp F. J., Kaufman H. L., Thomas P. G., Gupta V., Kuzel T. M., Proc Natl Acad Sci U S A. 2020, 117, 1119. - PMC - PubMed
    1. Cheung A. S., Mooney D. J., Nano Today. 2015, 10, 511. - PMC - PubMed
    1. Du Y., Peng Q., Cheng D., Pan T., Sun W., Wang H., Ma X., He R., Zhang H., Cui Z., Feng X., Liu Z., Zhao T., Hu W., Shen L., Jiang W., Gao N., Martin B. N., Zhang C. J., Zhang Z., Wang C., Nat. Commun. 2022, 13, 231. - PMC - PubMed

LinkOut - more resources