. 2024 Sep;11(33):e2402954.
doi: 10.1002/advs.202402954. Epub 2024 Jul 4.

piRNA PROPER Suppresses DUSP1 Translation by Targeting N6-Methyladenosine-Mediated RNA Circularization to Promote Oncogenesis of Prostate Cancer

Affiliations

piRNA PROPER Suppresses DUSP1 Translation by Targeting N6-Methyladenosine-Mediated RNA Circularization to Promote Oncogenesis of Prostate Cancer

Shuai Ben et al. Adv Sci (Weinh). 2024 Sep.

Abstract

Genetic and epigenetic alterations occur in many physiological and pathological processes. The existing knowledge regarding the association of PIWI-interacting RNAs (piRNAs) and their genetic variants on risk and progression of prostate cancer (PCa) is limited. In this study, three genome-wide association study datasets are combined, including 85,707 PCa cases and 166,247 controls, to uncover genetic variants in piRNAs. Functional investigations involved manipulating piRNA expression in cellular and mouse models to study its oncogenetic role in PCa. A specific genetic variant, rs17201241 is identified, associated with increased expression of PROPER (piRNA overexpressed in prostate cancer) in tumors and are located within the gene, conferring an increased risk and malignant progression of PCa. Mechanistically, PROPER coupled with YTHDF2 to recognize N6-methyladenosine (m6A) and facilitated RNA-binding protein interactions between EIF2S3 at 5'-untranslated region (UTR) and YTHDF2/YBX3 at 3'-UTR to promote DUSP1 circularization. This m6A-dependent mRNA-looping pattern enhanced DUSP1 degradation and inhibited DUSP1 translation, ultimately reducing DUSP1 expression and promoting PCa metastasis via the p38 mitogen-activated protein kinase (MAPK) signaling pathway. Inhibition of PROPER expression using antagoPROPER effectively suppressed xenograft growth, suggesting its potential as a therapeutic target. Thus, targeting piRNA PROPER-mediated genetic and epigenetic fine control is a promising strategy for the concurrent prevention and treatment of PCa.

Keywords: N6‐methyladenosine; PIWI‐interacting RNA; Prostate cancer; Single nucleotide polymorphism.


Conflict of interest statement

The authors declare no conflict of interest.

Figures
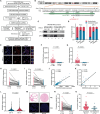
Figure 1
Figure 1
Identification and expression analyses of PCa risk‐associated piRNAs. A) Flowchart illustrating the SNP filtrating design. B) Sequences of rs17201241 (red arrow) resided piR‐hsa‐136611 derived from SNORD48 were analyzed and the conserved motifs were annotated. C) Confirmation of piR‐hsa‐136611 binding to PIWIL4 using biotinylated piR‐hsa‐136611 (Mut) probe in PC‐3 and 22Rv1 cell by biotin‐streptavidin RNA pull‐down assay. D) Distribution of PROPER in nucleus and cytoplasm of PCa cells with U6 or GAPDH as nucleus or cytoplasm markers, respectively. Data are presented as mean ± s.d. (n = 4). E) The detection of PROPER in PCa cells were analyzed by fluorescence in situ hybridization using DIG‐labeled locked nucleic acid (LNA) probes to PROPER (red). The nucleus was counterstained with DAPI (blue). Scale bars, 20 µm. F,G) SNORD48 (F) or PROPER (G) expression levels in PCa tissues (n = 483) and normal tissues (n = 52) from TCGA database. P values were calculated using unpaired two‐sided Mann‐Whitney U‐tests. H,I) SNORD48 (H) or PROPER (I) expression levels in 31 paired PCa tissues and normal tissues by RT‐qPCR. P values were calculated using paired two‐sided Mann‐Whitney U‐tests. J) Spearman's rank correlation coefficient analysis between SNORD48 and PROPER expression in tumors from TCGA database. K) Spearman's rank correlation coefficient analysis between SNORD48 and PROPER expression in tumors by RT‐qPCR. L) The association between PROPER expression level and Gleason score (GS) in TCGA. P values were calculated using unpaired two‐sided Mann‐Whitney U‐tests. M) The representative dot of RNA FISH of PROPER and H&E staining in prostate tissue microarray containing 90 paired PCa and adjacent normal tissues. N) Relative immunofluorescence density [arbitrary units (a.u.)] of RNA FISH between 90 paired tumor and adjacent normal tissues. Scale bars, 100 µm. P values were calculated using two‐sided paired Mann‐Whitney U‐tests. O) Relative immunofluorescence density [arbitrary units (a.u.)] of RNA FISH between aggressive and non‐aggressive PCa tissues. P values were calculated using unpaired two‐sided Mann‐Whitney U‐tests.
Figure 2
Figure 2
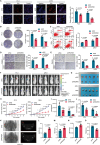
PROPER functions as an oncogene to promote malignant phenotypes and metastasis of PCa in vitro and in vivo. A) Effects of PROPER expression on the proliferation of PC‐3 and 22Rv1 cells tested by EdU assay. Nuclei labeled with hoechst are in blue. The fluorescent thymidine analog EdU was used to identify proliferative cells by labeling their DNA in red. Representative images (left, middle) and quantitative statistics by flow cytometry (right). Data are presented as mean ± s.d. (n = 4); P values were calculated using unpaired two‐sided Mann‐Whitney U‐tests. B) Effects of PROPER expression on the colony formation capability of PCa cells. Representative images (left) and quantification (right) of colony formation results. Data are presented as mean ± s.d. (n = 4); P values were calculated using unpaired two‐sided Mann‐Whitney U‐tests. C) Effects of PROPER expression on PCa cell apoptosis. Data are presented as mean ± s.d. (n = 4); P values were calculated using unpaired two‐sided Mann‐Whitney U‐tests. D,E) Effects of PROPER on the capability of invasion (D) and migration (E) of PCa cells in vitro. Representative images of transwell assays (left panels) and quantitative statistics (right panels). Scale bars, 100 µm. Data are presented as mean ± s.d. (n = 4); P values were calculated using unpaired two‐sided Mann‐Whitney U‐tests. F, G) Representative luminescence images of nude mice (F) and xenograft tumors (G) (n = 5). H) The growth curves of xenograft tumors. P values were calculated using unpaired two‐tailed Student's t‐tests. I,J) Quantitative statistics of luminescence imaging and tumor weight in nude mice. Data are presented as mean ± s.d. (n = 5); P values were calculated using unpaired two‐tailed Student's t‐tests. K) Represents the micro‐CT images of the bone metastasis from sacrifice mice. Tibiae are shown in left and the section of the micro‐CT image are shown in right (n = 6). L–O) Quantitative analyses of bone volume/total volume (BV/TV, %) (L), trabecular number (Tb.N*) M), trabecular thickness (Tb.Th*) (N), and trabecular separation (Tb.Sp*) (O). Data are presented as mean ± s.d. (n  =  6); P values were calculated using unpaired two‐tailed Student's t‐tests.
Figure 3
Figure 3
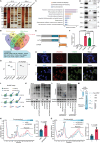
PROPER interacts with YTHDF2 to regulate mRNA translation. A) Silver staining identification of the PROPER‐protein complex pulled down by PROPER sense probe or anti‐sense probe with protein extracts from PC‐3 and 22Rv1 cells using a biotin‐based pull‐down assay. B) Venn diagram showed potential interacting RNA‐binding proteins (RBPs) of PROPER by mass spectrometry and bioinformatic analysis. C) KEGG pathway enrichment analysis of PROPER conjunct 14 proteins. D) Immunoblots of YTHDF1/2/3 enriched by PROPER probes in PC‐3 and 22Rv1 cells. IgG were set as negative controls. E) Diagrams of full‐length and domain‑truncated fragments of YTHDF2; the P/Q/N‐rich domain and YTH domain are indicated. F) RIP‐qPCR analysis of PROPER immunoprecipitated using an anti‐FLAG antibody in PC‐3 cells expressing the indicated YTHDF2 plasmids. The data were normalized to the input levels. Data are presented as mean ± s.d. (n = 4); P values were calculated using unpaired two‐tailed Student's t‐tests. G) RNA pull‐down of PROPER probe with FLAG‐tagged YTHDF2 domain‐deletion mutants. H,I) YTHDF2 immunofluorescence (green) and FISH analysis of PROPER (red) in PCa tissues (H) (Scale bars, 20 µm) and PC‐3 cells (I) (Scale bars, 10 µm). The nucleus was counterstained with DAPI (blue). J) Schematic of SUnSET assay that based on puromycin incorporation to monitor protein synthesis. K,L) SUnSET analyses of PC‐3 and 22Rv1 cells showing the changes in protein synthesis among the indicated samples. M) Schematic of polysome profiling that is based on sucrose‐gradient separation of translated mRNAs, which are associated with polysomes, from untranslated ones. N,O) Polysome profiles and polysome‐to‐monosome (P/M) ratio changes upon PROPER knockdown (N) and PROPER carries different alleles (O). The x axis indicates the free ribosome subunit (40S/60S), monosome (80S), and polysome fractions separated by 10%−45% sucrose gradients. The y axis indicates the absorbance at 260 nm. Data are presented as mean ± s.d. (n = 4); P values were calculated using unpaired two‐sided Mann‐Whitney U‐tests.
Figure 4
Figure 4
DUSP1 is the target of the PROPER/YTHDF2 complex in PCa cells. A) The m6A motif detected by the MEME motif analysis with m6A‐Seq data. B) Percentages of various RNA species with different m6A modifications. C) Metagene profiles of m6A enrichment across mRNA transcriptome composed of 5′‐UTR, CDS, and 3′‐UTR, in PC‐3 cells treated with PEOPER knockdown and control. D) Volcano plot showing the m6A enrichment in mRNAs of PEOPER knockdown and control groups in PC‐3 cells. m6A‐containing mRNAs with 1724 increased (up) and 1726 decreased peak (down) enrichment are highlighted in red and green, respectively. Distribution of m6A peaks and YTHDF2‐binding peaks across transcripts. E) Percentages of m6A peaks in different transcript segments in PROPER knockdown and control groups in PC‐3 cells. F) Correlation between the level of gene expression (overall transcript) and changes in m6A levels in PROPER knockdown and control groups in PC‐3 cells. The upregulated peaks were termed as the hypermethylated m6A peaks and the downregulated peaks were termed as the hypomethylated m6A peaks. G) Gene ontology (GO) enrichment analysis of differentially expressed genes. H) Venn diagram illustrated 208 overlapping peaks of PROPER/YTHDF2 complex targets identified by m6A‐Seq, RNA‐Seq, and RIP‐Seq (data from GSE49339) analysis. I) MeRIP‐Seq displays the distribution of m6A peaks and YTHDF2‐binding peaks in DUSP1 mRNA of PROPER knockdown and control groups in PC‐3 cells. J) The m6A‐containing YTHDF2 binding motif at the 3′‐UTR of DUSP1 mRNA (red, m6A motif). K) In‐slico RNA‐protein docking analysis displays the crystal structure of YTH domain docking with the conserved A(m6A)C of DUSP1.
Figure 5
Figure 5
The PROPER/YTHDF2 complex mediates DUSP1 downregulation. A) Gene‐specific MeRIP‐qPCR validation of the m6A levels at DUSP1 in PC‐3 cells. Data are presented as mean ± s.d. (n = 4). The data were normalized to the input levels. P values were calculated using unpaired two‐sided Mann‐Whitney U‐tests. B,C) Knockdown of METTL3 and METTL14 on the expression of DUSP1. Quantification of blotting intensity for indicated proteins is shown below protein bands (the one in NC is set as 1.0 after normalization with GAPDH blotting). D) METTL3/14 knockdown impaired the interaction between YTHDF2 and DUSP1 by RIP‐qPCR. The data were normalized to the input levels. P values were calculated using unpaired two‐sided Mann‐Whitney U‐tests. E) The effects of YTHDF2 knockdown on the expression of DUSP1. Quantification of blotting intensity for indicated proteins is shown below protein bands (the one in NC is set as 1.0 after normalization with GAPDH blotting). F) RIP‐qPCR analysis of DUSP1 immunoprecipitated using an anti‐FLAG antibody in PC‐3 cells expressing the indicated YTHDF2 plasmids. The data were normalized to the input levels. Data are presented as mean ± s.d. (n = 4). P values were calculated using unpaired two‐sided Mann‐Whitney U‐tests. G) DUSP1 protein levels in cells co‐expressing the YTHDF2 shRNA and the YTHDF2‐truncated plasmids. Quantification of blotting intensity for indicated proteins is shown below protein bands (the one in Vector is set as 1.0 after normalization with GAPDH blotting). H) RNA decay assays indicate the effects of PROPER and YTHDF2 knockdown on the stability of DUSP1 RNA. I) RIP‐qPCR analysis of DUSP1 and PROPER immunoprecipitated by YTHDF2. Data are presented as mean ± s.d. (n = 4). P values were calculated using unpaired two‐sided Mann‐Whitney U‐tests. J) Immunoblotting of DUSP1 protein expression upon knockdown of PROPER and/or YTHDF2. Quantification of blotting intensity for indicated proteins is shown below protein bands (the one in line 1 is set as 1.0 after normalization with GAPDH blotting). K) The effects of PIWIL4 knockdown coupled with PROPER (Mut) transfection on the expression of DUSP1 in PC‐3 cells. Data are presented as mean ± s.d. (n = 4). n.s., not significant; P values were calculated using unpaired two‐sided Mann‐Whitney U‐tests. L) Targeting sites prediction of PROPER within the 3′‐UTRs of DUSP1 using the RNAhybrid. M) Predicted PEOPER regulatory elements at the 3′‐UTRs of DUSP1 and the synthetic PROPER, mutated PROPER, and wild‐type and mutated 3′‐UTR Renilla luciferase reporters. N) Reporter gene assays evaluate the functional consequence of the predicted piRNA:mRNA interactions. The reporters were co‐transfected along with cognate chemically synthesized piRNAs (containing phosphate at the 5′ terminus and 2′‐O‐methylation at the 3′ terminus) or mutant versions. Data are presented as mean ± s.d. (n = 4). n.s., not significant; P values were calculated using unpaired two‐sided Mann‐Whitney U‐tests. O) RT‐qPCR analysis of reporter mRNAs. Data are presented as mean ± s.d. (n = 4); n.s., not significant; P values were calculated using unpaired two‐sided Mann‐Whitney U‐tests.
Figure 6
Figure 6
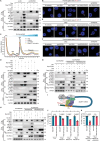
YBX3 and EIF2S3 are required for the PROPER/YTHDF2 complex mediated DUSP1 circularization and translational suppression. A) Lysates prepared from PC‐3 and 22Rv1 cells were hybridized with biotinylated PROPER probe and subject to RNA pull‐down assays. The remaining lysates were subject to western blotting with antibodies against YBX3 and EIF2S3. B) Proximity ligation assay (PLA) demonstrate the interaction between YBX3 and YTHDF2 in PC‐3 cells; (n = 4). C) Polysome profiles and polysome‐to‐monosome (P/M) ratio changes upon YBX3 knockdown, YTHDF2 knockdown, YBX3 and YTHDF2 knockdown together, and control PC‐3 cells; (n = 4). D) Co‐IP assays of the interaction between Myc‐EIF2S3 and Flag‐YTHDF2 or HA‐YBX3 in PC‐3 cells. E) PLA demonstrate the interaction between EIF2S3 and YTHDF2 in PC‐3 cells; (n = 4). F) PLA demonstrate the interaction between EIF2S3 and YBX3 in PC‐3 cells; (n = 4). G) Myc‐EIF2S3 Co‐IP with Flag‐YTHDF2 in PROPER knockout, and PROPER knockout with ectopically expressed PROPER/PROPERmut of PC‐3 cells. H) Myc‐EIF2S3 Co‐IP with HA‐YBX3 in PROPER knockout, and PROPER knockout with ectopically expressed PROPER/PROPERmut of PC‐3 cells. I) Schematic diagram illustrating the mechanism that PROPER functions as a rivet to enhance EIF2S3‐YTHDF2/YBX3 interaction. J) EIF2S3 tethered at the 3′‐UTR of mRNA augments translation of an upstream reporter gene by MS2 tethering assay. Data are presented as mean ± s.d. (n = 3); n.s., not significant; P values were calculated using unpaired two‐tailed Student's t‐tests. K) EIF2S3 mediated DUSP1 mRNA circularization and translation was inhibited by PORPER. Data are presented as mean ± s.d. (n = 3); n.s., not significant; P values were calculated using unpaired two‐tailed Student's t‐tests.
Figure 7
Figure 7
PROPER regulates DUSP1 expression that contributes to PCa progression. A,B) DUSP1 downregulated in primary PCa tissues (A) and metastasis PCa (B). P values were calculated using unpaired two‐tailed Student's t‐tests. C,D) DUSP1 downregulated in patients with high Gleason score (C) and high pre‐treatment PSA (D); GS, Gleason score. P values were calculated using one‐way ANOVA. E,F) Lower levels of DUSP1 correlate with increased risk of biochemical recurrence in two cohorts of PCa patients. P values were assessed by a log rank test. G) Spearman's rank correlation coefficient analysis between PROPER and DUSP1 expression in tumors from TCGA database. H) Representative Micro‐CT images of the hindlimbs of mice 9 weeks after inoculation with the PC‐3 cells. I) Western blotting analysis of the regulations of PROPER on p38 MAPK pathway. J) Timeline schematic for treatment of mouse tumors with antagoPROPER. Colored arrows indicate the times when different events occurred. K) Inhibitory effects of intra‐tumor administration of antagoPROPER on xenograft growth. Shown are pictures of tumors with (upper) or without (bottom) injection of antagoPROPER (n = 5).

References

    1. Sung H., Ferlay J., Siegel R. L., Laversanne M., Soerjomataram I., Jemal A., Bray F., Ca‐Cancer J. Clin. 2021, 71, 209. - PubMed
    1. Gao P., Xia J.‐H., Sipeky C., Dong X.‐M., Zhang Q., Yang Y., Zhang P., Cruz S. P., Zhang K., Zhu J., Lee H.‐M., Suleman S., Giannareas N., Liu S., Tammela T. L. J., Auvinen A., Wang X., Huang Q., Wang L., Manninen A., Vaarala M. H., Wang L., Schleutker J., Wei G.‐H., Cell. 2018, 174, P576. - PMC - PubMed
    1. Hua J. T., Ahmed M., Guo H., Zhang Y., Chen S., Soares F., Lu J., Zhou S., Wang M., Li H., Larson N. B., McDonnell S. K., Patel P. S., Liang Y., Yao C. Q., van der Kwast T., Lupien M., Feng F. Y., Zoubeidi A., Tsao M.‐S., Thibodeau S. N., Boutros P. C., He H. H., Cell. 2018, 174, P564. - PubMed
    1. Jiang X., Guo S., Wang S., Zhang Y., Chen H., Wang Y., Liu R., Niu Y., Xu Y., Cancer Res. 2022, 82, 831. - PubMed
    1. Chen S., Huang V., Xu X., Livingstone J., Soares F., Jeon J., Zeng Y., Hua J. T., Petricca J., Guo H., Wang M., Yousif F., Zhang Y., Donmez N., Ahmed M., Volik S., Lapuk A., Chua M. L. K., Heisler L. E., Foucal A., Fox N. S., Fraser M., Bhandari V., Shiah Y.‐J., Guan J., Li J., Orain M., Picard V., Hovington H., Bergeron A., et al., Cell. 2019, 176, P831. - PubMed

MeSH terms

LinkOut - more resources