. 2024 Sep;11(33):e2400305.
doi: 10.1002/advs.202400305. Epub 2024 Jul 4.

SNORD3A Regulates STING Transcription to Promote Ferroptosis in Acute Kidney Injury

Affiliations

SNORD3A Regulates STING Transcription to Promote Ferroptosis in Acute Kidney Injury

Huanhuan Zhu et al. Adv Sci (Weinh). 2024 Sep.

Abstract

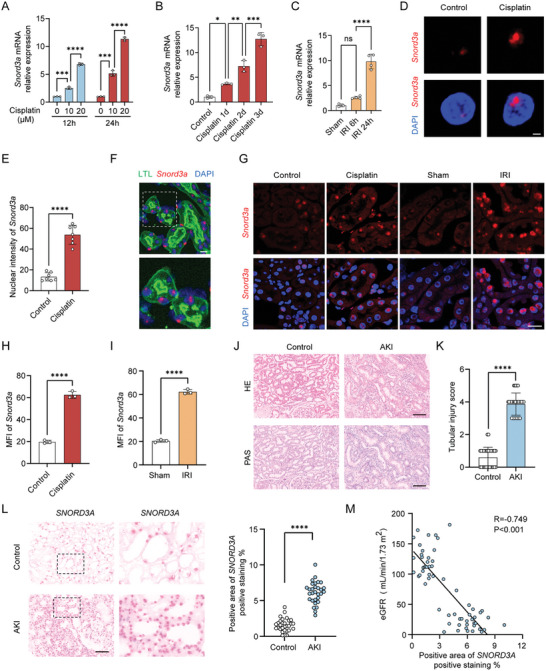
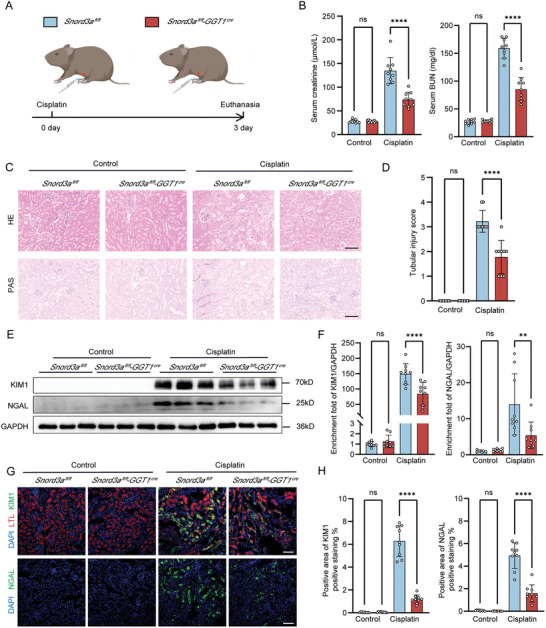
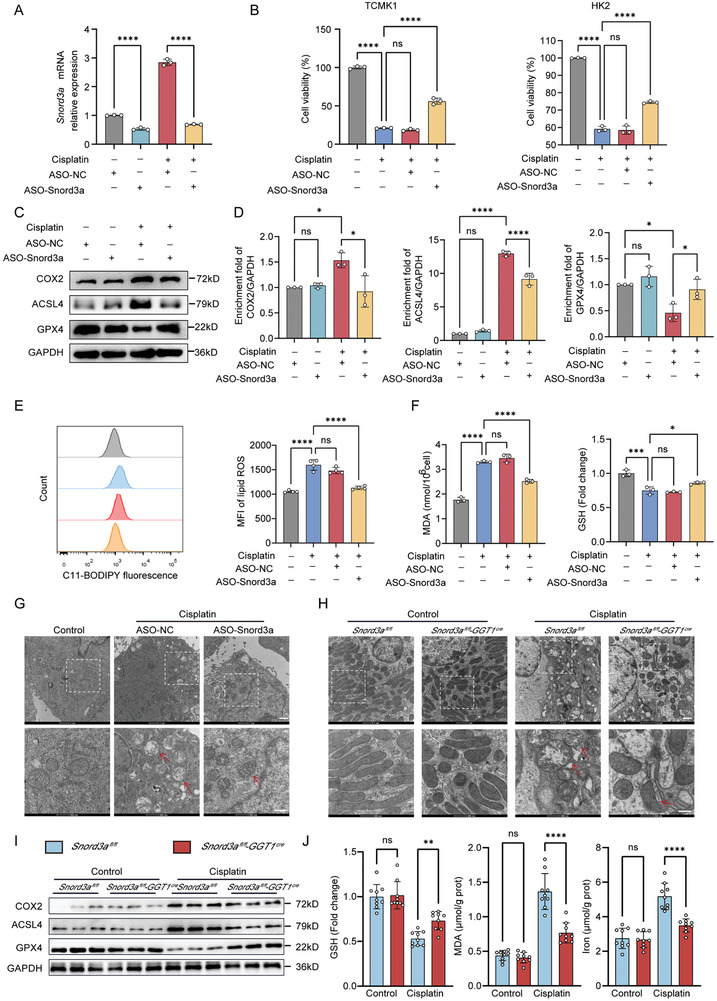
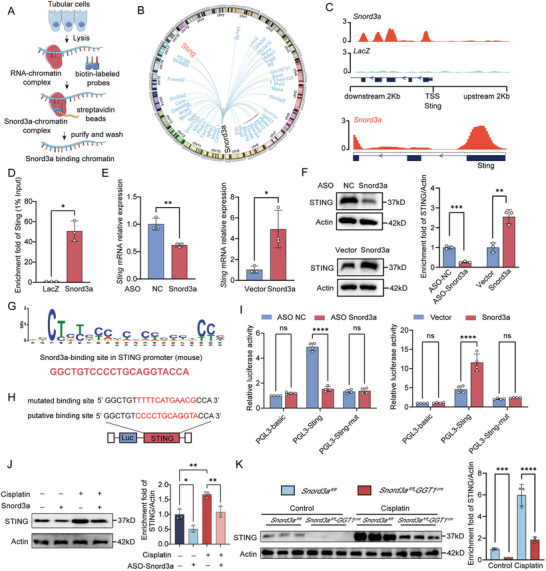
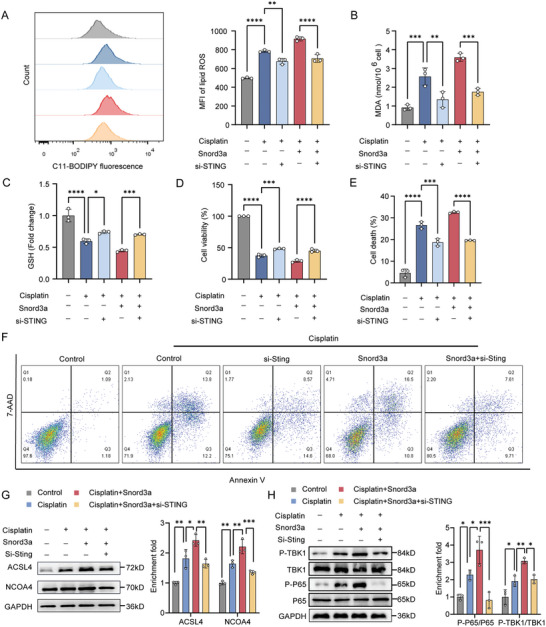
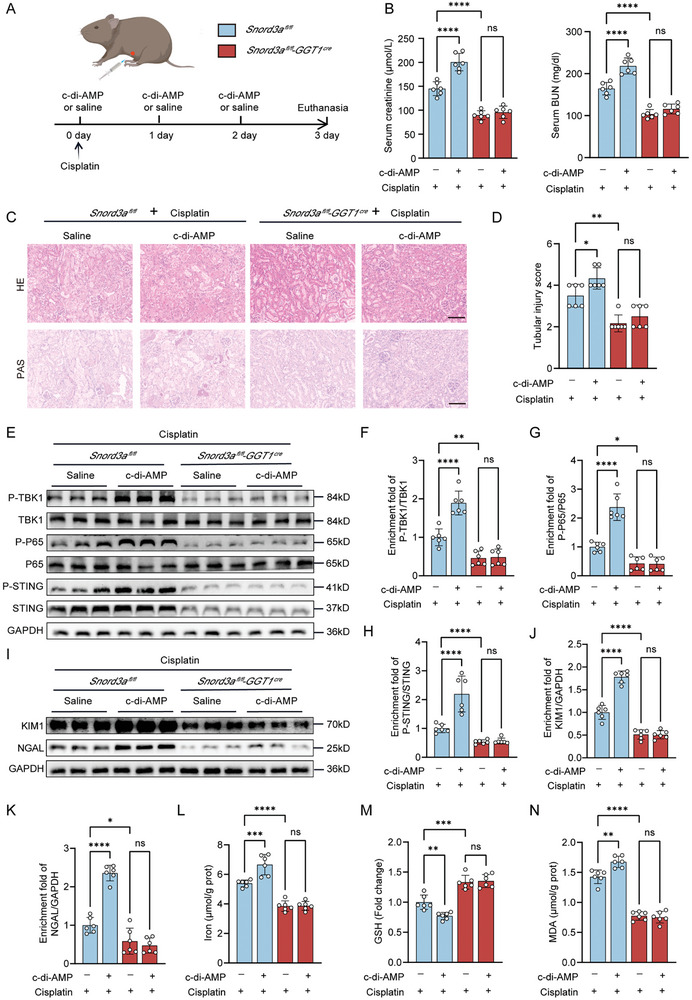
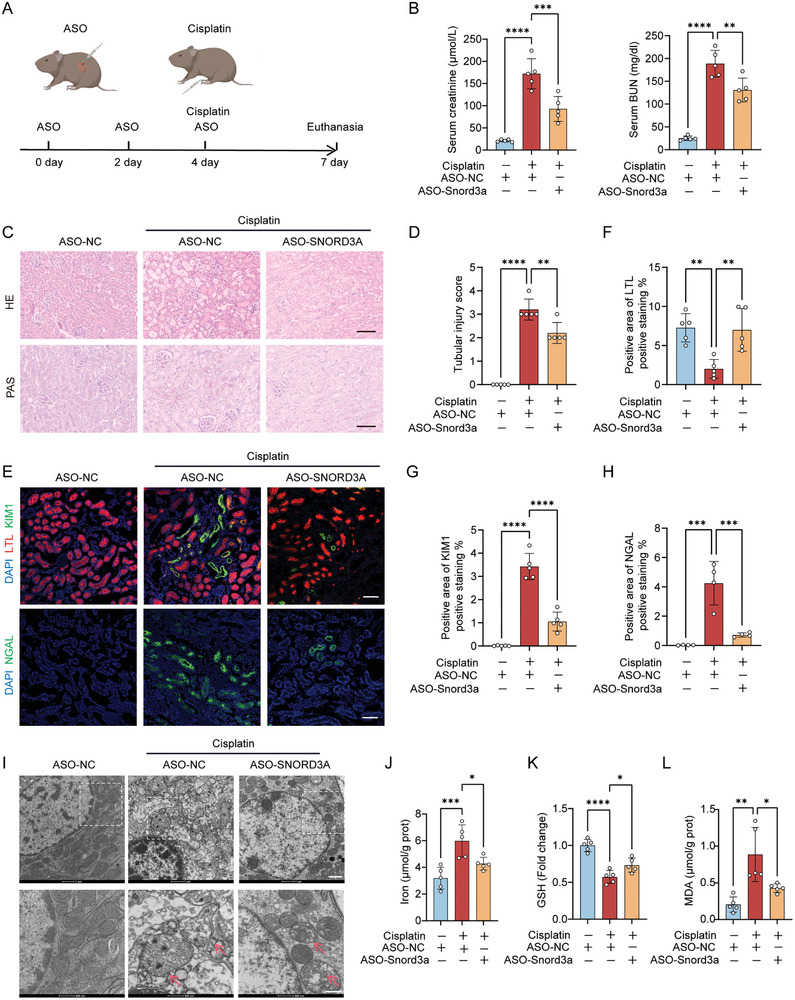
Acute kidney injury (AKI) signifies a sudden and prolonged decline in kidney function characterized by tubular cell death and interstitial inflammation. Small nucleolar RNAs (snoRNAs) play pivotal roles in oxidative stress and inflammation, and may play an important role in the AKI process, which remains elusive. an elevated expression of Snord3a is revealed in renal tubules in response to AKI and demonstrates that Snord3a deficiency alleviates renal injury in AKI mouse models. Notably, the deficiency of Snord3a exhibits a mitigating effect on the stimulator of interferon genes (STING)-associated ferroptosis phenotypes and the progression of tubular injury. Mechanistically, Snord3a is shown to regulate the STING signaling axis via promoting STING gene transcription; administration of Snord3a antisense oligonucleotides establishes a significant therapeutic advantage in AKI mouse models. Together, the findings elucidate the transcription regulation mechanism of STING and the crucial roles of the Snord3a-STING axis in ferroptosis during AKI, underscoring Snord3a as a potential prognostic and therapeutic target for AKI.

Keywords: STING; Snord3a; acute kidney injury; ferroptosis; snoRNA.


Conflict of interest statement

The authors declare no conflict of interest.

Figures

Figure 1
Figure 1
Snord3a expression and characterization in AKI. A) RT‐qPCR analysis of Snord3a expression in the dose and time response of cisplatin‐treated TCMK1 cells (n = 3 for each group). B,C) Mice were intraperitoneally injected with cisplatin (20 mg kg−1, n = 3 for each group) or underwent IRI surgery (n = 3 for sham group and n = 4 for IRI group) to induce AKI models. RT‐qPCR analysis of Snord3a expression in the kidney upon cisplatin or IRI models at different time points. D) Representative images of the nuclear localization of Snord3a (red) co‐stained with DAPI (blue) with or without cisplatin (20 µm) for 24 h. Scale bars, 2 µm. E) Quantification of nuclear intensity of Snord3a from D (n =  7 for each group). F) Representative images of the kidney expressing Snord3a (red), and tubules marker (LTL, green) co‐stained with DAPI (blue). Scale bars, 20 µm. The bottom panels are a magnification of hatched boxes. G) Representative images of the kidney in control, cisplatin (3 day), sham, and IRI (24 h) group expressing Snord3a (red) co‐stained with DAPI (blue). Scale bars, 20 µm. H,I) Mean fluorescence intensity (MFI) of Snord3a signals from G (n = 3 for each group). J,K) Representative images of HE and PAS staining of renal sections from healthy donors and AKI patients, and quantification of tubular injury score. Scale bars, 100 µm; n = 30 for each group. L) Representative FISH images and quantification of Snord3a in healthy donors and AKI patients. Scale bars, 100 µm; n = 30 for each group. M) Spearman analysis of the correlation between Snord3a expression and kidney function (eGFR) in the clinical cohort (n = 30 for each group). Data were presented as means ± SD. Statistical analysis was performed using one‐way ANOVA (A, B, and C) or Student's t‐test (E, H, I, K, and L). * P < 0.05, ** P < 0.01, *** P < 0.001, **** P < 0.0001.
Figure 2
Figure 2
Snord3a deficiency alleviates renal injury in cisplatin‐induced AKI model. A) Schematic representation illustrating the establishment of cisplatin‐induced AKI model in Snord3afl/fl and Snord3afl/fl‐GGT1Cre mice. Briefly, Snord3afl/fl and Snord3afl/fl‐GGT1Cre mice were intraperitoneally injected with cisplatin (20 mg kg−1) or saline, and sacrificed at 3 days after administration. B) Kidney function assessed by serum creatinine and BUN in Snord3afl/fl and Snord3afl/fl‐GGT1Cre mice treated with cisplatin or saline (n = 9 for each group). C,D) Representative images of HE and PAS staining of renal sections from Snord3afl/fl and Snord3afl/fl‐GGT1Cre mice treated with cisplatin or saline, and quantification of tubular injury score (n = 9 for each group). Scale bars, 100 µm. E,F) Immunoblotting analysis and quantification of KIM1 and NGAL in Snord3afl/fl and Snord3afl/fl‐GGT1Cre mice treated with cisplatin or saline (n = 9 for each group). G,H) Representative immunofluorescence images of KIM1 (green), LTL (red), and NGAL (green) in Snord3afl/fl and Snord3afl/fl‐GGT1Cre mice treated with cisplatin or saline, and quantification of positive areas (n = 9 for each group). Scale bars, 100 µm. Data were presented as means ± SD. Statistical analysis was performed using one‐way ANOVA (B, D, F, and H). ** P < 0.01, **** P < 0.0001.
Figure 3
Figure 3
Snord3a accelerates ferroptosis of AKI in vitro and in vivo. A) The knockdown efficiency of Snord3a was evaluated in TCMK1 cells with Snord3a ASO transfection treated with cisplatin (20 µm, 24 h, n = 3 for each group). B) Cell viability was measured in TCMK1 and HK2 cells with Snord3a ASO transfection treated with cisplatin (20 µm, 24 h, n = 3 for each group). C–G) TCMK1 cells were transfected with control or Snord3a ASO for 24 h and then treated with cisplatin (20 µm) for 24 h. C,D) Immunoblotting analysis and quantification of indicators related to ferroptosis (COX2, ACSL4, and GPX4). n = 3 for each group. E) Lipid peroxidation was detected by flow cytometry using the BODIPY 581/591C11 probe (n = 4 for each group). F) MDA levels and GSH levels in different groups (n = 3 for each group). G,H) Representative mitochondrial morphology was visualized by transmission electron microscope (6500X, scale bar = 1 µm or 2 µm; 17500X, scale bar = 500 nm). Arrow: diminished or vanished mitochondria crista, or ruptured mitochondrial outer membrane. I) Immunoblotting analysis of ACSL4, COX2, and GPX4 in Snord3afl/fl and Snord3afl/fl‐GGT1Cre mice treated with cisplatin or saline. (J) GSH levels, MDA levels, and Iron levels of the kidney in Snord3afl/fl and Snord3afl/fl‐GGT1Cre mice treated with cisplatin (20 mg kg−1) or saline (n = 9 for each group). Data were presented as means ± SD. Statistical analysis was performed using one‐way ANOVA (A, B, D, E, F, and J). * P < 0.05, ** P < 0.01, *** P < 0.001, **** P < 0.0001.
Figure 4
Figure 4
Snord3a facilitates the transcription of STING. A) Schematic diagram of identifying Snord3a binding chromatin by CHIRP. B) Circular plot showing interactions of top 50 genes enriched in the promoter region and Snord3a generated by CHIRP‐seq. C) Enrichment of chromatin binding sites for Snord3a at the promoter and gene body regions of STING detected by CHIRP‐seq. Bottom panels are a magnification of chromatin binding sites. D) CHIRP assay and RT‐qPCR analysis of the enrichment of STING (n = 3 for each group). E‐F) RT‐qPCR and immunoblotting analysis of STING in TCMK1 cells treated with Snord3a knockdown or overexpression (n = 3 for each group). G) Motif analysis of the binding peaks of Snord3a to STING promoter sequence based on JASPER website. H,I) Luciferase reporter assays were performed to assess the binding between STING and Snord3a in TCMK1 cells. The red letters indicate the putative or mutated Snord3a‐binding sequences. STING or binding site‐mutated STING was cloned into luciferase plasmids, and then the transduced TCMK1 cells co‐transfected with luciferase plasmid and Snord3a ASO, or luciferase plasmid and Snord3a plasmid (n = 4 for each group). J) Immunoblotting analysis and quantification of STING in TCMK1 cells with Snord3a ASO transfection treated with cisplatin (20 µm, 24 h, n = 3 for each group). K) Immunoblotting analysis and quantification of STING in Snord3afl/fl and Snord3afl/fl‐GGT1Cre mice treated with cisplatin or saline (n = 3 for each group). Data were presented as means ± SD. Statistical analysis was performed using one‐way ANOVA (F, I, J, and K) or Student's t‐test (D and E). * P < 0.05, ** P < 0.01, *** P < 0.001, **** P < 0.0001.
Figure 5
Figure 5
Snord3a interacts with STING to promote ferroptosis in AKI. A–H) TCMK1 cells were transfected with Snord3a plasmid or (and) STING siRNA before 24 h of cisplatin treatment (20 µm, 24 h). A) The lipid peroxidation level by BODIPY 581/591 C11 sensor (n = 3 for each group). B) MDA levels and C) GSH levels in different groups (n = 3 for each group). D) Cell viability was measured by CCK8 assay (n = 3 for each group). E‐F) Cell death was detected by flow cytometry using annexin V and 7‐AAD sensors. All relevant populations indicative of cell death, including Annexin V+ 7ADD‐, Annexin V+ 7ADD+, and Annexin V‐ 7ADD+ (n = 3 for each group). G,H) Immunoblotting analysis and quantification of ACSL4, NCOA4, and cGAS‐STING pathway (n = 3 for each group). Data were presented as means ± SD. Statistical analysis was performed using one‐way ANOVA (A, B, C, D, E, G, and H). * P < 0.05, ** P < 0.01, *** P < 0.001, **** P < 0.0001.
Figure 6
Figure 6
Snord3a deficiency alleviates renal injury aggravated by STING activation in cisplatin‐induced AKI model. A) Schematic representation illustrating the establishment of cisplatin‐induced AKI model with c‐di‐AMP or saline. Briefly, mice were intraperitoneally injected with c‐di‐AMP (25ug) or saline 1 h before cisplatin injection and continued once daily, and sacrificed at 3 days after administration. B) Kidney function was assessed by serum creatinine and BUN (n = 6 for each group). C,D) Representative images of HE and PAS staining of renal sections, and quantification of tubular injury score (n = 6 for each group). Scale bars, 100 µm. E–H) Immunoblotting analysis and quantification of cGAS‐STING pathway (n = 6 for each group). I–K) Immunoblotting analysis and quantification of KIM1 and NGAL (n = 6 for each group). L–N) Iron levels, GSH levels, and MDA levels of the kidney (n = 6 for each group). Data were presented as means ± SD. Statistical analysis was performed using one‐way ANOVA (B, D, F, G, H, J, K, L, M and N). * P < 0.05, ** P < 0.01, *** P < 0.001, **** P < 0.0001.
Figure 7
Figure 7
The therapeutical application of Snord3a ASO in cisplatin‐induced AKI mice model. A) Schematic diagram of Snord3a ASO treatment in the cisplatin‐induced AKI mice model. Briefly, each group was injected with the Snord3a ASO or negative control ASO in the mouse kidneys every two days for three times, and a cisplatin‐induced AKI mice model was performed after the ASO injection. B) Kidney function was assessed by serum creatinine and BUN levels (n = 5 for each group). C,D) Representative images of HE and PAS staining of renal sections, and quantification of tubular injury score (n = 5 for each group). Scale bars, 100 µm. E–H) Representative immunofluorescence images of KIM1 (green, n = 5 for each group) and co‐stained with LTL (red), or NGAL (green, n = 4 for each group), and quantification of positive areas. Scale bars, 100 µm. I) Representative mitochondrial morphology was visualized by transmission electron microscope (6500X, scale bar = 1 µm; 17500X, scale bar = 500 nm). Arrow: diminished or vanished mitochondria crista, or ruptured mitochondrial outer membrane. J‐L) Iron levels, GSH levels, and MDA levels of the kidney (n = 5 for each group). Data were presented as means ± SD. Statistical analysis was performed using one‐way ANOVA (B, D, F, G, H, J, K, and L). * P < 0.05, ** P < 0.01, *** P < 0.001, **** P < 0.0001.

Similar articles

Cited by

References

    1. a) Kashani K. B., Awdishu L., Bagshaw S. M., Barreto E. F., Claure‐Del Granado R., Evans B. J., Forni L. G., Ghosh E., Goldstein S. L., Kane‐Gill S. L., Koola J., Koyner J. L., Liu M., Murugan R., Nadkarni G. N., Neyra J. A., Ninan J., Ostermann M., Pannu N., Rashidi P., Ronco C., Rosner M. H., Selby N. M., Shickel B., Singh K., Soranno D. E., Sutherland S. M., Bihorac A., Mehta R. L., Nat. Rev. Nephrol. 2023, 19, 807; - PubMed
    2. b) Ronco C., Bellomo R., Kellum J. A., Lancet 2019, 394, 1949. - PubMed
    1. a) De Chiara L., Conte C., Antonelli G., Lazzeri E., Int. J. Mol. Sci. 2021, 22, 11093; - PMC - PubMed
    2. b) Li Z., Lu S., Li X., Cell. Mol. Life Sci. 2021, 78, 5731. - PMC - PubMed
    1. Venkatachalam M. A., Weinberg J. M., Kriz W., Bidani A. K., J. Am. Soc. Nephrol. 2015, 26, 1765. - PMC - PubMed
    1. a) Bratkovič T., Rogelj B., Cell. Mol. Life Sci. 2011, 68, 3843; - PMC - PubMed
    2. b) Kufel J., Grzechnik P., Trends Genet. 2019, 35, 104; - PubMed
    3. c) Samarsky D. A., Fournier M. J., Singer R. H., Bertrand E., EMBO J. 1998, 17, 3747. - PMC - PubMed
    1. a) Bergeron D., Faucher‐Giguère L., Emmerichs A.‐K., Choquet K., Song K. S., Deschamps‐Francoeur G., Fafard‐Couture É., Rivera A., Couture S., Churchman L. S., Heyd F., Abou Elela S., Scott M. S., Genome Biol. 2023, 24, 160; - PMC - PubMed
    2. b) Kiss‐László Z., Henry Y., Bachellerie J. P., Caizergues‐Ferrer M., Kiss T., Cell 1996, 85, 1077; - PubMed
    3. c) Bratkovič T., Božič J., Rogelj B., Nucleic Acids Res. 2020, 48, 1627,. - PMC - PubMed

LinkOut - more resources