. 2024 Sep;30(3):155.
doi: 10.3892/mmr.2024.13279. Epub 2024 Jul 4.

Identification and immunological characterization of genes associated with ferroptosis in Alzheimer's disease and experimental demonstration

Affiliations

Identification and immunological characterization of genes associated with ferroptosis in Alzheimer's disease and experimental demonstration

Zhen Xiao et al. Mol Med Rep. 2024 Sep.

Abstract

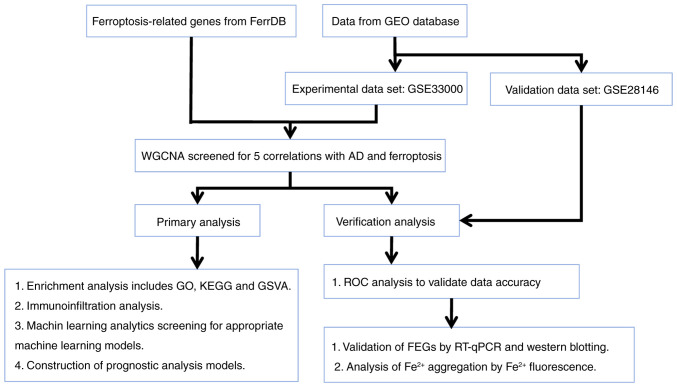
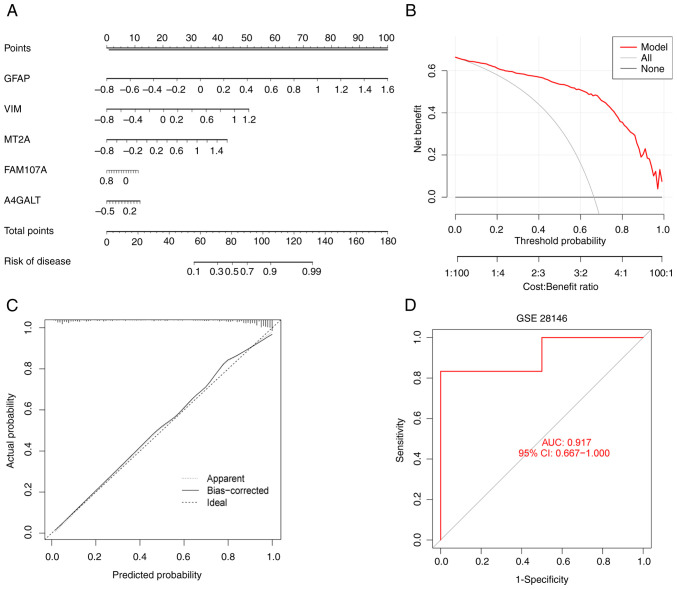
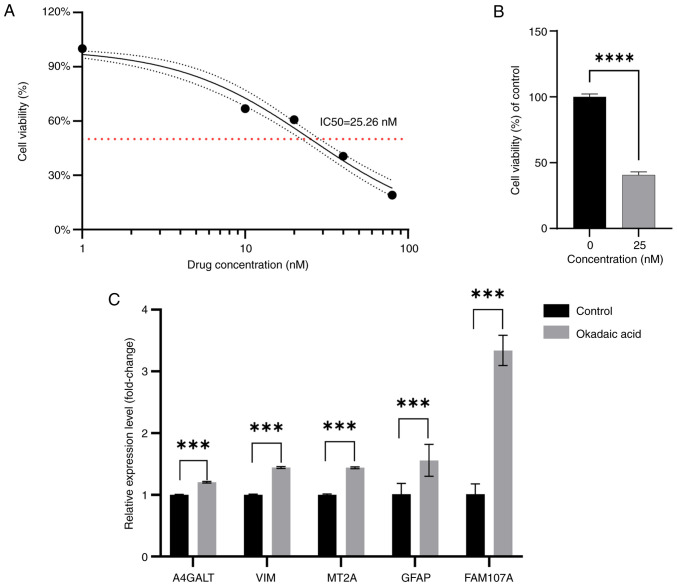
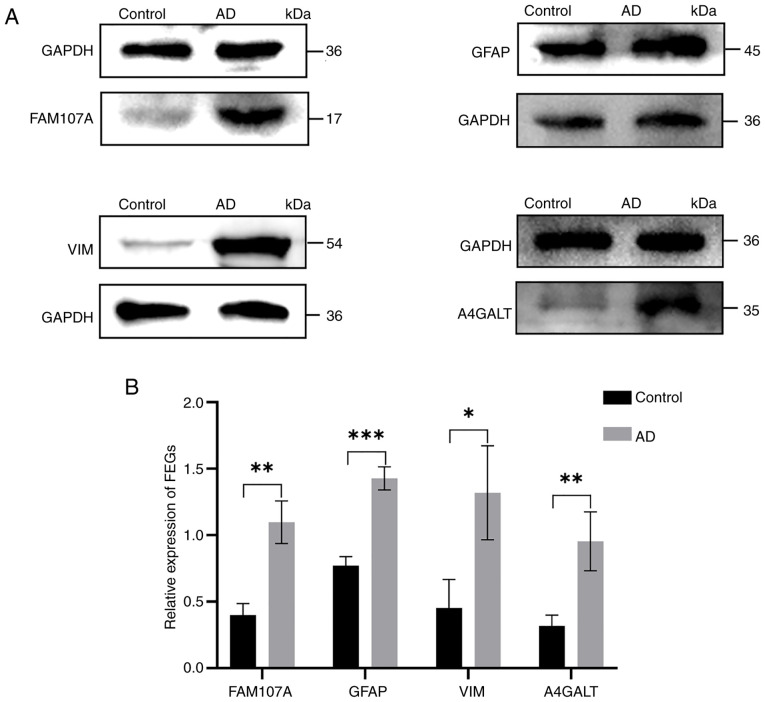
The incidence of Alzheimer's disease (AD) is rising globally, yet its treatment and prediction of this condition remain challenging due to the complex pathophysiological mechanisms associated with it. Consequently, the objective of the present study was to analyze and characterize the molecular mechanisms underlying ferroptosis‑related genes (FEGs) in the pathogenesis of AD, as well as to construct a prognostic model. The findings will provide new insights for the future diagnosis and treatment of AD. First, the AD dataset GSE33000 from the Gene Expression Omnibus database and the FEGs from FerrDB were obtained. Next, unsupervised cluster analysis was used to obtain the FEGs that were most relevant to AD. Subsequently, enrichment analyses were performed on the FEGs to explore biological functions. Subsequently, the role of these genes in the immune microenvironment was elucidated through CIBERSORT. Then, the optimal machine learning was selected by comparing the performance of different machine learning models. To validate the prediction efficiency, the models were validated using nomograms, calibration curves, decision curve analysis and external datasets. Furthermore, the expression of FEGs between different groups was verified using reverse transcription quantitative PCR and western blot analysis. In AD, alterations in the expression of FEGs affect the aggregation and infiltration of certain immune cells. This indicated that the occurrence of AD is strongly associated with immune infiltration. Finally, the most appropriate machine learning models were selected, and AD diagnostic models and nomograms were built. The present study provided novel insights that enhance understanding with regard to the molecular mechanism of action of FEGs in AD. Moreover, the present study provided biomarkers that may facilitate the diagnosis of AD.

Keywords: Alzheimer's disease; ferroptosis; immune infiltration; machine learning model; nomogram.


Conflict of interest statement

The authors declare that they have no competing interests.

Figures

Figure 1.
Figure 1.
Experimental flow chart. GEO, Gene Expression Omnibus; WGCNA, weighted gene co-expression network analysis; AD, Alzheimer's disease; GO, Gene Ontology; KEGG, Kyoto Encyclopedia of Genes and Genomes; GSVA, gene set variation analysis; ROC, receiver operating characteristic; FEGs, ferroptosis-related genes; RT-qPCR, reverse transcription-quantitative PCR.
Figure 2.
Figure 2.
Results of STR genotyping of SH-SY5Y cells. (A) Genotyping results of cellular STR loci and Amelogenin loci. (B) SH-SY5Y database gene pairing results.
Figure 3.
Figure 3.
Differential expression analysis and correlation analysis of ferroptosis-related genes. (A and B) Identification of differential genes. (A) Heat map. (B) Volcano plot. (C) Results of the correlation analysis of differential genes with ferroptosis-related genes in the dataset. C, control; AD, Alzheimer's disease.
Figure 4.
Figure 4.
Co-expression network of differential genes and ferroptosis-related genes in AD. (A) Cluster tree dendrogram for co-expression modules. (B) Clustering of modular characteristic genes. (C) Correlation analysis of ferroptosis-related genes, module characterization genes and clinical status. (D-F) Scatterplot of module membership relationships in the brown module vs. the significance of genes in the control, genes in AD and ferroptosis-related genes, respectively. AD, Alzheimer's disease; TOM, topological overlap matrix.
Figure 5.
Figure 5.
Differential expression identification of FEGs. (A) Crosswalk of ferroptosis-related module-associated genes with module-associated genes in the GSE33000 dataset. (B) Heatmap demonstrating differential expression of 5 FEGs. (C) Box plots showing the differential expression of the 5 FEGs. ***P<0.001. FEGs, ferroptosis-related genes; WGCNA, weighted gene co-expression network analysis; VIM, vimentin; A4GALT, alpha 1,4-galactosyltransferase; MT2A, metallothionein 2A; FAM107A, family with sequence similarity 107, member A; GFAP, glial fibrillary acidic protein; C, control; AD, Alzheimer's disease.
Figure 6.
Figure 6.
Functional enrichment of FEGs. (A) Results of GO analysis of FEGs. (B) Results of KEGG analysis of FEGs. (C-G) Differences in marker pathway activity of A4GALT, MT2A, VIM, FAM107A and GFAP genes between AD and normal controls sorted by t-value of GSVA method. FEGs, ferroptosis-related genes; GO, Gene Ontology; KEGG, Kyoto Encyclopedia of Genes and Genomes; AD, Alzheimer's disease; GFAP, glial fibrillary acidic protein; VIM, vimentin; MT2A, metallothionein 2A; FAM107A, family with sequence similarity 107, member A; A4GALT, alpha 1,4-galactosyltransferase.
Figure 7.
Figure 7.
Immunological characterization of FEGs. (A) Heatmap demonstrating the relative abundance of 22 infiltrating immune cells. (B) Differences in immune infiltration between AD and controls. (C) Specific immune infiltration differences. (D) Correlation between FEGs and 22 types of immune cells. *P<0.05, **P<0.01 and ***P<0.001. FEGs, ferroptosis-related genes; C, control; AD, Alzheimer's disease; NK, natural killer; VIM, vimentin; MT2A, Metallothionein 2A; GFAP, Glial fibrillary acidic protein; FAM107A, family with sequence similarity 107, member A; A4GALT, Alpha 1,4-galactosyltransferase.
Figure 8.
Figure 8.
Four machine models are constructed and evaluated to screen for the most appropriate model. (A) Remaining values for each machine learning model are displayed. (B) Cumulative residual distribution for each machine learning model. (C) Receiver operating characteristic analysis is based on four machine learning models in the test cohort.
Figure 9.
Figure 9.
Identification of XGB models and construction of nomograms. (A) Creating nomograms for predicting Alzheimer' disease risk based on characterized genes in the test set. (B) Decision curve analysis estimates the clinical benefit of the column line graph. (C) Calibration curves to assess the predictive efficacy of nomograms. (D) Validation of the GSE28146 external dataset. GFAP, glial fibrillary acidic protein; VIM, vimentin; MT2A, Metallothionein 2A; FAM107A, family with sequence similarity 107, member A; A4GALT, alpha 1,4-galactosyltransferase; AUC, area under the curve; CI, confidence interval.
Figure 10.
Figure 10.
Cell Counting Kit-8 and reverse transcription-quantitative PCR. (A) Changes in cell viability after 0, 10, 20, 40 and 80 nM concentrations of OA acting on SH-SY5Y cells. (B) Comparison of the viability of SH-SY5Y cells after the action of 25 nM concentration of OA with the control. (C) Relative expression levels of the mRNA of ferroptosis-related genes after 25 nM concentration of OA acting on SH-SY5Y cells compared with control. ***P<0.001 and ****P<0.0001. OA, okadaic acid; A4GALT, alpha 1,4-galactosyltransferase; VIM, vimentin; MT2A, metallothionein 2A; GFAP, glial fibrillary acidic protein; FAM107A, family with sequence similarity 107, member A.
Figure 11.
Figure 11.
Protein expression levels of ferroptosis-related genes in control and experimental cells. *P<0.05, **P<0.01 and ***P<0.001. FAM107A, family with sequence similarity 107, member A; GFAP, glial fibrillary acidic protein; VIM, vimentin; A4GALT, alpha 1,4-galactosyltransferase; AD, Alzheimer's disease.
Figure 12.
Figure 12.
Fe2+ fluorescence staining results. The shade of yellow is the aggregation of Fe2+. AD, Alzheimer's disease.

Similar articles

References

    1. Yu Q, Zhong C. Membrane aging as the real culprit of Alzheimer's disease: Modification of a hypothesis. Neurosci Bull. 2018;34:369–381. doi: 10.1007/s12264-017-0192-4. - DOI - PMC - PubMed
    1. Scheltens P, De Strooper B, Kivipelto M, Holstege H, Chételat G, Teunissen CE, Cummings J, van der Flier WM. Alzheimer's disease. Lancet. 2021;397:1577–1590. doi: 10.1016/S0140-6736(20)32205-4. - DOI - PMC - PubMed
    1. Lane CA, Hardy J, Schott JM. Alzheimer's disease. Eur J Neurol. 2018;25:59–70. doi: 10.1111/ene.13439. - DOI - PubMed
    1. Schneider AR, Sari Y. Therapeutic perspectives of drugs targeting toll-like receptors based on immune physiopathology theory of Alzheimer's disease. CNS Neurol Disord Drug Targets. 2014;13:909–920. doi: 10.2174/1871527313666140711093858. - DOI - PMC - PubMed
    1. Simard AR, Soulet D, Gowing G, Julien JP, Rivest S. Bone marrow-derived microglia play a critical role in restricting senile plaque formation in Alzheimer's disease. Neuron. 2006;49:489–502. doi: 10.1016/j.neuron.2006.01.022. - DOI - PubMed