

Sodium MRI of the Lumbar Intervertebral Discs of the Human Spine: An Ex Vivo Study
- PMID: 38963154
- PMCID: PMC11803688
- DOI: 10.1002/jmri.29521
Sodium MRI of the Lumbar Intervertebral Discs of the Human Spine: An Ex Vivo Study
Abstract
Background: Lower back pain affects 75%-85% of people at some point in their lives. The detection of biochemical changes with sodium (23Na) MRI has potential to enable an earlier and more accurate diagnosis.
Purpose: To measure 23Na relaxation times and apparent tissue sodium concentration (aTSC) in ex-vivo intervertebral discs (IVDs), and to investigate the relationship between aTSC and histological Thompson grade.
Study type: Ex-vivo.
Specimen: Thirty IVDs from the lumbar spines of 11 human body donors (4 female, 7 male, mean age 86 ± 8 years).
Field strength/sequence: 3 T; density-adapted 3D radial sequence (DA-3D-RAD).
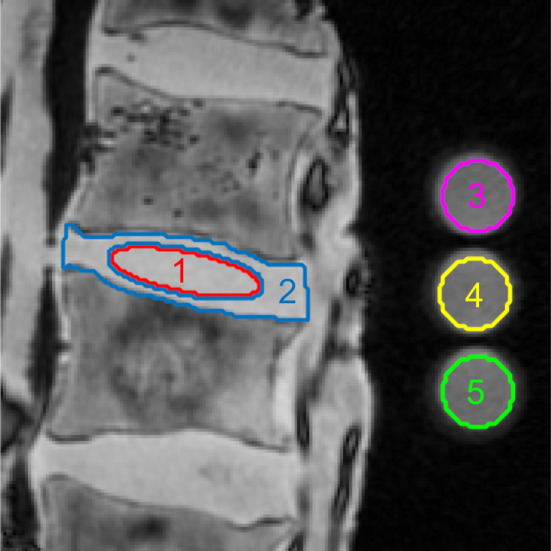
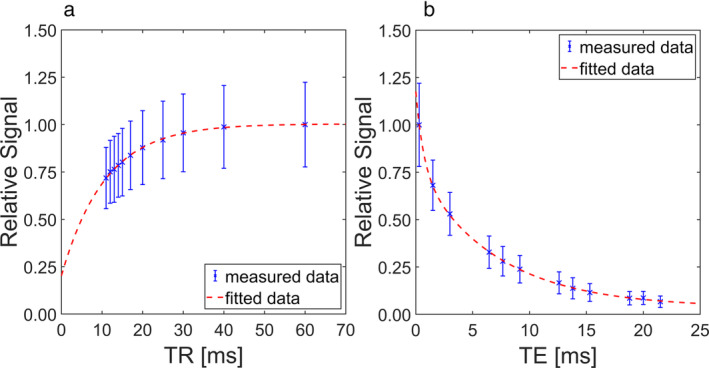
Assessment: IVD 23Na longitudinal (T1), short and long transverse (T2s* and T2l*) relaxation times and the proportion of the short transverse relaxation (ps) were calculated for one IVD per spine sample (11 IVDs). Furthermore, aTSCs were calculated for all IVDs. The degradation of the IVDs was assessed via histological Thompson grading.
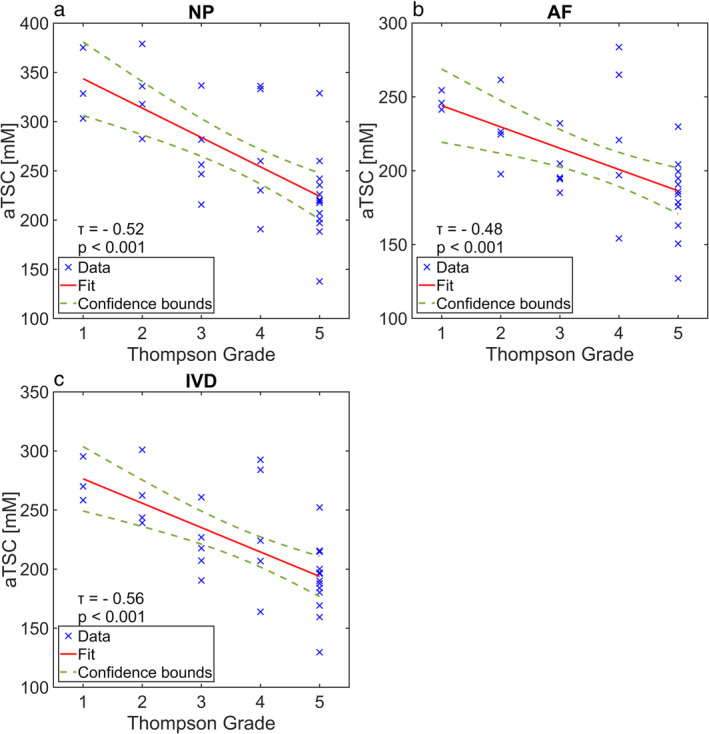
Statistical tests: A Kendall Tau correlation (τ) test was performed between the aTSCs and the Thompson grades. The significance level was set to P < 0.05.
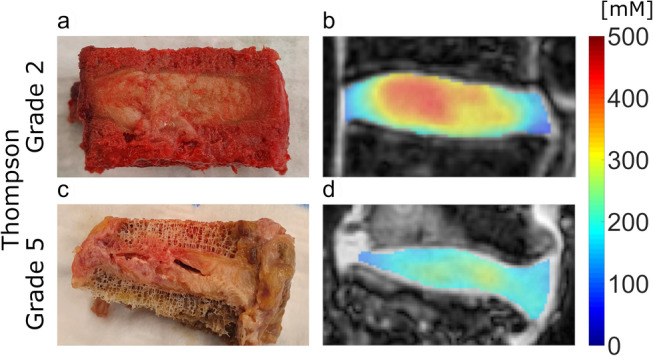
Results: Mean 23Na relaxation parameters of a subset of 11 IVDs were T1 = 9.8 ± 1.3 msec, T2s* = 0.7 ± 0.1 msec, T2l* = 7.3 ± 1.1 msec, and ps = 32.7 ± 4.0%. A total of 30 IVDs were examined, of which 3 had Thompson grade 1, 4 had grade 2, 5 had grade 3, 5 had grade 4, and 13 had grade 5. The aTSC decreased with increasing degradation, being 274.6 ± 18.9 mM for Thompson grade 1 and 190.5 ± 29.5 mM for Thompson grade 5. The correlation between whole IVD aTSC and Thompson grade was significant and strongly negative (τ = -0.56).
Data conclusion: This study showed a significant correlation between aTSC and degenerative IVD changes. Consequently, aTSC has potential to be useful as an indicator of degenerative spinal changes.
Evidence level: 2 TECHNICAL EFFICACY: Stage 1.
Keywords: 23Na MRI; 23Na relaxation times; IVD; ex vivo; intervertebral disc; sodium MRI.
© 2024 The Author(s). Journal of Magnetic Resonance Imaging published by Wiley Periodicals LLC on behalf of International Society for Magnetic Resonance in Medicine.
Figures
Similar articles
-
23Na-magnetic resonance imaging of the human lumbar vertebral discs: in vivo measurements at 3.0 T in healthy volunteers and patients with low back pain.Spine J. 2014 Jul 1;14(7):1343-50. doi: 10.1016/j.spinee.2014.01.031. Epub 2014 Jan 25. Spine J. 2014. PMID: 24472875
-
The importance of level stratification for quantitative MR studies of lumbar intervertebral discs: a cross-sectional analysis in 101 healthy adults.Eur Spine J. 2019 Sep;28(9):2153-2161. doi: 10.1007/s00586-019-06059-1. Epub 2019 Jul 12. Eur Spine J. 2019. PMID: 31309335
-
Characterization of Age-Related and Sex-Related Differences of Relaxation Parameters in the Intervertebral Disc Using MR-Fingerprinting.J Magn Reson Imaging. 2024 Apr;59(4):1312-1324. doi: 10.1002/jmri.28925. Epub 2023 Aug 23. J Magn Reson Imaging. 2024. PMID: 37610269 Free PMC article.
-
Measurement of Three-Dimensional Internal Dynamic Strains in the Intervertebral Disc of the Lumbar Spine With Mechanical Loading and Golden-Angle Radial Sparse Parallel-Magnetic Resonance Imaging.J Magn Reson Imaging. 2021 Aug;54(2):486-496. doi: 10.1002/jmri.27591. Epub 2021 Mar 13. J Magn Reson Imaging. 2021. PMID: 33713520 Free PMC article. Review.
-
Association between non-traumatic vertebral fractures and adjacent discs degeneration: a cross-sectional study and literature review.BMC Musculoskelet Disord. 2020 Nov 27;21(1):781. doi: 10.1186/s12891-020-03814-0. BMC Musculoskelet Disord. 2020. PMID: 33246433 Free PMC article. Review.
Cited by
-
23Na MRI quantification of sodium content in porcine eyes after immersion in saltwater and freshwater en route to time in water estimation.Eur Radiol Exp. 2025 Jul 9;9(1):66. doi: 10.1186/s41747-025-00605-x. Eur Radiol Exp. 2025. PMID: 40634776 Free PMC article.
References
-
- Abhijith S, Ravichandran K. ADC mapping and T2 mapping of the lumbar spine to assess disc degeneration: A review. J Heal Allied Sci NU 2023;14(3):309‐314. 10.1055/s-0043-1772823. - DOI
MeSH terms
Substances
Grants and funding
LinkOut - more resources
Full Text Sources
Medical
