

Evaluation of screening tools for primary ciliary dyskinesia in Egypt: single center study
- PMID: 38963223
- PMCID: PMC11229824
- DOI: 10.5826/mrm.2024.966
Evaluation of screening tools for primary ciliary dyskinesia in Egypt: single center study
Abstract
Background: Primary ciliary dyskinesia (PCD) is a chronic respiratory illness that places significant strain on the healthcare system due to the complexity and expense of its diagnosis and treatment methods. The diagnostic process typically requires skilled technicians and an assortment of intricate, costly, and time-consuming approaches. Implementing screening tools can enhance efficiency by focusing the diagnostic process on those strongly suspected of having PCD. Tools such as the PCD Rule (PICADAR), North America Criteria Defined Clinical Features (NA-CDCF), the Clinical Index Score (CI), and the newly proposed CInew13 could potentially serve as useful screening tools. This study aims to examine the effectiveness of these tools individually, compare their performance against each other, and assess their results relative to prior research.
Methods: We conducted a diagnostic accuracy test on 83 Egyptian patients referred to Alexandria University Children's Hospital for potential PCD diagnosis between January 2015 and December 2022. The scores obtained from the screening tools were calculated and assessed.
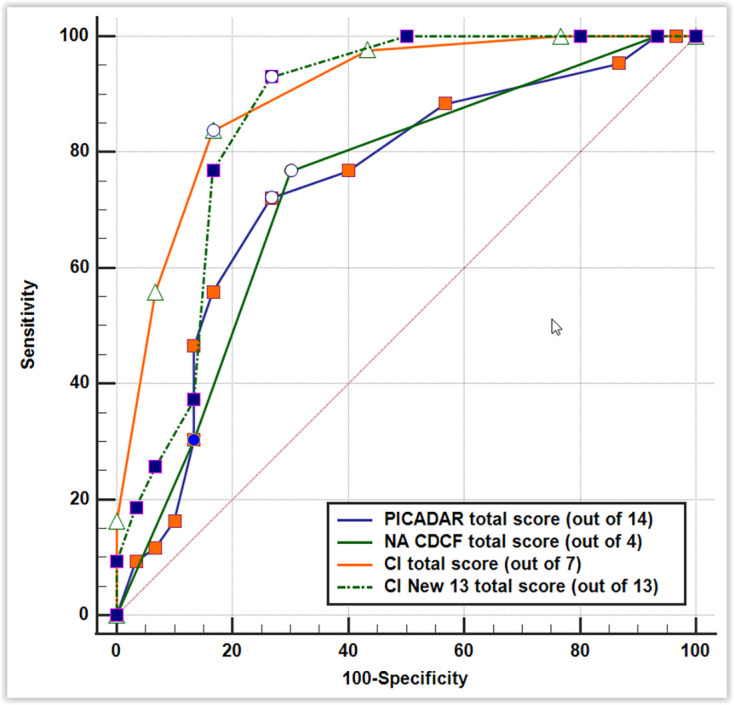
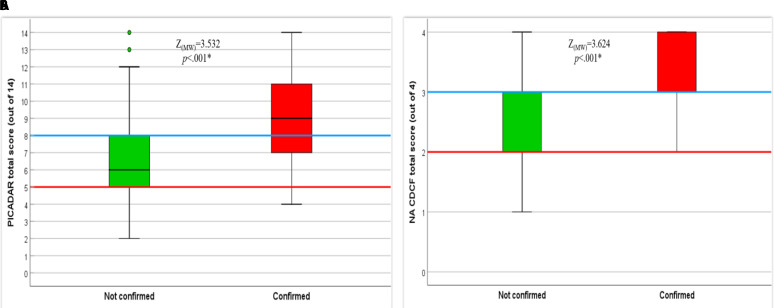
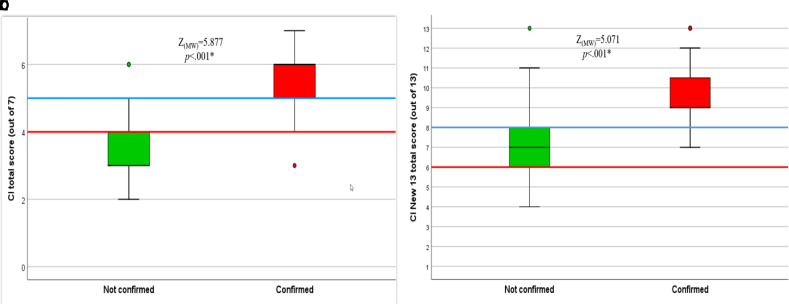
Results: Of the initial group, 10 patients were ruled out because they fit other diagnostic parameters. Forty-three cases received a confirmed diagnosis, while 30 did not. Notably, the confirmed cases consistently scored higher on our screening tools than those that remained unconfirmed (p <.001, for all tested scores). We used receiver operating characteristic curves to assess and compare the effectiveness of each tool. The NA-CDCF had the smallest area under curve 0.736 (95% confiedence interval 0.619-0.832); in contrast, the CI score had the largest 0.898 (95% confidence interval 0.808-0.957).
Conclusion: All the tools tested were effective in identifying suitable patients for PCD testing at statistically significant levels. However, the PICADAR and NA-CDCF scores' performance did not significantly differ in the current study. The CI and CInew13 scores, on the other hand, outperformed both.
Conflict of interest statement
Figures
Similar articles
-
Evaluation of a Clinical Index as a Predictive Tool for Primary Ciliary Dyskinesia.Diagnostics (Basel). 2021 Jun 14;11(6):1088. doi: 10.3390/diagnostics11061088. Diagnostics (Basel). 2021. PMID: 34198708 Free PMC article.
-
Primary ciliary dyskinesia diagnosis and management and its implications in America: a mini review.Front Pediatr. 2023 Sep 8;11:1091173. doi: 10.3389/fped.2023.1091173. eCollection 2023. Front Pediatr. 2023. PMID: 37744431 Free PMC article. Review.
-
Nasal Nitric Oxide Measurement and a Modified PICADAR Score for the Screening of Primary Ciliary Dyskinesia in Adults with Bronchiectasis.Pneumologie. 2017 Aug;71(8):543-548. doi: 10.1055/s-0043-111909. Epub 2017 Aug 7. Pneumologie. 2017. PMID: 28783864 English.
-
PICADAR: a diagnostic predictive tool for primary ciliary dyskinesia.Eur Respir J. 2016 Apr;47(4):1103-12. doi: 10.1183/13993003.01551-2015. Epub 2016 Feb 25. Eur Respir J. 2016. PMID: 26917608 Free PMC article.
-
Progress in Diagnosing Primary Ciliary Dyskinesia: The North American Perspective.Diagnostics (Basel). 2021 Jul 16;11(7):1278. doi: 10.3390/diagnostics11071278. Diagnostics (Basel). 2021. PMID: 34359360 Free PMC article. Review.
References
-
- Goutaki M, Shoemark A. Diagnosis of Primary Ciliary Dyskinesia. Clin Chest Med. 2022;43(1):127–40. - PubMed
-
- Lucas JS, Leigh MW. Diagnosis of primary ciliary dyskinesia: searching for a gold standard. Eur Respiratory Soc. 2014;44(6):1418–22. - PubMed
-
- Goutaki M, Meier AB, Halbeisen FS, Lucas JS, Dell SD, Maurer E, et al. Clinical manifestations in primary ciliary dyskinesia: systematic review and meta-analysis. Eur Respir J. 2016;48(4):1081–95. - PubMed
LinkOut - more resources
Full Text Sources