

Tumor-associated genetic amplifications impact extracellular vesicle miRNA cargo and their recruitment of nerves in head and neck cancer
- PMID: 38963404
- PMCID: PMC11262563
- DOI: 10.1096/fj.202400625RR
Tumor-associated genetic amplifications impact extracellular vesicle miRNA cargo and their recruitment of nerves in head and neck cancer
Abstract
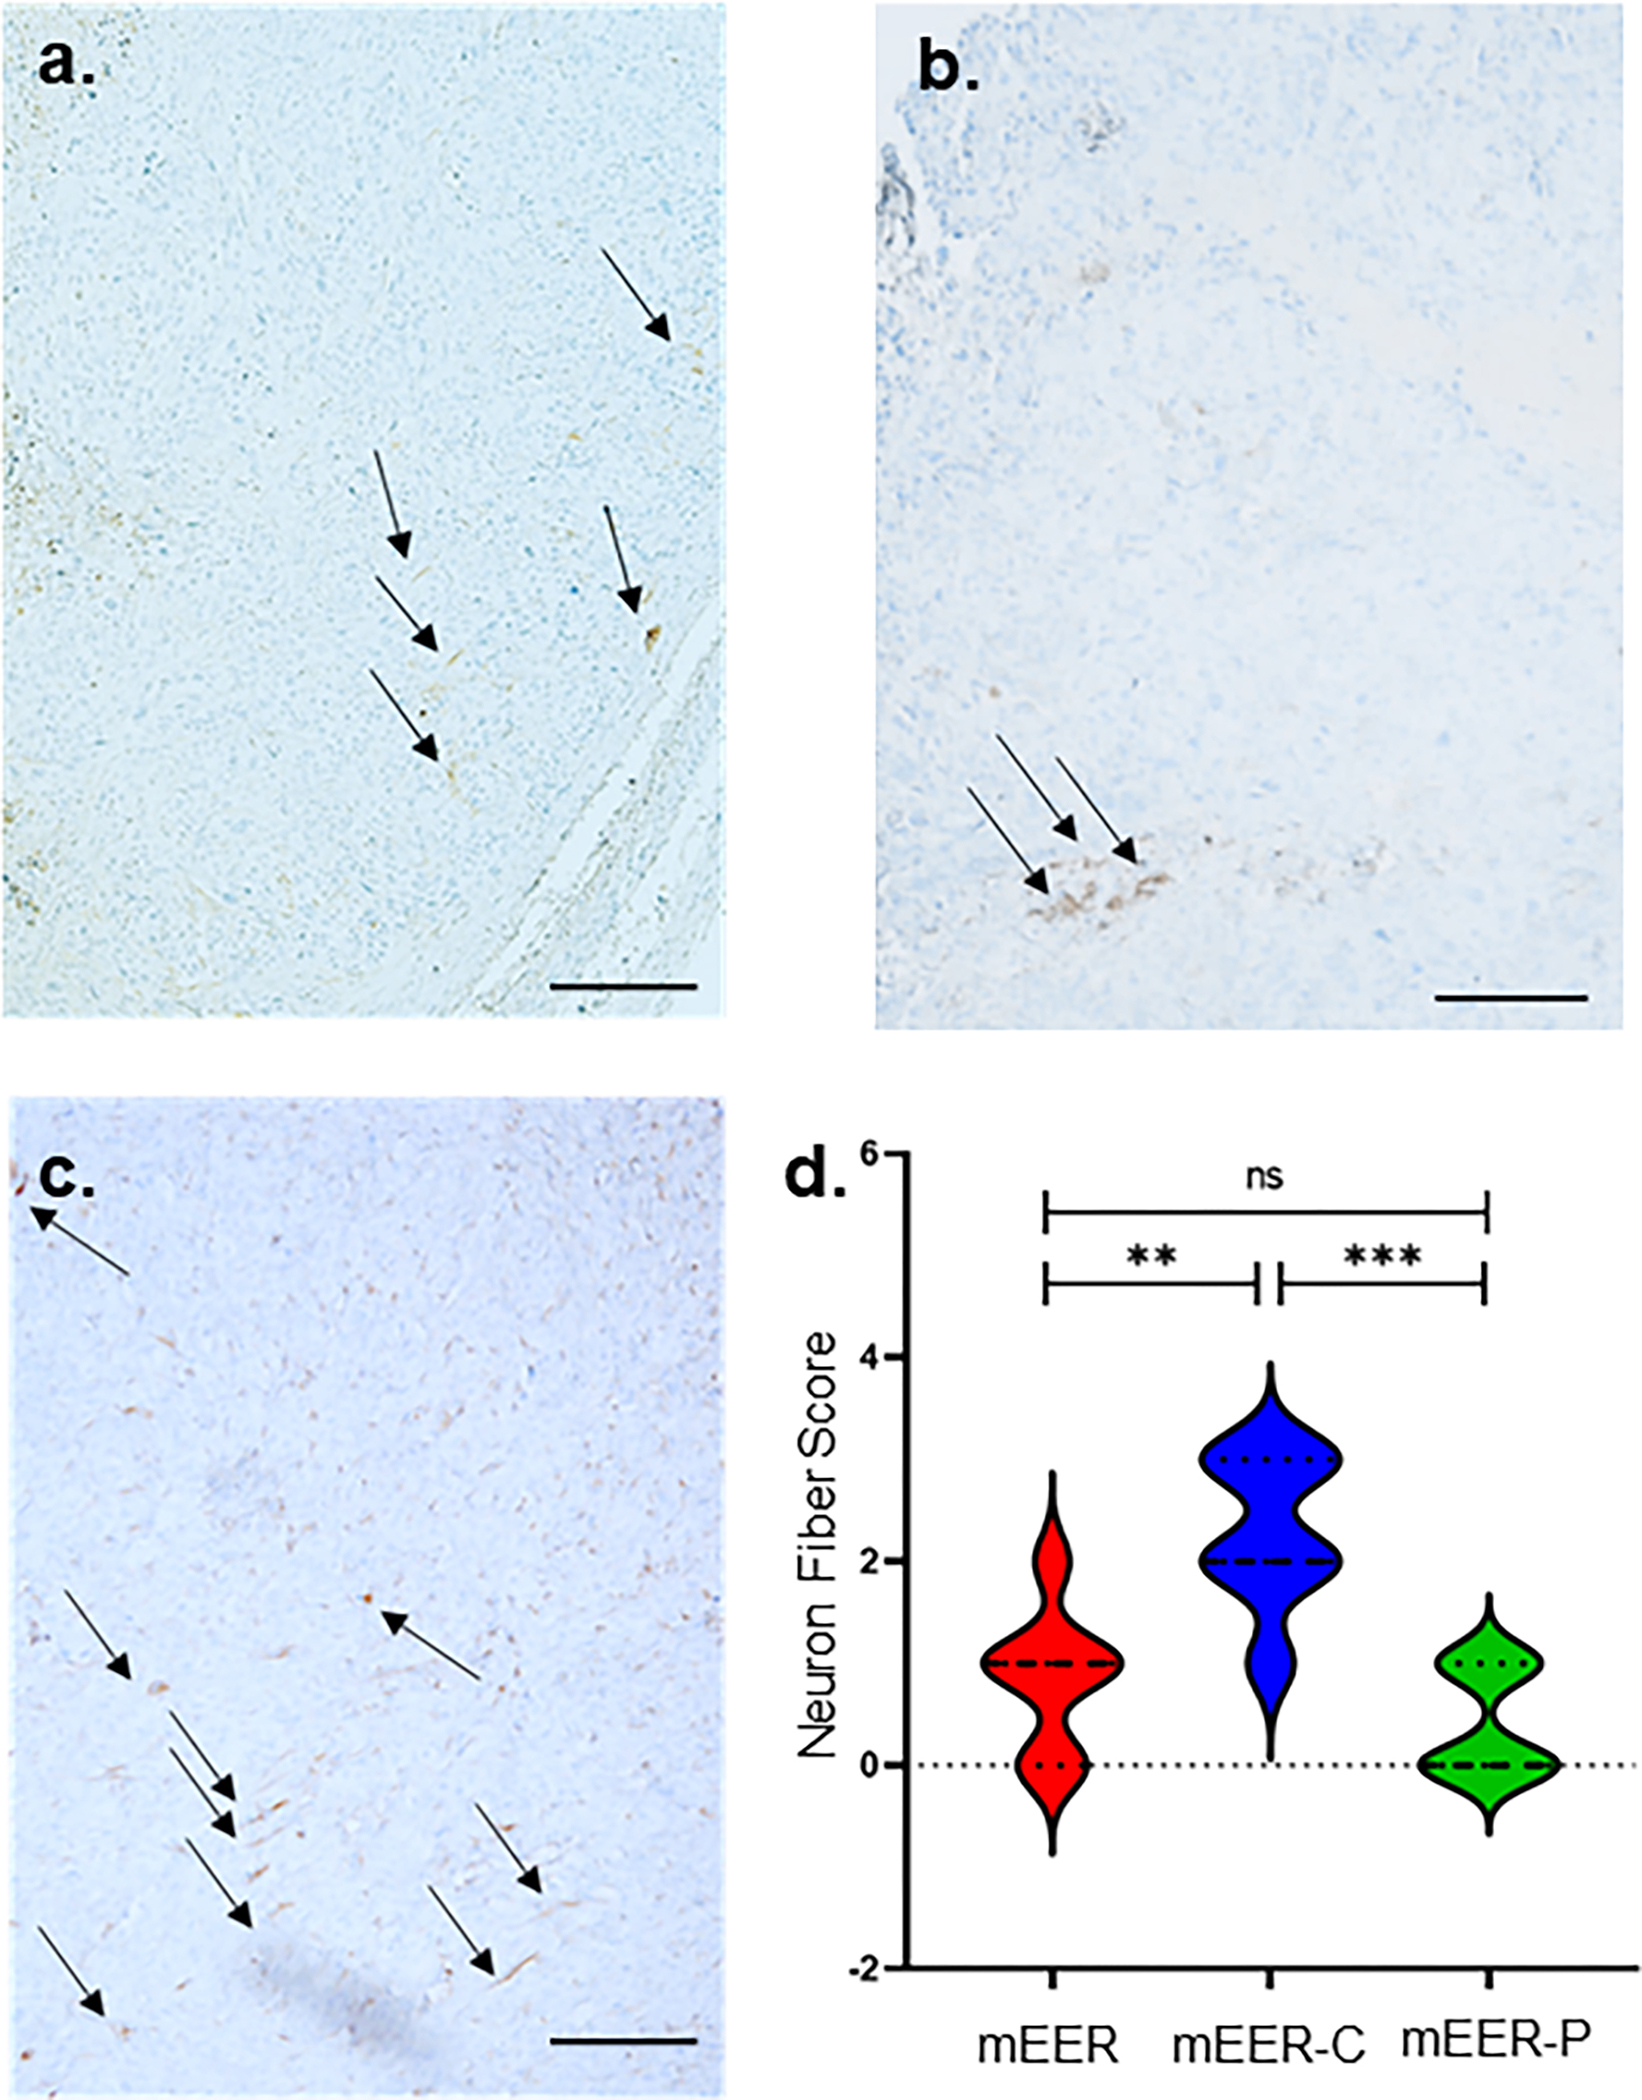
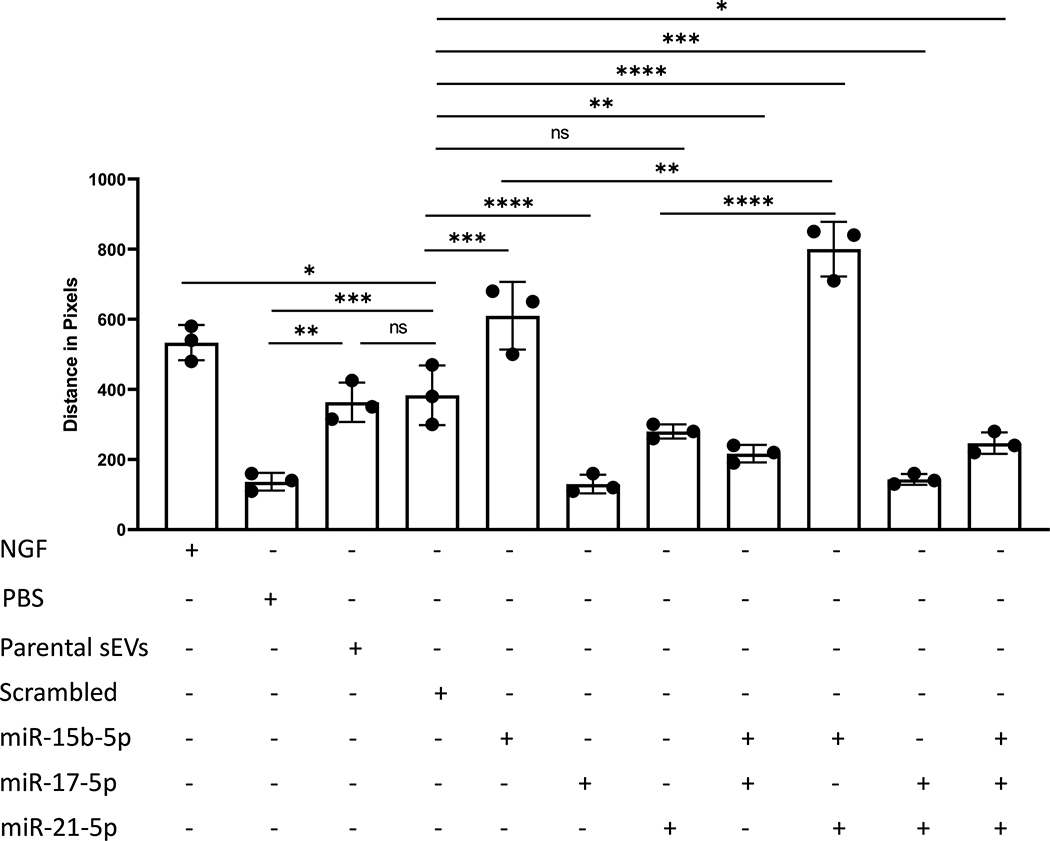
Cancer neuroscience is an emerging field of cancer biology focused on defining the interactions and relationships between the nervous system, developing malignancies, and their environments. Our previous work demonstrates that small extracellular vesicles (sEVs) released by head and neck squamous cell carcinomas (HNSCCs) recruit loco-regional nerves to the tumor. sEVs contain a diverse collection of biological cargo, including microRNAs (miRNAs). Here, we asked whether two genes commonly amplified in HNSCC, CCND1, and PIK3CA, impact the sEV miRNA cargo and, subsequently, sEV-mediated tumor innervation. To test this, we individually overexpressed these genes in a syngeneic murine HNSCC cell line, purified their sEVs, and tested their neurite outgrowth activity on dorsal root ganglia (DRG) neurons in vitro. sEVs purified from Ccnd1-overexpressing cells significantly increased neurite outgrowth of DRG compared to sEVs from parental or Pik3ca over-expressing cells. When implanted into C57BL/6 mice, Ccnd1 over-expressing tumor cells promoted significantly more tumor innervation in vivo. qPCR analysis of sEVs shows that increased expression of Ccnd1 altered the packaging of miRNAs (miR-15-5p, miR-17-5p, and miR-21-5p), many of which target transcripts important in regulating axonogenesis. These data indicate that genetic amplifications harbored by malignancies impose changes in sEV miRNA cargo, which can influence tumorc innervation.
© 2024 The Author(s). The FASEB Journal published by Wiley Periodicals LLC on behalf of Federation of American Societies for Experimental Biology.
Conflict of interest statement
Figures


Similar articles
-
Tumor-infiltrating nociceptor neurons promote immunosuppression.Sci Signal. 2025 Aug 5;18(898):eads7889. doi: 10.1126/scisignal.ads7889. Epub 2025 Aug 5. Sci Signal. 2025. PMID: 40763210
-
Morphine-induced hyperalgesia impacts small extracellular vesicle microRNA composition and function.J Pharmacol Exp Ther. 2025 Apr;392(4):103398. doi: 10.1016/j.jpet.2025.103398. Epub 2025 Feb 6. J Pharmacol Exp Ther. 2025. PMID: 40054390 Free PMC article.
-
Small Extracellular Vesicle-Associated MiRNAs in Polarized Retinal Pigmented Epithelium.Invest Ophthalmol Vis Sci. 2024 Nov 4;65(13):57. doi: 10.1167/iovs.65.13.57. Invest Ophthalmol Vis Sci. 2024. PMID: 39589346 Free PMC article.
-
miRNA packaging into small extracellular vesicles and implications in pain.Pain Rep. 2024 Oct 23;9(6):e1198. doi: 10.1097/PR9.0000000000001198. eCollection 2024 Dec. Pain Rep. 2024. PMID: 39450410 Free PMC article. Review.
-
Salivary exosomal microRNA profile as biomonitoring tool for diagnosis and prognosis of patients with head and neck squamous cell carcinoma: a systematic review.Arch Oral Biol. 2024 Sep;165:106012. doi: 10.1016/j.archoralbio.2024.106012. Epub 2024 May 27. Arch Oral Biol. 2024. PMID: 38879952
Cited by
-
Applications of nanomaterials in head and neck squamous cell carcinoma: current progress and perspectives.Discov Nano. 2025 Aug 18;20(1):141. doi: 10.1186/s11671-025-04328-1. Discov Nano. 2025. PMID: 40824466 Free PMC article. Review.
-
NSG2: a promising prognostic marker shaping the immune landscape of breast cancer.Front Immunol. 2024 Oct 18;15:1487447. doi: 10.3389/fimmu.2024.1487447. eCollection 2024. Front Immunol. 2024. PMID: 39493764 Free PMC article.
-
Understanding the role of nerves in head and neck cancers - a review.Oncol Rev. 2025 Jan 20;18:1514004. doi: 10.3389/or.2024.1514004. eCollection 2024. Oncol Rev. 2025. PMID: 39906323 Free PMC article. Review.
-
Cancer neuroscience in head and neck: interactions, modulation, and therapeutic strategies.Mol Cancer. 2025 Mar 31;24(1):101. doi: 10.1186/s12943-025-02299-6. Mol Cancer. 2025. PMID: 40165230 Free PMC article. Review.
References
-
- Hutchings C, Phillips JA, and Djamgoz MBA (2020) Nerve input to tumours: Pathophysiological consequences of a dynamic relationship. Biochim Biophys Acta Rev Cancer 1874, 188411. - PubMed
-
- Horvathova L, and Mravec B (2016) Effect of the autonomic nervous system on cancer progression depends on the type of tumor: solid are more affected then ascitic tumors. Endocr Regul 50, 215–224 - PubMed
-
- Amit M, Takahashi H, Dragomir MP, Lindemann A, Gleber-Netto FO, Pickering CR, Anfossi S, Osman AA, Cai Y, Wang R, Knutsen E, Shimizu M, Ivan C, Rao X, Wang J, Silverman DA, Tam S, Zhao M, Caulin C, Zinger A, Tasciotti E, Dougherty PM, El-Naggar A, Calin GA, and Myers JN (2020) Loss of p53 drives neuron reprogramming in head and neck cancer. Nature 578, 449–454 - PMC - PubMed
MeSH terms
Substances
Grants and funding
LinkOut - more resources
Full Text Sources
Medical
Research Materials
Miscellaneous
