. 2024 Jul 23;43(7):114447.
doi: 10.1016/j.celrep.2024.114447. Epub 2024 Jul 3.

Lipid-associated macrophages reshape BAT cell identity in obesity

Affiliations

Lipid-associated macrophages reshape BAT cell identity in obesity

Francesca Sciarretta et al. Cell Rep. .

Abstract

Obesity and type 2 diabetes cause a loss in brown adipose tissue (BAT) activity, but the molecular mechanisms that drive BAT cell remodeling remain largely unexplored. Using a multilayered approach, we comprehensively mapped a reorganization in BAT cells. We uncovered a subset of macrophages as lipid-associated macrophages (LAMs), which were massively increased in genetic and dietary model of BAT expansion. LAMs participate in this scenario by capturing extracellular vesicles carrying damaged lipids and mitochondria released from metabolically stressed brown adipocytes. CD36 scavenger receptor drove LAM phenotype, and CD36-deficient LAMs were able to increase brown fat genes in adipocytes. LAMs released transforming growth factor β1 (TGF-β1), which promoted the loss of brown adipocyte identity through aldehyde dehydrogenase 1 family member A1 (Aldh1a1) induction. These findings unfold cell dynamic changes in BAT during obesity and identify LAMs as key responders to tissue metabolic stress and drivers of loss of brown adipocyte identity.

Keywords: CP: Metabolism; adipocytes; extracellular mitochondria; immunometabolism; metabolism; mitochondria; single-cell RNA sequencing; thermogenesis; type 2 diabetes.


Conflict of interest statement

Declaration of interests J.R.B. is a member of the Scientific Advisory Board and receives research support from LUCA Sciences, Inc., has consulted for DeciBio within the past 12 months, receives royalties from Springer Nature Group, and is an inventor on pending patent applications related to the treatment of metabolic diseases and immunoassay diagnostics.

Figures

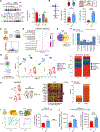
Figure 1.
Figure 1.. T2D induces BAT cell reshaping.
(A) Fasting glycemia in 8-week-old WT and db/db mice (n = 6 mice/group). Data were reported as mean ± SD. Student’s t test **p < 0.01. (B) Body weight (left), representative BAT photograph and hematoxylin/eosin staining (right) in BAT of 8-week-old WT and db/db mice (n = 6 mice/group). Data were reported as mean ± SD. Student’s t test **p < 0.01. (C) Volcano plot and hierarchical heatmap analysis of differentially expressed genes (DEGs: pAdj < 0.05) in BAT of 8-week-old WT and db/db mice (n = 4 mice/group). (D and E) Functional enrichment analysis for biological processes of downregulated (D) (log2 FC < −1.5; pAdj < 0.05) and upregulated (E) (log2 FC > 1.5; pAdj < 0.05) genes in BAT of 8-week-old WT and db/db mice (n = 4 mice/group). (F) Differentially represented proteins (DEPs: pAdj < 0.05) identified in BAT of 8-week-old WT and db/db mice (n = 4 mice/group). (G) 2D plot including DEGs and DEPs in BAT of 8-week-old WT and db/db mice (n = 4 mice/group). (H) Heatmap (left) and browning probability (right) of DEGs analyzed by ProFAT tool (n = 4 mice/group). (I) Correlograms between genes pertaining to white adipocytes (WATs), brown adipocytes (BATs), macrophages (MACs), myofibroblasts (MyoFBs) and extra-cellular matrix (ECM) (n = 4 mice/group).
Figure 2.
Figure 2.. Obesity promotes monocyte/macrophage accumulation in BAT.
(A) Body weight and fasting glycemia in 8- and 16-week-old WT and db/db mice (n = 3/6 mice/group). Data were reported as mean ± SD. Student’s t test *p < 0.05, **p < 0.01. (B) Cell clusters identified by scRNA-seq of SVFs isolated from BAT of 8- and 16-week-old WT and db/db mice (SVF pool from BAT of n = 3 mice/group). (C) Violin plots reporting gene markers for cell type identified by scRNA-seq of the SVFs isolated from BAT of 8- and 16-week-old WT and db/db mice (SVF pool from n = 3 mice/group). (D) Immune cell dynamics (Ptprc-positive cells) identified by scRNA-seq of in the SVFs isolated from BAT of 8- and 16-week-old WT) and db/db mice (SVF pool from BAT of n = 3 mice/group). (E) Bar plots reporting cell types identified by scRNA-seq of the SVFs isolated from BAT of 8- and 16-week-old WT and db/db mice (SVF pool from n = 3 mice/group).
Figure 3.
Figure 3.. LAMs are increased in BAT of obese mice.
(A) Monocyte/macrophage subclusters identified by scRNA-seq of SVFs isolated from BAT of WT, 8-, and 16-week-old db/db and HFD mice (SVF pool from BAT of n = 3 mice/group). (B) Dot plot reporting gene markers monocyte/macrophage subclusters identified by scRNA-seq of the SVFs isolated from BAT of WT, 8-, and 16-week-old db/db and HFD mice (SVF pool from BAT of n = 3 mice/group). (C) Heatmap of lipid-handling and lysosomal genes expressed in monocyte/macrophage subclusters (SVF pool from n = 3 mice/group). (D) Bar plots reporting monocyte/macrophage ratio identified by scRNA-seq of the SVFs isolated from BAT of WT, 8-, and 16-week-old db/db and HFD mice (SVF pool from BAT of n = 3 mice/group). (E–G) Gating strategy (E) of flow cytometry analyses of total macrophages (2 × 10³ to 10 × 103) and LAM in SVFs (7 × 10⁵ to 30 × 104 cells) isolated from BAT of WT, 8-, and 16-week-old HFD and db/db mice (n = 5/6 mice/group) (F and G). (H) Cell-sorting strategy (left) and analysis of gene expression markers (right) in LAM vs. no-LAM cells. Data were reported as mean ± SD. Student’s t test *p < 0.05, **p < 0.01. (I) Inference procedures, as employed in velocyto and scVelo, involve fitting a transcription model and predicting velocities at the single-cell level. Velocity vectors (left) and velocity confidence (right) were projected onto the UMAP.
Figure 4.
Figure 4.. LAMs show foaming cell-like features.
(A) Venn diagram of upregulated genes in LAM of WT, 8-, and 16-week-old db/db and HFD mice. (B) Functional enrichment analysis for biological processes of upregulated genes in LAM of BAT of WT, 8-, and 16-week-old db/db and HFD mice. (C) Foaming cell projection of LAM and non-LAM macrophages of BAT of WT and 16-week-old db/db mice. (D) Foaming cell projection of LAM derived from BAT of WT, 8-, and 16-week-old db/db and HFD mice. (E) Inflammatory phenotype of LAM derived from BAT of WT, 8-, and 16-week-old db/db and HFD mice. (F) Flow cytometry analyses of BODIPY 493/503 and LysoTracker red positive macrophages (CD45+/CD11b+/F4.70+; for gating strategy see Figure 3E) in BAT of WT and db/db mice (upper) or ND and HFD mice (lower). Data were reported as mean ± SD. Student’s t test *p < 0.05, **p < 0.01 (n = 5 mice/group). (G) Representative immunohistochemistry image detecting F4/80+ foaming-like macrophages in BAT of db/db (upper) and HFD (lower) mice. Optical magnification (O.M.) 3400, high-power field 3600. Red arrow indicates macrophages with foamy-like features. Scale bar: 20 μm.
Figure 5.
Figure 5.. ATGL downregulation specifically in BAT promotes tissue expansion causing LAM recruitment.
(A) Representative immunoblots (left) and densitometric analysis (right) of ATGL in BAT of WT, 8-week-old db/db, and HFD mice. Hormone sensitive lipase (HSL) was used as loading control. (B) Body weight (left), representative BAT photograph, hematoxylin/eosin staining (center), and BAT weight (right) of 8-week-old WT and Ucp1Δ/Δ mice (n = 11 mice/group. Data were reported as mean ± SD. Student’s t test *p < 0.05, ***p < 0.001). (C) Volcano plot of DEGs (pAdj < 0.05) in BAT of 8-week-old WT and Ucp1Δ/Δ mice (n = 4 mice/group). (D) Functional enrichment analysis for biological processes of downregulated (log2 FC < 1.5; pAdj < 0.05) and upregulated (log2 FC > 1.5; pAdj < 0.05) genes in BAT of 8-week-old WT and Ucp1Δ/Δ mice (n = 4 mice/group). (E) Venn diagram of upregulated genes (log2 FC > 1.5; pAdj < 0.05) in BAT of 8-week-old WT, db/db, and Ucp1Δ/Δ mice (n = 4 mice/group). (F) Functional enrichment analysis for biological processes of overlapping genes in BAT of 8-week-old WT, db/db, and Ucp1Δ/Δ mice (n = 4 mice/group). (G) Cell clusters (left) and cell abundance (right) identified by scRNA-seq of Ptprc-positive cells isolated from BAT of WT and Ucp1Δ/ΔΔ mice (GSE177635). (H) Heatmap of lipid-handling, lysosomal genes (left) in LAM and P-LAM and their dynamics (right) identified by scRNA-seq of Ptprc-positive cells isolated from BAT of WT and Ucp1Δ/Δ mice (GSE177635). (I and J) Flow cytometry analyses of total macrophages (I) and LAM (J) in BAT of WT and Ucp1Δ/Δ mice (n = 6 mice/group). Data were reported as mean ± SD. Student’s t test *p < 0.05, **p < 0.01, ***p < 0.001.
Figure 6.
Figure 6.. LAMs remove the extracellular vesicles released from brown adipocytes via CD36 maintaining BAT identity.
(A) Proteomic profiling of EVs isolated from BAT of WT and 8-week-old db/db mice. The upregulated proteins (FC > 2.7; p < 0.05) were integrated with GO terms for mitochondrion (GO:0005739) and lipid droplet (GO:0005811). (B) Representative immunoblots of PDHβ, PLIN4, and 4-HNE in EVs released from BAT isolated from WT, 8-week-old db/db, and HFD mice. CD63 was used as loading control. (C) Representative immunoblots of PC, PDHβ, and 4-HNE in EVs released from palmitate (PA)-treated T37i brown adipocytes. Ponceau was used as loading control. (D) Representative immunoblots of PC, PDHβ, and 4-HNE in EVs released from palmitate (PA)-treated T37i brown adipocytes. Ponceau was used as loading control. (E) Cytofluorimetric measurements of EVs released from mitoDsRed-transfected brown adipocytes treated with PA or PA with chloroquine (CQ). Data were reported as mean ± SD. Student’s t test **p < 0.01. (F) Cytofluorimetric measurements of EVs released from Bodipy C11-loaded brown adipocytes treated with PA or PA with CQ. Lipid peroxides were expressed as oxidized-to-reduced ratio. Data were reported as mean ± SD. Student’s t test *p < 0.05. (G) Cytofluorimetric measurements of BAT macrophages positive to brown-adipocyte mitochondria in ND and HFD mice calculated for weight of tissue (n = 11/14 mice/group. Data were reported as mean ± SD. Student’s t test *p < 0.05). (H) Cytofluorimetric analysis of macrophages positive to brown-adipocyte mitochondria in ND and HFD mice calculated in total macrophage fraction (n = 14 mice/group). Data were reported as mean ± SD. Student’s t test *p < 0.05. (I and J) Flow cytometry measurements of macrophages positive to EVs released from MTG loaded (I) or mitoDsRed-transfected (J) brown adipocytes treated with PA or PA with CQ. Data were reported as mean ± SD. Student’s t test ***p < 0.001. (K) Representative image of BM chemotaxis following treatment with EVs released brown adipocytes treated with PA or PA with CQ (left). Single gene expression of macrophage markers in BM treated with brown-adipocyte EVs or brown-adipocyte EVs with CQ. Data were reported as mean ± SD. Student’s t test *p < 0.05. (L) Venn diagram of upregulated genes in BAT macrophages of 8-week-old db/db mice, GO terms of apoptotic cell clearance (GO:0043277) and phagocytosis (GO:0006909) (left), and heatmap of the seven overlapping genes in BAT macrophages of 8-week, 16-week, and HFD mice (right). (M) Scr or CD36 downregulating BM chemotaxis following brown-adipocyte EVs. Data were reported as mean ± SD. Student’s t test **p < 0.01. (N) Single gene expression of Adgre1, Tnfα, and Lipa in Scr or CD36−/− macrophages (BM) treated with brown-adipocyte EVs. Data were reported as mean ± SD. Student’s t test *p < 0.05. (O) Single gene expression of Pparγ, Pgc1α, Cox7a, and Cidea in brown adipocytes co-cultured with Scr or CD36−/− macrophages (RAW264.7 cells). Data were reported as mean ± SD. Student’s t test *p < 0.05. (P) Representative BAT photograph (left), body weight (center), and BAT weight (right) of 8-week-old WT and MACCD36KO mice (n = 4 mice/group). Data were reported as mean ± SD. Student’s t test *p < 0.05. (Q) Volcano plot of DEGs: pAdj < 0.05) in BAT of 8-week-old WT and MACCD36KO mice (n = 4 mice/group) (left). Functional enrichment analysis for biological processes of downregulated (log2 FC < −1.5; pAdj < 0.05) and upregulated (log2 FC > 1.5; pAdj < 0.05) genes in BAT of 8-week-old WT and MACCD36KO mice (n = 4 mice/group) (right). (R) DEPs (log2 1.5 < FC > 1.5; pAdj < 0.05) identified in BAT of 8-week-old WT and MACCD36KO mice (n = 4 mice/group) (left). 2D plot including DEGs and DEPs in BAT of 8-week-old WT and MACCD36KO mice (n = 4 mice/group) (right). (S) Heatmap (left) and browning probability (right) of DEGs analyzed by ProFAT tool (n = 4 mice/group).
Figure 7.
Figure 7.. LAM release Tgfβ1 lowering brown-adipocyte identity through Aldh1a1 pathway.
(A) Ligand-receptor communication analysis by Connectome and CellChat., (B) LAM-related genes (upper) and representative image of oil red O (lower) in RAW264.7 (MAC) treated with EVs released by brown adipocytes (E-MTAB-10655). (C) Tgfβ1 protein level in cell culture of RAW264.7 macrophages treated with EVs released by brown adipocytes or serum of WT and 8-week-old db/db mice (n = 6 mice/group). Data were reported as mean ± SD. Student’s t test *p < 0.05, **p < 0.01. (D) Tgfβ1 mRNA expression in EVs-treated macrophages downregulating CD36. Data were reported as mean ± SD. ANOVA test **p < 0.01. (E) Venn diagram including the upregulated genes in BAT of db/db mice and downregulated genes in BAT of MACCD36KO mice. (F) Enrichment analysis for transcription factor perturbation related to 44 overlapping genes and differential gene expression analysis in the WAT of SMAD3KO vs. WT mice. (G) Heatmap of correlation analysis between Tgfβ1 and WAT and BAT-related genes in BAT of db/db mice. (H) Correlation analysis between Tgfβ1 and Aldh1a1 in BAT of db/db mice. (I and J) Heatmap reporting gene expression levels in BAT of db/db, Ucp1 KO (I), and MACsCD36KO mice (J) (n = 3/4 mice/group). (K) Aldh1a1 mRNA expression in primary brown adipocytes treated with 10 μM Tgfβ1 for 16 h. Data were reported as mean ± SD. Student’s t test **p < 0.01. (L) Aldh1a1 mRNA expression in T37i brown adipocytes cultured with RAW264.7 cells downregulating CD36. Data were reported as mean ± SD. Student’s t test *p < 0.05. (M) Mitochondrial gene expression in primary adipocytes downregulating Aldh1a1 after treatment with 10 μM Tgfβ1 for 16 h. Data were reported as mean ± SD. ANOVA test *p < 0.05. (N) Mitochondrial gene expression in primary adipocytes co-cultured (24 h in serum free) with EVs-treated RAW264.7 macrophages downregulating Tgfβ1. Data were reported as mean ± SD. Student’s t test *p < 0.05, **p < 0.01.

References

    1. Zheng Y, Ley SH, and Hu FB (2018). Global aetiology and epidemiology of type 2 diabetes mellitus and its complications. Nat. Rev. Endocrinol. 14, 88–98. 10.1038/nrendo.2017.151. - DOI - PubMed
    1. Guilherme A, Virbasius JV, Puri V, and Czech MP (2008). Adipocyte dysfunctions linking obesity to insulin resistance and type 2 diabetes. Nat. Rev. Mol. Cell Biol. 9, 367–377. 10.1038/nrm2391. - DOI - PMC - PubMed
    1. Rohm TV, Meier DT, Olefsky JM, and Donath MY (2022). Inflammation in obesity, diabetes, and related disorders. Immunity 55, 31–55. 10.1016/j.immuni.2021.12.013. - DOI - PMC - PubMed
    1. Cottam MA, Caslin HL, Winn NC, and Hasty AH (2022). Multiomics reveals persistence of obesity-associated immune cell phenotypes in adipose tissue during weight loss and weight regain in mice. Nat. Commun. 13, 2950. 10.1038/s41467-022-30646-4. - DOI - PMC - PubMed
    1. Jaitin DA, Adlung L, Thaiss CA, Weiner A, Li B, Descamps H, Lundgren P, Bleriot C, Liu Z, Deczkowska A, et al. (2019). Lipid-Associated Macrophages Control Metabolic Homeostasis in a Trem2-Dependent Manner. Cell 178, 686–698.e14. 10.1016/j.cell.2019.05.054. - DOI - PMC - PubMed

Publication types